. 2018 Oct 30;8(64):36705-36711.
doi: 10.1039/c8ra07795a. eCollection 2018 Oct 26.

Ion transport through a nanoporous C2N membrane: the effect of electric field and layer number

Affiliations

Ion transport through a nanoporous C2N membrane: the effect of electric field and layer number

You-Sheng Yu et al. RSC Adv. .

Abstract

Ion transport through a two-dimensional membrane with nanopores plays an important role in many scientific and technical applications (e.g., water desalination, ion separation and nanofiltration). Although there have been many two-dimensional membranes for these applications, the problem of how to controllably fabricate nanopores with proper shape and size still remains challenging. In the present work, the transport of ions through a C2N membrane with intrinsically regular and uniformly distributed nanopores is investigated using all-atom molecular dynamic simulations. It was found that the monolayer C2N membrane possesses higher ion permeability compared to the graphene membrane because of its higher density of nanopores. In addition, it exhibits excellent ion selectivity under a low electric field due to the distinct dehydration capabilities and interaction behaviors (with the pore edges) of the different ions. Furthermore, we found that multilayer C2N membranes have weak ion selectivity, but show promising potential for desalination. The present study may provide some physical insights into the experimental design of C2N-based nanodevices in nanofluids.


Conflict of interest statement

There are no conflicts to declare.

Figures

Fig. 1
Fig. 1. Schematic illustration of ion transport through a C2N membrane. (a) An electric field along the z-axis drives ion transport through the C2N membrane. For clarity, water molecules in the simulation box are not displayed. (b) The atomic structure of the C2N monolayer, bilayer and trilayer membranes; the C and N atoms are depicted as cyan and blue spheres, respectively; the initial stacking of the multilayer C2N membrane was A–B–C.
Fig. 2
Fig. 2. (a) The number of passed ions as a function of time under an electric field of 0.1 V nm−1 and 0.5 V nm−1. (b) The ionic currents for each ion through the monolayer C2N membrane as a function of the electric field. The inset is a zoomed in graph of the ionic currents under an electric field of 0.1 V nm−1 to 0.5 V nm−1. The error bars represent the standard deviation obtained from three independent runs. (c) The permeability ratio for three types of ion through the monolayer C2N membrane. The dashed line stands for the case of the 1 : 1 binary K+/Li+ mixed solution with the concentrations 0.5 M (mix1), 1.0 M (mix2) and 1.5 M (mix3). The inset shows the permeability ratio of K+/Na+versus the electric field. The number of passed Cl ions was always zero.
Fig. 3
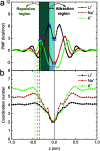
Fig. 3. The potential of mean force profiles (a) and the coordination number distribution of ions with water molecules (b) along the z-axis for three types of ion passing through the monolayer C2N membrane in the absence of an electric field. The center of the monolayer C2N membrane is represented by the gray solid line at z = 0. The dashed line and the dotted line represent the minimum and maximum in the PMF, respectively. The black, red and green colors represent the Li+, Na+ and K+ ions. The region between the dotted line and the solid line is defined the attraction region; the region from the dashed line to the dotted line is defined the repulsion region. For the sake of brevity, only the repulsion (the dark cyan shaded area) and attraction regions (the light cyan shaded area) for the Li+ ion are shown.
Fig. 4
Fig. 4. The position probability distribution of ions along the z direction under the electric fields E = 1.0 V nm−1 (a), E = 0.1 V nm−1 (b) and E = 0.3 V nm−1 (c). The meaning of the solid, dashed and dotted lines is the same as that in Fig. 3a.
Fig. 5
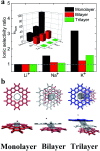
Fig. 5. (a) The ionic selectivity ratio of three types of ion as a function of the number of layers under E = 1.0 V nm−1. The inset shows the number of passed ions as a function of the ion type and the layer number. The ionic selectivity ratio is defined as the ratio of the number of passed ions to the number of passed Li+ ions. (b) The stacking (upper panel) and snapshots (lower panel) of a single K+ ion through the membranes with different numbers of layers. The red represents the first layer C2N sheet, the white is the second layer C2N sheet and the blue is the third layer C2N sheet. The gray cylinder represents the passage of the ion. The pink bead represents the K+ ion. In the lower panel, the transport of one specific ion is illustrated in detail, and the ion positions are marked for a series of uniformly distributed times in the ion transport process.
Fig. 6
Fig. 6. (a) The rate of electroosmotic water flow in the membranes with different numbers of layers under E = 1.0 V nm−1. The error bars represent the standard deviation obtained from three independent runs. The transport process of water molecules induced by the Li+ ion (b) and K+ ion (c) in the monolayer C2N membrane. The transport process of water molecules induced by the Li+ ion (d) and K+ ion (e) in the bilayer C2N membrane. The red bead represents the O atom in the water molecule, the cyan bead is the Li+ ion and K+ ion is represented by the pink bead.

Similar articles

Cited by

References

    1. Bagal S. K. Brown A. D. Cox P. J. Omoto K. Owen R. M. Pryde D. C. Sidders B. Skerratt S. E. Stevens E. B. Storer R. I. Swain N. A. J. Med. Chem. 2013;56:593–624. doi: 10.1021/jm3011433. - DOI - PubMed
    1. Cohen-Tanugi D. Grossman J. C. Nano Lett. 2012;12:3602–3608. doi: 10.1021/nl3012853. - DOI - PubMed
    1. Feng J. W. Ding H. M. Ma Y. Q. Phys. Chem. Chem. Phys. 2016;18:28290–28296. doi: 10.1039/C6CP04201E. - DOI - PubMed
    1. Wang L. Y. Wu H. A. Wang F. C. RSC Adv. 2017;7:20360–20368. doi: 10.1039/C7RA00890B. - DOI
    1. Jordan E. Bell R. G. Wilmer D. Koller H. J. Am. Chem. Soc. 2006;128:558–567. doi: 10.1021/ja0551887. - DOI - PubMed