. 2022 Apr 26:13:831162.
doi: 10.3389/fgene.2022.831162. eCollection 2022.

Construction of a Comprehensive Diagnostic Scoring Model for Prostate Cancer Based on a Novel Six-Gene Panel

Affiliations

Construction of a Comprehensive Diagnostic Scoring Model for Prostate Cancer Based on a Novel Six-Gene Panel

Yunfeng Liu et al. Front Genet. .

Abstract

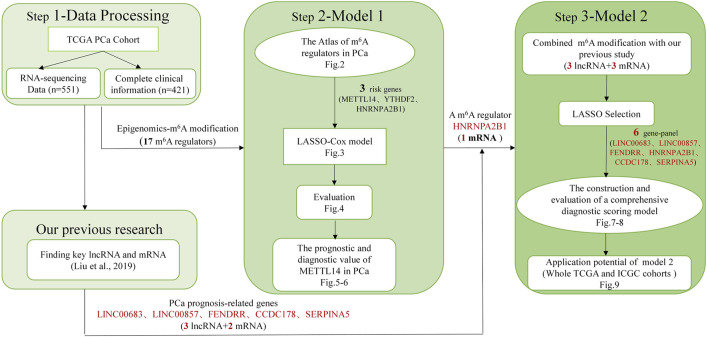
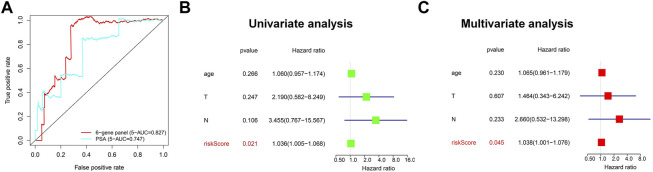
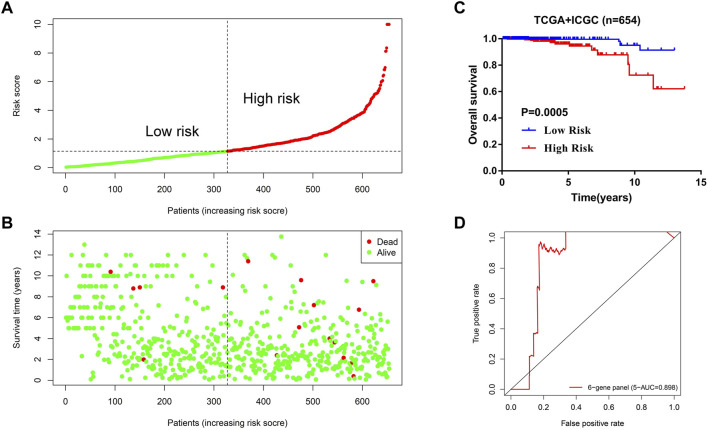
Accumulating evidence indicates that the N6-methyladenosine (m6A) modification plays a critical role in human cancers. Given the current understanding of m6A modification, this process is believed to be dynamically regulated by m6A regulators. Although the discovery of m6A regulators has greatly enhanced our understanding of the mechanism underlying m6A modification in cancers, the function and role of m6A in the context of prostate cancer (PCa) remain unclear. Here, we aimed to establish a comprehensive diagnostic scoring model that can act as a complement to prostate-specific antigen (PSA) screening. To achieve this, we first drew the landscape of m6A regulators and constructed a LASSO-Cox model using three risk genes (METTL14, HNRNP2AB1, and YTHDF2). Particularly, METTL14 expression was found to be significantly related to overall survival, tumor T stage, relapse rate, and tumor microenvironment of PCa patients, showing that it has important prognostic value. Furthermore, for the sake of improving the predictive ability, we presented a comprehensive diagnostic scoring model based on a novel 6-gene panel by combining with genes found in our previous study, and its application potential was further validated by the whole TCGA and ICGC cohorts. Our study provides additional clues and insights regarding the treatment and diagnosis of PCa patients.

Keywords: METTL14; diagnostic scoring model; m6A modification; prostate cancer; tumor microenvironment.


Conflict of interest statement

The authors declare that the research was conducted in the absence of any commercial or financial relationships that could be construed as a potential conflict of interest.

Figures

FIGURE 1
FIGURE 1
Overall study design.
FIGURE 2
FIGURE 2
Atlas of m6A regulators in prostate cancer (PCa). (A) The process of m6A modification regulated by different types of m6A regualtors. (B) The location of m6A regulators within chromosomes is illustrated using Circos plots. (C) The potential correlation among m6A regulators. (D) The expression of m6A regulators in PCa is shown using a heat map. Red and green represent upregulated genes and downregulated genes, respectively. (E) The violin plot of the differentially expression m6A regulators between normal samples (light blue) and tumor samples (light red).
FIGURE 3
FIGURE 3
The construction of a LASSO-Cox diagnostic scoring model based on m6A regulators. (A) Univariate analysis of the 15 regulators on overall survival of PCa patients. (B,C) The coefficients of three m6A regulators are calculated by using the LASSO algorithm. (D) Kaplan–Meier analysis of PCa patients with low-risk (blue) and high-risk (red) groups in TCGA cohorts (N = 492).
FIGURE 4
FIGURE 4
Evaluation of the prediction performance of the m6A prognostic scoring model. (A) Heatmap showing the differences in the clinicopathologic features of PCa patients with low-risk group and high-risk groups. (B) The predictive efficiency of the 3-gene panel and PSA were shown by a 5-year ROC curve. (C,D) Univariate and multivariate analysis of the correlation between clinicopathological features and overall survival of PCa patients.
FIGURE 5
FIGURE 5
Underlying prognostic value of METTL14 in PCa. (A) Protein–protein interaction network of 17 m6A regulators in which the key role of METTL14 is shown. (B) Kaplan–Meier analysis of METTL14 with low expression (blue) and high expression (red) in PCa patients. (C,D) The association of METTL14 expression with different tumor stages and disease status. (E,F). Gene set enrichment analysis for TCGA PCa samples with high expression of the METTL14 signature.
FIGURE 6
FIGURE 6
Potential association between METTL14 expression and the tumor microenvironment. (A) Bar plots showing the proportion of 22 specific immune cells in each of the PCa samples. (B) Violin plot depicting the difference of immune infiltration in PCa samples with low or high METTL14 expression. (C) Pearson correlation analysis of five types of immune cell fractions with METTL14 expression (p < 0.05).
FIGURE 7
FIGURE 7
Construction of a comprehensive diagnostic scoring model for PCa. (A,B) The process of selecting risk genes using the LASSO algorithm. (C) Kaplan–Meier analysis of PCa patients for high-risk (red) and low-risk groups (blue). (D) Heatmap of differences in the clinicopathologic features of PCa patients for low-risk and high-risk groups.
FIGURE 8
FIGURE 8
Evaluation of the prediction performance of the 6-gene panel diagnostic scoring model in TCGA cohorts. (A) The predictive efficiency of the 6-gene panel model and PSA were shown by a 5-year ROC curve. (B,C) Univariate and multivariate analysis of the correlation between clinicopathological features and overall survival of PCa patients.
FIGURE 9
FIGURE 9
Application potential of the 6-gene panel scoring model in large-scale PCa cohort diagnosis. (A,B) The distribution of risk score and survival status of PCa patients in the whole TCGA and ICGC cohorts (N = 654). (C) Kaplan–Meier analysis of PCa patients for high-risk (red) and low-risk groups (blue). (D) The predictive efficiency of the 6-gene panel scoring model was assessed by using a 5-year ROC curve.

Similar articles

Cited by

References

    1. Ardura J. A., Álvarez-Carrión L., Gutiérrez-Rojas I., Alonso V. (2020). Role of Calcium Signaling in Prostate Cancer Progression: Effects on Cancer Hallmarks and Bone Metastatic Mechanisms. Cancers 12, 1071–1097. 10.3390/cancers12051071 - DOI - PMC - PubMed
    1. Attard G., Parker C., Eeles R. A., Schröder F., Tomlins S. A., Tannock I., et al. (2016). Prostate Cancer. The Lancet 387, 70–82. 10.1016/s0140-6736(14)61947-4 - DOI - PubMed
    1. Barceló C., Etchin J., Mansour M. R., Sanda T., Ginesta M. M., Sanchez-Arévalo Lobo V. J., et al. (2014). Ribonucleoprotein HNRNPA2B1 Interacts with and Regulates Oncogenic KRAS in Pancreatic Ductal Adenocarcinoma Cells. Gastroenterology 147, 882–892. 10.1053/j.gastro.2014.06.041 - DOI - PubMed
    1. Barry M. J. (2009). Screening for Prostate Cancer - the Controversy that Refuses to Die. N. Engl. J. Med. 360, 1351–1354. 10.1056/NEJMe0901166 - DOI - PubMed
    1. Bovelstad H. M., Nygard S., Storvold H. L., Aldrin M., Borgan O., Frigessi A., et al. (2007). Predicting Survival from Microarray Data a Comparative Study. Bioinformatics 23, 2080–2087. 10.1093/bioinformatics/btm305 - DOI - PubMed