. 2022 Apr 26:13:865052.
doi: 10.3389/fgene.2022.865052. eCollection 2022.

Development and Validation of a Novel Gene Signature for Predicting the Prognosis of Idiopathic Pulmonary Fibrosis Based on Three Epithelial-Mesenchymal Transition and Immune-Related Genes

Affiliations

Development and Validation of a Novel Gene Signature for Predicting the Prognosis of Idiopathic Pulmonary Fibrosis Based on Three Epithelial-Mesenchymal Transition and Immune-Related Genes

Jiafeng Zheng et al. Front Genet. .

Abstract

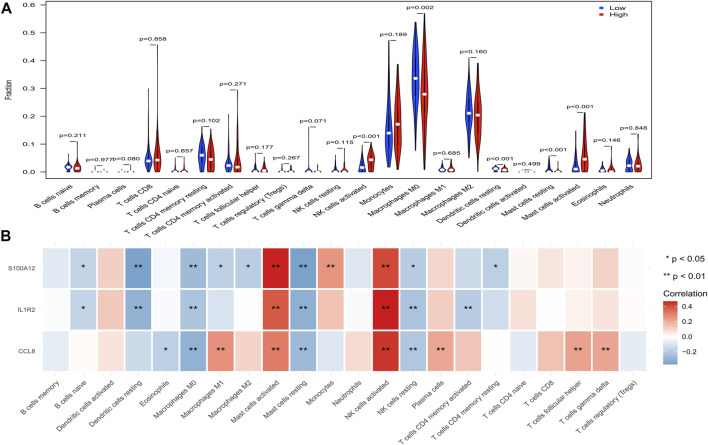
Background: Increasing evidence has revealed that epithelial-mesenchymal transition (EMT) and immunity play key roles in idiopathic pulmonary fibrosis (IPF). However, correlation between EMT and immune response and the prognostic significance of EMT in IPF remains unclear. Methods: Two microarray expression profiling datasets (GSE70866 and GSE28221) were downloaded from the Gene Expression Omnibus (GEO) database. EMT- and immune-related genes were identified by gene set variation analysis (GSVA) and the Estimation of STromal and Immune cells in MAlignant Tumors using Expression data (ESTIMATE) algorithm. Gene Ontology (GO) and Kyoto Encyclopedia of Genes and Genomes (KEGG) pathway enrichment analyses were performed to investigate the functions of these EMT- and immune-related genes. Cox and least absolute shrinkage and selection operator (LASSO) regression analyses were used to screen prognostic genes and establish a gene signature. Gene Set Enrichment Analysis (GSEA) and Cell-type Identification By Estimating Relative Subsets Of RNA Transcripts (CIBERSORT) were used to investigate the function of the EMT- and immune-related signatures and correlation between the EMT- and immune-related signatures and immune cell infiltration. Quantitative real-time polymerase chain reaction (qRT-PCR) was performed to investigate the mRNA expression of genes in the EMT- and immune-related signatures. Results: Functional enrichment analysis suggested that these genes were mainly involved in immune response. Moreover, the EMT- and immune-related signatures were constructed based on three EMT- and immune-related genes (IL1R2, S100A12, and CCL8), and the K-M and ROC curves presented that the signature could affect the prognosis of IPF patients and could predict the 1-, 2-, and 3-year survival well. Furthermore, a nomogram was developed based on the expression of IL1R2, S100A12, and CCL8, and the calibration curve showed that the nomogram could visually and accurately predict the 1-, 2-, 3-year survival of IPF patients. Finally, we further found that immune-related pathways were activated in the high-risk group of patients, and the EMT- and immune-related signatures were associated with NK cells activated, macrophages M0, dendritic cells resting, mast cells resting, and mast cells activated. qRT-PCR suggested that the mRNA expression of IL1R2, S100A12, and CCL8 was upregulated in whole blood of IPF patients compared with normal samples. Conclusion: IL1R2, S100A12, and CCL8 might play key roles in IPF by regulating immune response and could be used as prognostic biomarkers of IPF.

Keywords: epithelial–mesenchymal transition; idiopathic pulmonary fibrosis; immune; marker; prognosis.


Conflict of interest statement

The authors declare that the research was conducted in the absence of any commercial or financial relationships that could be construed as a potential conflict of interest.

Figures

FIGURE 1
FIGURE 1
EMT score affects the prognosis of IPF in the training set. (A) Optimal cutting point analysis suggested that the optimal cutting point of the EMT score was equal to −0.05 in the training set. Green represents low score of EMT, and red represents high score of EMT. (B) UMAP cluster of IPF patients in the training set based on EMT-related genes. (C) Survival curve of high- and low-EMT score groups.
FIGURE 2
FIGURE 2
Identification of EMT-related genes in the training set. (A) Heatmap of DEGs between patients of the EMT score-high group and patients in the immune score-low group. (B) Volcano plot of DEGs between patients of the EMT score-high group compared with patients in the immune score-low group. (C) GO enrichment analysis of EMT-related genes. (D) KEGG enrichment analysis of EMT-related genes.
FIGURE 3
FIGURE 3
Immune score affect the prognosis of IPF in the training set. (A) Correlation between the EMT and immune scores. (B) Optimal cutting point analysis suggested that the optimal cutting point of the immune score was equal to 2,962.31 in the training set. Green represents low score of immune, and red represents high score of immune. (C) UMAP cluster of IPF patients in the training set based on immune-related genes. (D) Survival curve of high- and low-immune score groups. (E) Survival curve of high- and low-EMT and immune score groups.
FIGURE 4
FIGURE 4
Identification of EMT- and immune-related genes and functional enrichment analysis in the training set. (A) Heatmap of DEGs between patients of the immune score-high group and patients of the immune score-low group. (B) Volcano plot of DEGs between patients of the immune score-high group and patients of the immune score-low group. (C) Venn diagram to identify EMT- and immune-related genes (D) GO enrichment analysis of EMT- and immune-related genes. (E) KEGG enrichment analysis of EMT- and immune-related genes. (F) DO enrichment analysis of EMT- and immune-related genes. (G) Differences of 13 genes in G-GSE70866 between high- and low-EMT score groups. (H) Differences of 13 genes in H-GSE70866 between high- and low-immune score groups.
FIGURE 5
FIGURE 5
Construction and validation of the EMT- and immune-related gene signatures based on EMT- and immune-related genes. (A) Univariate Cox regression analysis identified genes related to the prognosis of IPF patients in the training set. (B) Screening of characteristic genes by LASSO regression analysis. (C) Multivariate Cox regression analysis to construct the EMT- and immune-related gene signatures in the training set. (D,E) Survival curve of high- and low-risk groups in the training set (D) and validation set (E). (F,G) ROC curves evaluated the efficiency of the risk signature for predicting 1-, 2-, and 3-year survival in the training set (F) and the validation set (G). (H,I) Three genes expression profiles, the risk score distribution, and patients’ survival status in the training set (H) and the validation set (I).
FIGURE 6
FIGURE 6
Construction and evaluation of a nomogram for predicting 1-, 2-, and 3-year survival rates of IPF patients in the training set. (A) Nomogram for predicting 1-, 2-, and 3-year survival of IPF patients. (B) Calibration curves showing the probability of 1-, 2-, and 3-year survival between the prediction and the observation.
FIGURE 7
FIGURE 7
Results of GSEA of KEGG pathway in high- and low-risk groups in the training set. (A) Chemokine signaling pathway. (B) Cytokine–cytokine receptor interaction. (C) B-cell receptor signaling pathway. (D) Natural killer cell-mediated cytotoxicity.
FIGURE 8
FIGURE 8
Analysis of immune infiltrating cells in high- and low-risk groups in the training set. (A) Comparison of infiltrated immune cells in high- and low- risk groups. (B) Correlation between IL1R2, S100A12, and CCL8 and infiltrated immune cells.
FIGURE 9
FIGURE 9
Validation of mRNA expression levels of IL1R2, S100A12, and CCL8 with the GSE708066 and GSE28221 datasets and qRT-PCR. (A) Differences of three genes in GSE70867-GPL14550. (B) Differences of three genes in GSE28221-GPL6480. (C) mRNA expression levels of IL1R2, S100A12, and CCL8 tested by qRT-PCR.

Similar articles

Cited by

References

    1. Acloque H., Adams M. S., Fishwick K., Bronner-Fraser M., Nieto M. A. (2009). Epithelial-mesenchymal Transitions: the Importance of Changing Cell State in Development and Disease. J. Clin. Invest. 119, 1438–1449. (Electronic)). 10.1172/JCI38019 - DOI - PMC - PubMed
    1. Batra H., Antony V. B. (2015). Pleural Mesothelial Cells in Pleural and Lung Diseases. J. Thorac. Dis. 7, 964. (Print)). 10.3978/j.issn.2072-1439.2015.02.19 - DOI - PMC - PubMed
    1. Chen H., Fang X., Zhu H., Li S., He J., Gu P., et al. (2014). Gene Expression Profile Analysis for Different Idiopathic Interstitial Pneumonias Subtypes. Exp. Lung Res. 40, 367–379. (Electronic)). 10.3109/01902148.2014.933985 - DOI - PubMed
    1. Chilosi M., Caliò A., Rossi A., Gilioli E., Pedica F., Montagna L., et al. (2017). Epithelial to Mesenchymal Transition-Related Proteins ZEB1, β-catenin, and β-tubulin-III in Idiopathic Pulmonary Fibrosis. Mod. Pathol. 30, 26–38. (Electronic)). 10.1038/modpathol.2016.147 - DOI - PubMed
    1. Coffey E., Newman D. R., Sannes P. L. (2013). Expression of Fibroblast Growth Factor 9 in Normal Human Lung and Idiopathic Pulmonary Fibrosis. J. Histochem. Cytochem. 61, 671–679. (Electronic)). 10.1369/0022155413497366 - DOI - PMC - PubMed