. 2022 Apr 26:13:871260.
doi: 10.3389/fgene.2022.871260. eCollection 2022.

A Polygenic Score for Type 2 Diabetes Improves Risk Stratification Beyond Current Clinical Screening Factors in an Ancestrally Diverse Sample

Affiliations

A Polygenic Score for Type 2 Diabetes Improves Risk Stratification Beyond Current Clinical Screening Factors in an Ancestrally Diverse Sample

James R Ashenhurst et al. Front Genet. .

Abstract

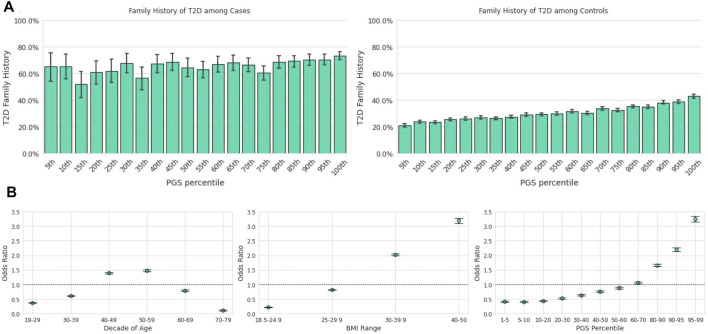
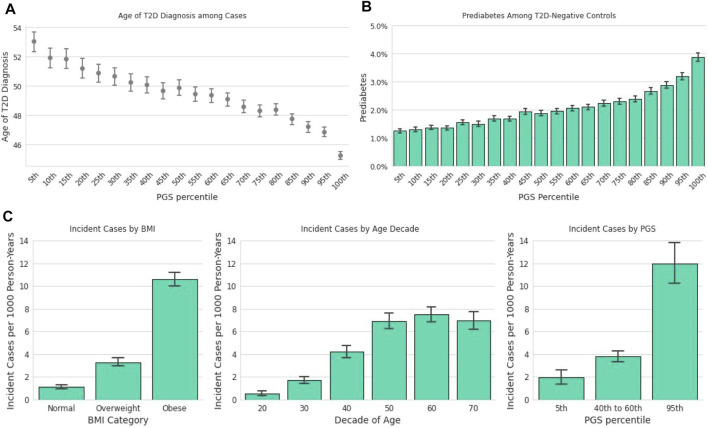
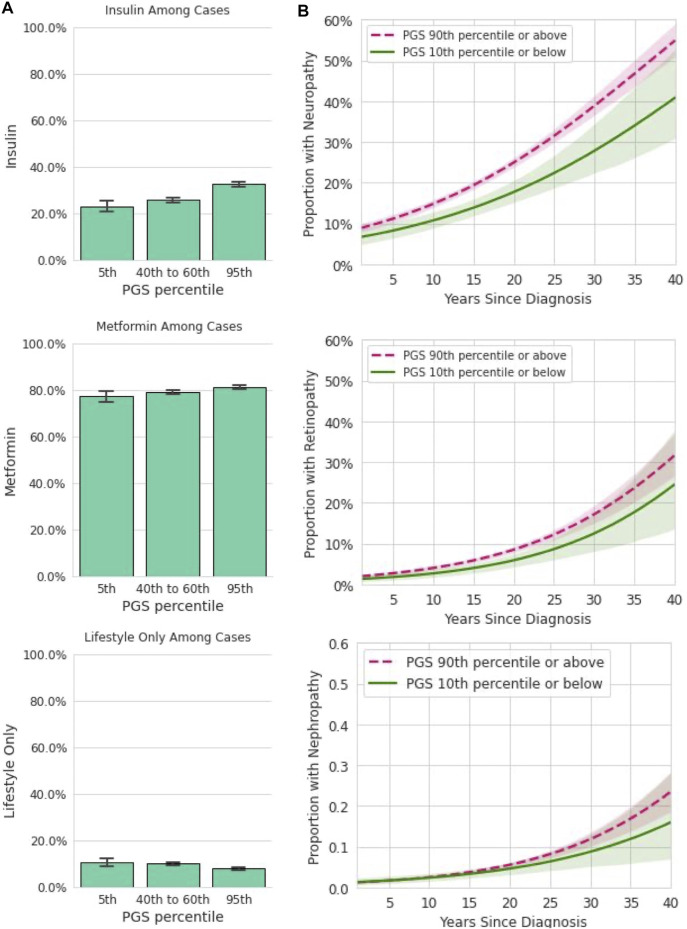
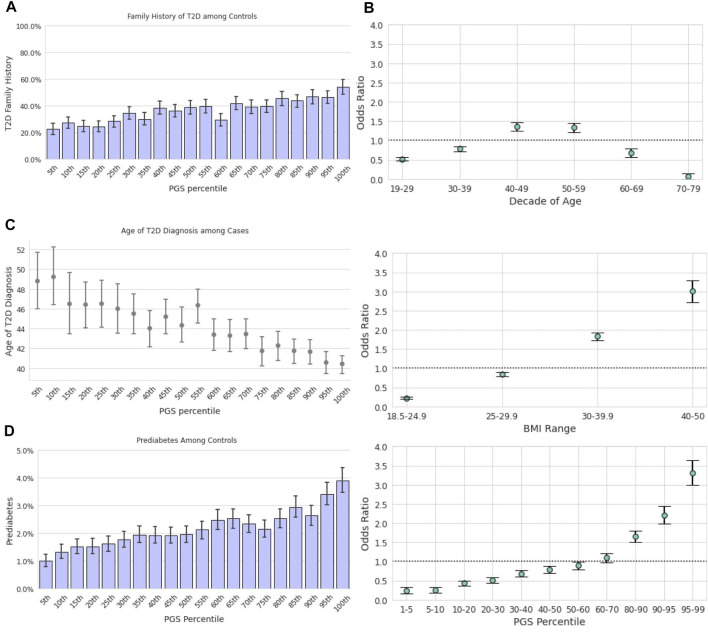
A substantial proportion of the adult United States population with type 2 diabetes (T2D) are undiagnosed, calling into question the comprehensiveness of current screening practices, which primarily rely on age, family history, and body mass index (BMI). We hypothesized that a polygenic score (PGS) may serve as a complementary tool to identify high-risk individuals. The T2D polygenic score maintained predictive utility after adjusting for family history and combining genetics with family history led to even more improved disease risk prediction. We observed that the PGS was meaningfully related to age of onset with implications for screening practices: there was a linear and statistically significant relationship between the PGS and T2D onset (-1.3 years per standard deviation of the PGS). Evaluation of U.S. Preventive Task Force and a simplified version of American Diabetes Association screening guidelines showed that addition of a screening criterion for those above the 90th percentile of the PGS provided a small increase the sensitivity of the screening algorithm. Among T2D-negative individuals, the T2D PGS was associated with prediabetes, where each standard deviation increase of the PGS was associated with a 23% increase in the odds of prediabetes diagnosis. Additionally, each standard deviation increase in the PGS corresponded to a 43% increase in the odds of incident T2D at one-year follow-up. Using complications and forms of clinical intervention (i.e., lifestyle modification, metformin treatment, or insulin treatment) as proxies for advanced illness we also found statistically significant associations between the T2D PGS and insulin treatment and diabetic neuropathy. Importantly, we were able to replicate many findings in a Hispanic/Latino cohort from our database, highlighting the value of the T2D PGS as a clinical tool for individuals with ancestry other than European. In this group, the T2D PGS provided additional disease risk information beyond that offered by traditional screening methodologies. The T2D PGS also had predictive value for the age of onset and for prediabetes among T2D-negative Hispanic/Latino participants. These findings strengthen the notion that a T2D PGS could play a role in the clinical setting across multiple ancestries, potentially improving T2D screening practices, risk stratification, and disease management.

Keywords: consumer genomics; diabetes screening; genetic risk; polygenic score; type 2 diabees.


Conflict of interest statement

JA, OSa, OSv, SD, RK, LB, MM, SA, PF, SS, JP and BK are current or former employees of 23andMe, Inc. with financial interest in the company.

Figures

FIGURE 1
FIGURE 1
Participant recruitment and analysis flow diagram. Three data sets were used for components of this analysis. The Descriptive Sample was used to generate plots, to estimate raw prevalences, or to estimate unadjusted odds ratios. The Incident Diagnosis Sample was used to assess the association between the polygenic score (PGS) and incident diagnosis over time. The Analytical Sample was used for regression models that included family history as a predictor. Sub-sampling was required due to missing data in key survey questions required for analysis, and participant attrition over time.
FIGURE 2
FIGURE 2
The T2D PGS is a predictor on par with traditional risk factors. Error bars here represent empirically derived 95% confidence intervals. (A): Research participants who self-reported their family history were binarized into two groups: those with a first-degree relative with T2D and those without. The fraction of participants with a positive family history of T2D (y-axis) is plotted as a function of PGS ventile (x-axis) among T2D cases (left panel) and T2D controls (right panel). (B): Unadjusted odds ratios (y-axis) of having T2D relative to the entire study population were calculated for each decade of age (left panel), BMI category (center panel), and PGS percentile (right panel). Error bars represent analytically computed 95% confidence intervals.
FIGURE 3
FIGURE 3
The T2D PGS is associated with diagnosis and incidence. (A): Mean age at T2D diagnosis (y-axis) is plotted against PGS ventiles (x-axis) among participants who self-reported their age at T2D diagnosis. (B): Prevalence of prediabetes (y-axis) is plotted for T2D-negative participants against ventiles of the PGS. (C): A one-year incidence ratio was calculated among participants who were T2D negative at an initial time point and filled out a 1-year follow-up survey. T2D incidence (y-axis) was found to increase with increasing BMI (x-axis, left panel), with age up to the 60s (x-axis, middle panel), and PGS percentile (x-axis, right panel).
FIGURE 4
FIGURE 4
Among participants with T2D, the PGS is associated with some forms of treatment and disease complications. (A): In a dataset restricted to participants who reported a T2D diagnosis and provided information on prescribed treatments, insulin, metformin, and lifestyle only are plotted (y-axis) for participants in the 5th, 40–60th, and 95th percentiles of the PGS (x-axis). Error bars represent empirically derived 95% confidence intervals. Insulin prescriptions were significantly associated with the PGS in multivariate models controlling for age, sex, BMI, and family history of T2D. (B): Data shown are the relationship between years since T2D diagnosis and microvascular complications, stratified by PGS percentile in a logistic model. Shaded areas represent 95% confidence intervals. Neuropathy was significantly associated with the PGS in multivariate models controlling for age, sex, BMI, and family history of T2D.
FIGURE 5
FIGURE 5
Repeated analysis in the Hispanic/Latino sample. (A): The prevalence of family history of T2D among T2D-negative participants. Data among T2D-positive participants are not provided due to privacy practices. (B): Odds ratios (y-axis) of having T2D relative to the Hispanic/Latino study population were calculated for each decade of age, BMI category, and Latino-specific PGS percentile. Error bars represent analytically computed 95% confidence intervals. (C): Mean age at T2D diagnosis among cases (y-axis) is plotted against Hispanic/Latino-specific PGS ventiles (x-axis) among participants who self-reported their age at T2D diagnosis. Error bars represent empirically derived 95% confidence intervals. (D): The prevalence of prediabetes among T2D-negative participants was significantly associated with the PGS, as shown with increasing ventiles of the PGS distribution. Data among T2D-positive participants are not provided due to privacy practices.

Similar articles

Cited by

References

    1. 23andMe (2019). 23andMe’s Populations Collaborations Program Supports Research in Understudied Groups. 23andMe Blog. Available at: https://blog.23andme.com/23andme-research/23andmes-population-collaborat... (Accessed July 24, 2020).
    1. Almgren P., Lehtovirta M., Lehtovirta M., Isomaa B., Sarelin L., Taskinen M. R., et al. (2011). Heritability and Familiality of Type 2 Diabetes and Related Quantitative Traits in the Botnia Study. Diabetologia 54, 2811–2819. 10.1007/s00125-011-2267-5 - DOI - PubMed
    1. American Diabetes Association (2018). 2. Classification and Diagnosis of Diabetes: Standards of Medical Care in Diabetes-2018. Diabetes Care 41, S13–S27. 10.2337/dc18-S002 - DOI - PubMed
    1. Ashenhurst J. R., Zhan J., Multhaup M. L., Kita R., Sazonova O. V., Krock B., et al. (2020). A Generalized Method for the Creation and Evaluation of Polygenic Scores. 23andMe, Inc. Available at: https://permalinks.23andme.com/pdf/23_21-PRSMethodology_May2020.pdf (Accessed January 3, 2022).
    1. Boyle J. P., Thompson T. J., Gregg E. W., Barker L. E., Williamson D. F. (2010). Projection of the Year 2050 burden of Diabetes in the US Adult Population: Dynamic Modeling of Incidence, Mortality, and Prediabetes Prevalence. Popul. Health Metrics 8, 29. 10.1186/1478-7954-8-29 - DOI - PMC - PubMed

LinkOut - more resources