Idiopathic Pulmonary Fibrosis Mortality Risk Prediction Based on Artificial Intelligence: The CTPF Model
- PMID: 35559265
- PMCID: PMC9086624
- DOI: 10.3389/fphar.2022.878764
Idiopathic Pulmonary Fibrosis Mortality Risk Prediction Based on Artificial Intelligence: The CTPF Model
Abstract
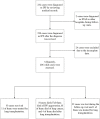
Background: Idiopathic pulmonary fibrosis (IPF) needs a precise prediction method for its prognosis. This study took advantage of artificial intelligence (AI) deep learning to develop a new mortality risk prediction model for IPF patients. Methods: We established an artificial intelligence honeycomb segmentation system that segmented the honeycomb tissue area automatically from 102 manually labeled (by radiologists) cases of IPF patients' CT images. The percentage of honeycomb in the lung was calculated as the CT fibrosis score (CTS). The severity of the patients was evaluated by pulmonary function and physiological feature (PF) parameters (including FVC%pred, DLco%pred, SpO2%, age, and gender). Another 206 IPF cases were randomly divided into a training set (n = 165) and a verification set (n = 41) to calculate the fibrosis percentage in each case by the AI system mentioned previously. Then, using a competing risk (Fine-Gray) proportional hazards model, a risk score model was created according to the training set's patient data and used the validation data set to validate this model. Result: The final risk prediction model (CTPF) was established, and it included the CT stages and the PF (pulmonary function and physiological features) grades. The CT stages were defined into three stages: stage I (CTS≤5), stage II (5 < CTS<25), and stage III (≥25). The PF grades were classified into mild (a, 0-3 points), moderate (b, 4-6 points), and severe (c, 7-10 points). The AUC index and Briers scores at 1, 2, and 3 years in the training set were as follows: 74.3 [63.2,85.4], 8.6 [2.4,14.8]; 78 [70.2,85.9], 16.0 [10.1,22.0]; and 72.8 [58.3,87.3], 18.2 [11.9,24.6]. The results of the validation sets were similar and suggested that high-risk patients had significantly higher mortality rates. Conclusion: This CTPF model with AI technology can predict mortality risk in IPF precisely.
Keywords: artificial intelligence (AI); deep learning; disease severity grade; idiopathic pulmonary fibrosis (IPF); pulmonary fibrosis stage; semantic segmentation.
Copyright © 2022 Wu, Yin, Chen, Zhang, Su, Shi, Weng, Jiang, Zhang, Zhang and Li.
Conflict of interest statement
The authors declare that the research was conducted in the absence of any commercial or financial relationships that could be construed as a potential conflict of interest.
Figures


Similar articles
-
CT quantification of the heterogeneity of fibrosis boundaries in idiopathic pulmonary fibrosis.Eur Radiol. 2021 Jul;31(7):5148-5159. doi: 10.1007/s00330-020-07594-y. Epub 2021 Jan 13. Eur Radiol. 2021. PMID: 33439318 Free PMC article.
-
Novel Artificial Intelligence-based Technology for Chest Computed Tomography Analysis of Idiopathic Pulmonary Fibrosis.Ann Am Thorac Soc. 2022 Mar;19(3):399-406. doi: 10.1513/AnnalsATS.202101-044OC. Ann Am Thorac Soc. 2022. PMID: 34410886
-
Artificial intelligence identifies inflammation and confirms fibroblast foci as prognostic tissue biomarkers in idiopathic pulmonary fibrosis.Hum Pathol. 2021 Jan;107:58-68. doi: 10.1016/j.humpath.2020.10.008. Epub 2020 Nov 5. Hum Pathol. 2021. PMID: 33161029
-
Radiomics and Artificial Intelligence in Pulmonary Fibrosis.J Imaging Inform Med. 2025 Jan 6. doi: 10.1007/s10278-024-01377-3. Online ahead of print. J Imaging Inform Med. 2025. PMID: 39762544 Review.
-
Research Progress of Respiratory Disease and Idiopathic Pulmonary Fibrosis Based on Artificial Intelligence.Diagnostics (Basel). 2023 Jan 18;13(3):357. doi: 10.3390/diagnostics13030357. Diagnostics (Basel). 2023. PMID: 36766460 Free PMC article. Review.
Cited by
-
Compare three diagnostic criteria of progressive pulmonary fibrosis.J Thorac Dis. 2024 Feb 29;16(2):1034-1043. doi: 10.21037/jtd-23-481. Epub 2024 Feb 27. J Thorac Dis. 2024. PMID: 38505056 Free PMC article.
-
Artificial intelligence-based quantification of pulmonary HRCT (AIqpHRCT) for the evaluation of interstitial lung disease in patients with inflammatory rheumatic diseases.Rheumatol Int. 2024 Nov;44(11):2483-2496. doi: 10.1007/s00296-024-05715-0. Epub 2024 Sep 9. Rheumatol Int. 2024. PMID: 39249141 Free PMC article.
-
The association of symptoms, pulmonary function test and computed tomography in interstitial lung disease at the onset of connective tissue disease: an observational study with artificial intelligence analysis of high-resolution computed tomography.Rheumatol Int. 2025 Aug 12;45(9):194. doi: 10.1007/s00296-025-05934-z. Rheumatol Int. 2025. PMID: 40794200 Free PMC article.
-
Radiomics-Based Artificial Intelligence and Machine Learning Approach for the Diagnosis and Prognosis of Idiopathic Pulmonary Fibrosis: A Systematic Review.Cureus. 2025 Jul 7;17(7):e87461. doi: 10.7759/cureus.87461. eCollection 2025 Jul. Cureus. 2025. PMID: 40772136 Free PMC article. Review.
-
The applications of CT with artificial intelligence in the prognostic model of idiopathic pulmonary fibrosis.Ther Adv Respir Dis. 2024 Jan-Dec;18:17534666241282538. doi: 10.1177/17534666241282538. Ther Adv Respir Dis. 2024. PMID: 39382448 Free PMC article. Review.
References
-
- Bazgir O., Barck K., Carano R. A. D., Weimer R. M., Xie L. (2020). “Kidney Segmentation Using 3D U-Net Localized with Expectation Maximization,” in 2020 IEEE Southwest Symposium on Image Analysis and Interpretation (SSIAI), 29-31 March 2020, 22–25. 10.1109/ssiai49293.2020.9094601 - DOI
LinkOut - more resources
Full Text Sources
Research Materials

