

Changes in transepithelial electrical resistance and intracellular ion concentration in TGF-β-induced epithelial-mesenchymal transition of retinal pigment epithelial cells
- PMID: 35559413
- PMCID: PMC9091112
Changes in transepithelial electrical resistance and intracellular ion concentration in TGF-β-induced epithelial-mesenchymal transition of retinal pigment epithelial cells
Abstract
Objective: This study aimed to investigate the changes in transepithelial electrical resistance (TEER) and ion concentrations, and their relationship in TGF-β-induced epithelial-mesenchymal transition (EMT) of retinal pigment epithelial (RPE) cells.
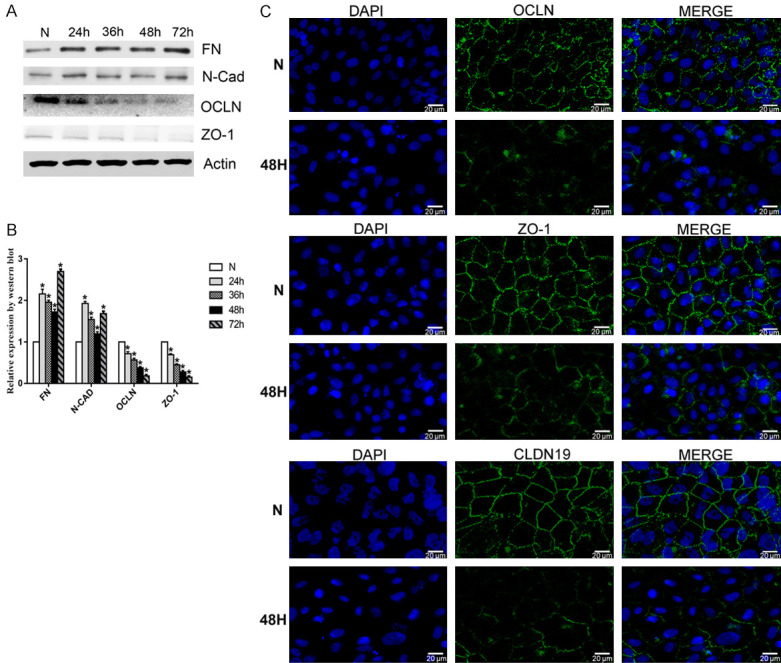
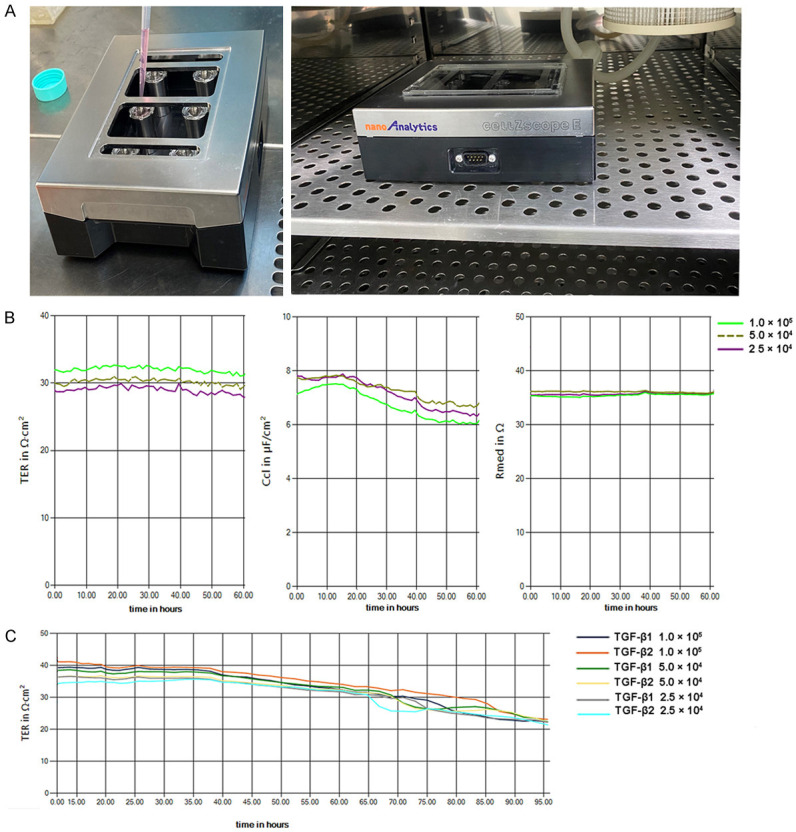
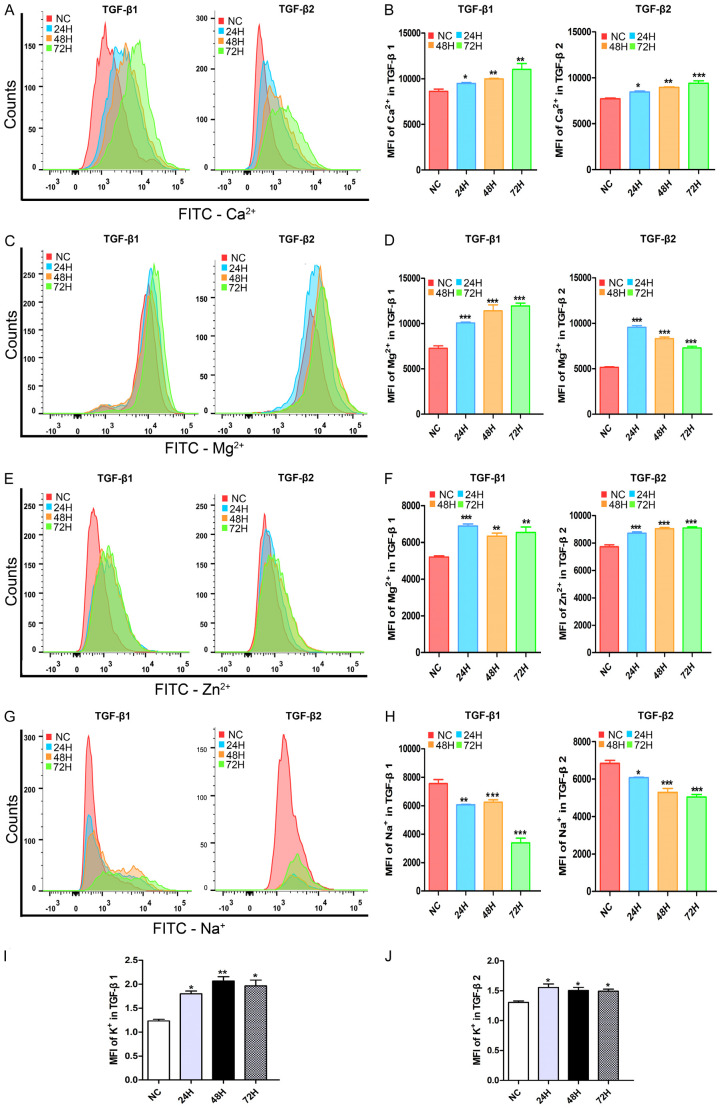
Methods: RPE cell line ARPE-19 was employed and treated with 10 ng/ml TGF-β1 and TGF-β2 to establish the EMT model in vitro. The EMT markers fibronectin, N-cadherin, occludin, zona occludens 1(ZO-1) and claudin-19 were investigated by western blot and immunofluorescence. CellZscope system was used to monitor the TEER values. Fluorescent probe, flow cytometry and automatic microplate reader were employed to detect the changes of Ca2+, Mg2+, Zn2+, Na+ and K+ in ARPE-19 cells.
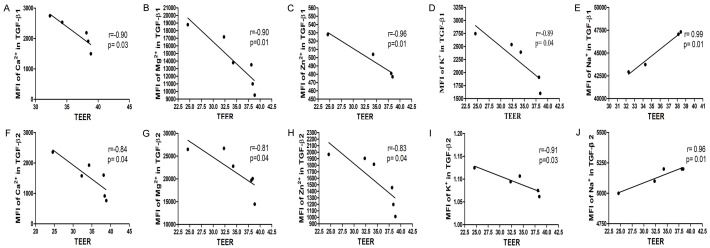
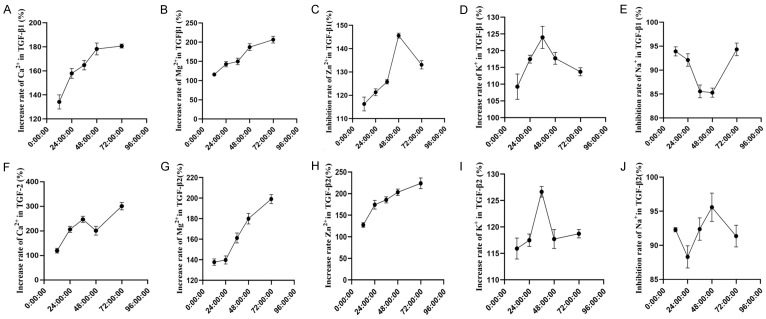
Results: The TGF-β1-induced EMT of ARPE-19 cells was marked by the disruption of the distribution of occludin, ZO-1, and claudin-19. The development of TEER was significantly disturbed in both TGF-β1 and TGF-β2 treatment groups. Also, the time course of the maximum slope indicated that the fastest decrease in TEER values occurred after 36 hours. The concentrations of Ca2+, Mg2+, Zn2+, and K+ increased in TGF-β1- and TGF-β2-treated ARPE-19 cells, while the concentration of Na+ decreased. Significant inverse correlations were detected between the concentrations of Ca2+, Mg2+, Zn2+, and K+ and TEER values in ARPE-19 cells treated with TGF-β1. The Na+ concentration and TEER values showed a positive correlation. Similar results were observed in the TGF-β2 treatment group. The time-effect analysis showed that the concentrations of Ca2+, Mg2+, Zn2+ and K+ increased and peaked after 72, 72, 48, and 72 h, respectively, with the extension of TGF-β1 treatment time. In the TGF-β2 treatment group, the Ca2+, Mg2+, Zn2+, and K+ concentrations were also upregulated and reached their highest after 72, 72, 72, and 36 h, respectively. In contrast, the concentration of Na+ decreased and reached the lowest after 48 h in the TGF-β1 treatment group and after 72 h in the TGF-β2 treatment group.
Conclusion: TGF-β1 and TGF-β2 disrupted the ARPE-19 cell monolayer, disturbed TJs integrity, downregulated TEER values, and changed intracellular ion permeability. These findings might help further understand the EMT of RPE cells during PVR.
Keywords: Epithelial-mesenchymal transition; ion; retinal pigment epithelial cell; tight junction proteins; transepithelial electrical resistance.
AJTR Copyright © 2022.
Conflict of interest statement
None.
Figures
Similar articles
-
Regulation of Na,K-ATPase β1-subunit in TGF-β2-mediated epithelial-to-mesenchymal transition in human retinal pigmented epithelial cells.Exp Eye Res. 2013 Oct;115:113-22. doi: 10.1016/j.exer.2013.06.007. Epub 2013 Jun 28. Exp Eye Res. 2013. PMID: 23810808 Free PMC article.
-
Eupatilin attenuates TGF-β2-induced proliferation and epithelial-mesenchymal transition of retinal pigment epithelial cells.Cutan Ocul Toxicol. 2021 Jun;40(2):103-114. doi: 10.1080/15569527.2021.1902343. Epub 2021 Apr 8. Cutan Ocul Toxicol. 2021. PMID: 33719768
-
Snail involves in the transforming growth factor β1-mediated epithelial-mesenchymal transition of retinal pigment epithelial cells.PLoS One. 2011;6(8):e23322. doi: 10.1371/journal.pone.0023322. Epub 2011 Aug 10. PLoS One. 2011. PMID: 21853110 Free PMC article.
-
TGF-β2 promotes RPE cell invasion into a collagen gel by mediating urokinase-type plasminogen activator (uPA) expression.Exp Eye Res. 2013 Oct;115:13-21. doi: 10.1016/j.exer.2013.06.020. Epub 2013 Jun 28. Exp Eye Res. 2013. PMID: 23810810
-
Blockade of Jagged/Notch pathway abrogates transforming growth factor β2-induced epithelial-mesenchymal transition in human retinal pigment epithelium cells.Curr Mol Med. 2014 May;14(4):523-34. doi: 10.2174/1566524014666140331230411. Curr Mol Med. 2014. PMID: 24694299 Review.
Cited by
-
A Microfluidic Platform for the Time-Resolved Interrogation of Polarized Retinal Pigment Epithelial Cells.Transl Vis Sci Technol. 2023 Nov 1;12(11):28. doi: 10.1167/tvst.12.11.28. Transl Vis Sci Technol. 2023. PMID: 38010283 Free PMC article.
References
-
- Li H, Li M, Xu D, Zhao C, Liu G, Wang F. Overexpression of Snail in retinal pigment epithelial triggered epithelial-mesenchymal transition. Biochem Biophys Res Commun. 2014;446:347–351. - PubMed
-
- Yang S, Li H, Li M, Wang F. Mechanisms of epithelial-mesenchymal transition in proliferative vitreoretinopathy. Discov Med. 2015;20:207–217. - PubMed
-
- Bastiaans J, van Meurs JC, van Holten-Neelen C, Nagtzaam NM, van Hagen PM, Chambers RC, Hooijkaas H, Dik WA. Thrombin induces epithelial-mesenchymal transition and collagen production by retinal pigment epithelial cells via autocrine PDGF-receptor signaling. Invest Ophthalmol Vis Sci. 2013;54:8306–8314. - PubMed
LinkOut - more resources
Full Text Sources
Research Materials
Miscellaneous