

Screening of key genes associated with m6A methylation in diabetic nephropathy patients by CIBERSORT and weighted gene coexpression network analysis
- PMID: 35559414
- PMCID: PMC9091087
Screening of key genes associated with m6A methylation in diabetic nephropathy patients by CIBERSORT and weighted gene coexpression network analysis
Abstract
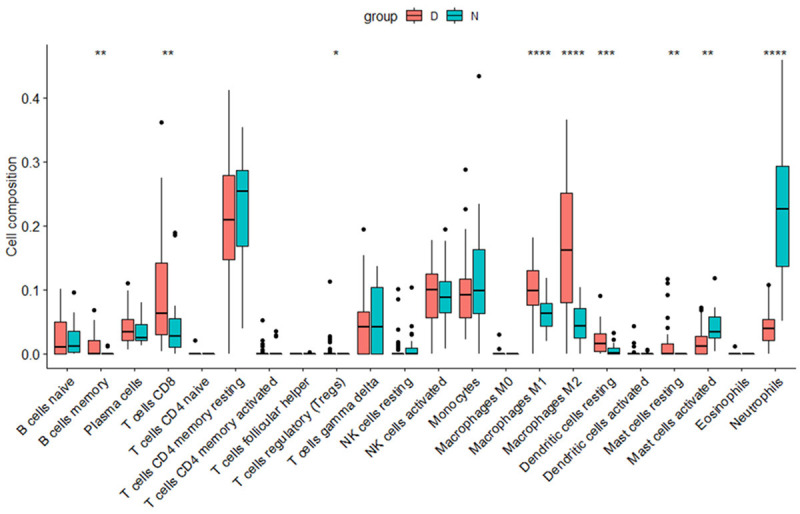
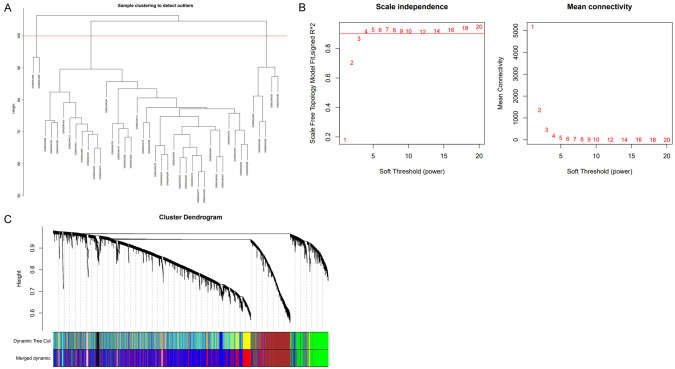
Diabetic nephropathy (DN) is a common complication of diabetes. Due to its complex pathogenesis, there is no effective treatment. M6A is a newly discovered epigenetic mechanism that may be involved in the development of diabetic nephropathy. In this study, we analyzed differentially expressed genes (DEG) in the GEO database (GSE96804) and paid attention to genes with m6A methylation. 623 DEGs in glomerular tissue were identified by comparing diabetic nephropathy with normal. Correlation analysis with 21 genes involved in m6A modification showed that 492 genes were associated with m6A methylation. According to the CIBERSORT algorithm, the infiltration of M1 macrophages in DN patients was significantly higher than that in normal samples. Weighted gene coexpression network analysis (WGCNA) was used to screen for the modules most correlated with the clinical features of M1 macrophages. The genes in the selected modules and 492 m6A-related DEGs were intersected by a Venn diagram, and 43 key genes were obtained. GO and KEGG analyses showed that these genes were mainly related to the positive regulation of protein aggregation and the transforming growth factor β receptor signaling pathway. According to a literature review, among the top 10 genes, HSPA1A, HSPA1B, CHI3L1, TYRO3 and PTH1R are markers in diabetic nephropathy, and their abnormal expression is associated with renal hypertrophy, proteinuria and glomerulosclerosis. These findings may provide evidence for the diagnosis and treatment of diabetic nephropathy.
Keywords: CIBERSORT; Diabetes; diabetic nephropathy; differential analysis; enrichment analysis; m6A; weighted gene co-expression network.
AJTR Copyright © 2022.
Conflict of interest statement
None.
Figures


Similar articles
-
Weighted gene co-expression network analysis and CIBERSORT screening of key genes related to m6A methylation in Hirschsprung's disease.Front Genet. 2023 Apr 18;14:1183467. doi: 10.3389/fgene.2023.1183467. eCollection 2023. Front Genet. 2023. PMID: 37144136 Free PMC article.
-
Identification of hub genes associated with pyroptosis in diabetic nephropathy patients using integrated bioinformatic analysis.Int Urol Nephrol. 2025 Jan;57(1):205-214. doi: 10.1007/s11255-024-04158-7. Epub 2024 Jul 19. Int Urol Nephrol. 2025. PMID: 39028495
-
Comprehensive analysis of diabetic nephropathy expression profile based on weighted gene co-expression network analysis algorithm.BMC Nephrol. 2021 Jul 2;22(1):245. doi: 10.1186/s12882-021-02447-2. BMC Nephrol. 2021. PMID: 34215202 Free PMC article.
-
Identification of PDK4 as Hub Gene for Diabetic Nephropathy Using Co-Expression Network Analysis.Kidney Blood Press Res. 2023;48(1):522-534. doi: 10.1159/000531288. Epub 2023 Jun 29. Kidney Blood Press Res. 2023. PMID: 37385224 Free PMC article.
-
Weighted gene co-expression network analysis of key targets and interventional mechanism of Milkvetch root in diabetic nephropathy.Eur Rev Med Pharmacol Sci. 2023 Oct;27(20):9614-9627. doi: 10.26355/eurrev_202310_34133. Eur Rev Med Pharmacol Sci. 2023. PMID: 37916327
Cited by
-
DPP2/7 is a Potential Predictor of Prognosis and Target in Immunotherapy in Colorectal Cancer: An Integrative Multi-omics Analysis.Comb Chem High Throughput Screen. 2024;27(11):1642-1660. doi: 10.2174/0113862073290831240229060932. Comb Chem High Throughput Screen. 2024. PMID: 38454764
-
Mendelian randomization reveals immune cell composition as a key determinant of cervical cancer prognosis.Discov Oncol. 2025 Apr 29;16(1):635. doi: 10.1007/s12672-025-02455-w. Discov Oncol. 2025. PMID: 40299140 Free PMC article.
-
Maresin 1 and CHI3L1 Levels Exhibit Opposing Trends and Correlations with Renal Dysfunction in Diabetic Nephropathy.Medicina (Kaunas). 2025 Jul 10;61(7):1247. doi: 10.3390/medicina61071247. Medicina (Kaunas). 2025. PMID: 40731875 Free PMC article.
-
Identification of a ferroptosis- and oxidative stress-associated gene signature for prognostic stratification of ovarian cancer.Am J Transl Res. 2023 Apr 15;15(4):2645-2655. eCollection 2023. Am J Transl Res. 2023. PMID: 37193145 Free PMC article.
-
An effective disease diagnostic model related to pyroptosis in ischemic cardiomyopathy.J Cell Mol Med. 2023 Dec;27(23):3816-3826. doi: 10.1111/jcmm.17957. Epub 2023 Sep 19. J Cell Mol Med. 2023. PMID: 37724419 Free PMC article.
References
-
- Yoon KH, Lee JH, Kim JW, Cho JH, Choi YH, Ko SH, Zimmet P, Son HY. Epidemic obesity and type 2 diabetes in Asia. Lancet. 2006;368:1681–1688. - PubMed
-
- Shaw JE, Sicree RA, Zimmet PZ. Global estimates of the prevalence of diabetes for 2010 and 2030. Diabetes Res Clin Pract. 2010;87:4–14. - PubMed
-
- Lehmann R, Schleicher ED. Molecular mechanism of diabetic nephropathy. Clin Chim Acta. 2000;297:135–144. - PubMed
-
- Choudhury D, Tuncel M, Levi M. Diabetic nephropathy--a multifaceted target of new therapies. Discov Med. 2010;10:406–415. - PubMed
-
- Gibney ER, Nolan CM. Epigenetics and gene expression. Heredity (Edinb) 2010;105:4–13. - PubMed
LinkOut - more resources
Full Text Sources