. 2022 May 13;7(71):eabn1250.
doi: 10.1126/sciimmunol.abn1250. Epub 2022 May 13.

Atypical B cells up-regulate costimulatory molecules during malaria and secrete antibodies with T follicular helper cell support

Affiliations

Atypical B cells up-regulate costimulatory molecules during malaria and secrete antibodies with T follicular helper cell support

Christine S Hopp et al. Sci Immunol. .

Abstract

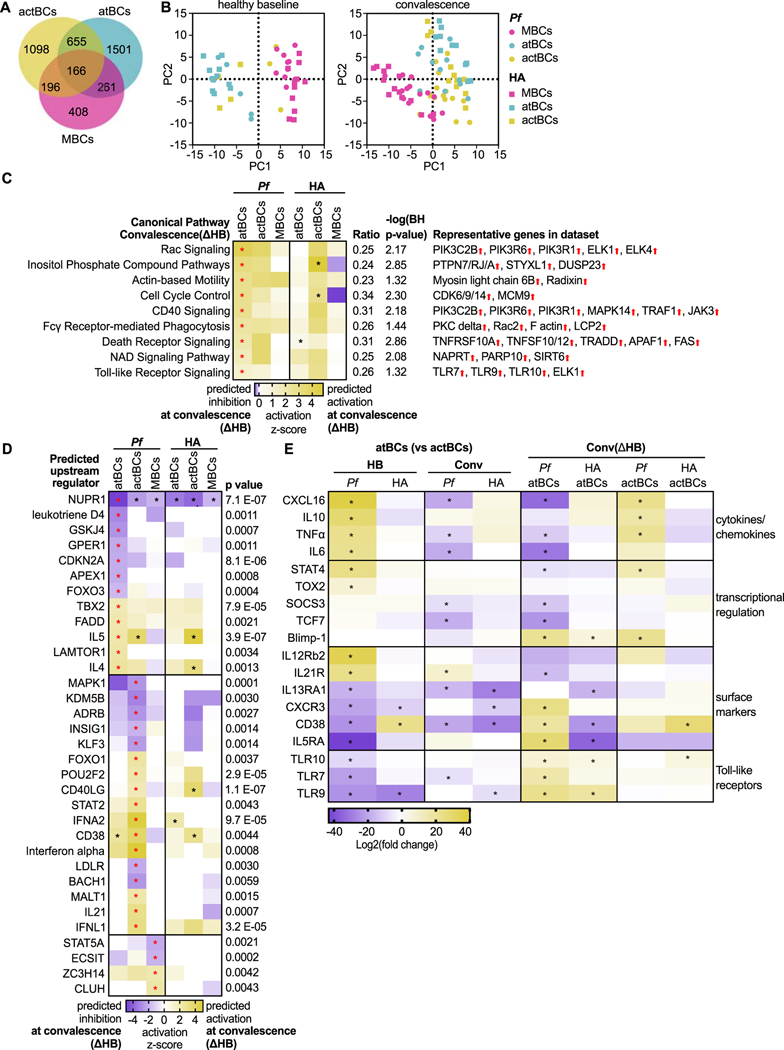
Several infectious and autoimmune diseases are associated with an expansion of CD21-CD27- atypical B cells (atBCs) that up-regulate inhibitory receptors and exhibit altered B cell receptor (BCR) signaling. The function of atBCs remains unclear, and few studies have investigated the biology of pathogen-specific atBCs during acute infection. Here, we performed longitudinal flow cytometry analyses and RNA sequencing of Plasmodium falciparum (Pf)-specific B cells isolated from study participants before and shortly after febrile malaria, with simultaneous analysis of influenza hemagglutinin (HA)-specific B cells as a comparator. At the healthy baseline before the malaria season, individuals had similar frequencies of Pf- and HA-specific atBCs that did not differ proportionally from atBCs within the total B cell population. BCR sequencing identified clonal relationships between Pf-specific atBCs, activated B cells (actBCs), and classical memory B cells (MBCs) and revealed comparable degrees of somatic hypermutation. At the healthy baseline, Pf-specific atBCs were transcriptionally distinct from Pf-specific actBCs and classical MBCs. In response to acute febrile malaria, Pf-specific atBCs and actBCs up-regulated similar intracellular signaling cascades. Pf-specific atBCs showed activation of pathways involved in differentiation into antibody-secreting cells and up-regulation of molecules that mediate B-T cell interactions, suggesting that atBCs respond to T follicular helper (TFH) cells. In the presence of TFH cells and staphylococcal enterotoxin B, atBCs of malaria-exposed individuals differentiated into CD38+ antibody-secreting cells in vitro, suggesting that atBCs may actively contribute to humoral immunity to infectious pathogens.


Conflict of interest statement

Competing interests:

Authors declare that they have no competing interests.

Figures

Figure 1.
Figure 1.. Pf- and HA-specific B cells are not disproportionately enriched for atBCs, and Pf-specific B cell subsets share clonality.
(A) Representative flow cytometry plots of antigen-specific B cell subsets. Gating strategy excluded non-B cells (CD3+/CD4+/CD8+/CD14+/CD16+/CD56+) and IgD+ CD10+ immature B cells (upper panels). Subsequent gating on PfAMA1 or PfMSP1 (Pf+) and influenza (HA+) probe-binding cells (middle panels). CD21/CD27 staining (bottom panels) within total (left) and Pf+ (right) CD10 IgD B cells, with gating to identify actBCs, MBCs and atBCs. (B) Percentages of atBCs, MBCs and actBCs within the total, Pf+ and HA+ IgD CD10 B cell populations in children (5–17 years; n=34; see supplementary data file 1 for additional information) at baseline (filled circles) and 7 days after febrile malaria (empty squares), Malian adults (n=20) and malaria-naïve U.S. adults (n=15) at their baseline. Each dot indicates an individual, connected lines show paired samples, bars show means. Data were acquired from at least five independent experiments. **** (p<0.0001), *** (p<0.0002), * (p<0.0332). (C) Circos plot showing stacked, size-ranked clonal BCR lineages with the largest clones in the clockwise-most position of each population. Connecting lines show matching clones between individual Pf+ CD10 atBCs (n=143), MBCs (n=371) and actBCs (n=88). (D) Number of mutations in the variable region of the heavy chain of single Pf+ CD10 atBCs, MBCs and actBCs. Data combined from 12 adult Malian donors from at least five independent experiments. Each dot indicates a single cell; lines and whiskers represent means and SDs, respectively. (E) Heat map of data displayed in (C), showing usage of Ig heavy chain joining (IGHJ) and variable (IGHV) genes, displayed as a percentage of total sequences obtained from Pf+ atBCs, MBCs and actBCs. Statistical analysis: (B) Comparisons of paired data at baseline vs convalescence in Malian children: Two-way ANOVA with Bonferroni’s multiple comparisons test. All other comparisons: one-way ANOVA with Tukey’s multiple comparisons test. (D) One-way ANOVA with Tukey’s multiple comparisons test.
Figure 2.
Figure 2.. Transcriptomic analysis of Pf- and HA-specific B cell subsets at the healthy baseline reveals distinguishing features of Pf-specific atBCs.
(A) Representative flow cytometry plots showing the gating strategy to sort CD10 IgD Pf- and HA-specific atBCs, MBCs and actBCs. (B) Heatmap showing selected DEGs for the three comparisons (atBCs vs actBCs; atBCs vs MBCs; actBCs vs MBCs) of Pf- and HA-specific B cells. Numbers of donors: Pf-specific subsets: atBCs (n=9), actBCs (n=9), MBCs (n=11); HA-specific subsets: atBCs (n=12), actBCs (n=11), MBCs (n=13). Significant DEGs (false discovery rate (FDR)<0.05, no FC cutoff) are indicated with an asterisk. (C) Ingenuity upstream regulator analysis using DEGs with FDR<0.2 and no FC cutoff. Heatmap shows predicted regulators with a |z score|>2 and p<0.005 for the respective subset comparison with positive z-score indicating activation of the regulator. Arrow up/down indicates gene expression in the data set. P values <0.005 are indicated with an asterisk; p values and representative target genes pertain to comparisons indicated by red asterisks. (D) Canonical pathways that are significantly overlapping with DEGs of the respective subset comparison (FDR<0.2, no FC cut-off) are indicated with asterisks. Ratio indicating the proportion of genes in the canonical pathway that are differentially expressed, the BH-adjusted p value, along with representative genes in the pathway (arrow up/down indicating gene expression) pertain to the comparison indicated with red asterisks. Antigen Presentation pathway, IL-4 signaling, Ephrin A Signaling: no z score can be calculated for these Ingenuity canonical pathways.
Figure 3.
Figure 3.. Pathways and upstream regulators defining the response of Pf-specific atBCs to malaria are frequently shared by Pf-specific actBCs.
(A) Venn diagram showing the number of DEGs uniquely regulated in response to malaria (Δ healthy baseline, HB) in Pf-specific subsets (cut-off FDR<0.05; |FC|>2). (B) Principal component analysis using the top 250 most variably expressed genes among Pf-specific B cell subsets at baseline and one week after malaria treatment. Each dot represents one antigen-specific B cell subset per donor. Numbers of donors at baseline: Pf-specific subsets: atBCs (n=9), actBCs (n=9), MBCs (n=11); HA-specific subsets: atBCs (n=12), actBCs (n=11), MBCs (n=13). Numbers of donors one week after malaria: Pf-specific subsets: atBCs (n=15), actBCs (n=14), MBCs (n=16); HA-specific subsets: atBCs (n=14), actBCs (n=16), MBCs (n=16). Pf- and HA-specific samples were pooled to increase the number of data points per plot. (C) Canonical pathways that are significantly overlapping with DEGs of Pf-specific atBCs at convalescence (Δ HB; FDR<0.2, no FC cut-off). Ratio of overlap, BH-adjusted p value, as well as representative genes in the data set (arrow up/down indicating gene expression) pertain to the comparison indicated with red asterisks. No significant canonical pathway enrichment was found for Pf-specific actBCs and MBCs at convalescence (Δ baseline). (D) Top upstream regulators identified by Ingenuity analysis using the DEGs of B cell subsets at convalescence (Δ HB; FDR<0.2, no FC cut-off). Heatmap shows predicted regulators with a |z score|>2 and p<0.005 for the respective subset comparison with positive z-score indicating activation of the regulator. Listed p values pertain to comparison indicated by red asterisks. Arrow up/down indicates gene expression in the data set. (E) Heatmap showing selected DEGs for the atBCs vs actBCs comparison at HB and convalescence (Conv) on the left and differential expression of these genes in atBCs and actBCs at convalescence (ΔHB) on the right. Significant DEGs (FDR<0.05, no FC cutoff) are indicated with an asterisk.
Figure 4:
Figure 4:. Pf-specific atBCs and actBCs express markers indicative of proliferation and T cell interaction.
(A-E) Histograms (top panels) showing representative mean fluorescence intensity (MFI) values of ICOSL, CD86, HLA-DR, Ki67 and T-bet for Pf-specific CD10 IgD B cell subsets at baseline and one week after treatment of febrile malaria (convalescence). Graphs (bottom panels) show either percentages of cells expressing ICOSL (A), CD86 (B), Ki67 (D) and T-bet (E), or MFIs of HLA-DR (C) for total, Pf- and HA-specific CD10 IgD MBCs (pink), actBCs (yellow) and atBCs (teal) at baseline (filled circles) and convalescence (empty squares). Ki67, ICOSL and HLA-DR data: donors 11–12 years (n=12); CD86 data: donors 2–17 years (n=33). T-bet data: donors 5–17 years (n=33). See supplementary data table 1 for additional information. (F) Histograms (top panels) showing representative MFI values of FcRL5 for Pf-specific CD10 IgD B cell subsets at the end of the 6-month malaria season (December) and at baseline (May). Graphs (bottom panels) show percentages of cells expressing FcRL5 for total, Pf- and HA-specific CD10 IgD MBCs (pink), actBCs (yellow) and atBCs (teal) in May (filled circles). Donors 13–15 years (n=39). (G) Frequency of total atBCs or actBCs expressing FcRL5 in December (triangles) and after five months of dry season in May (filled circles). Each dot indicates an individual, lines represent means; data not paired. Donors 13–15 years (December n=23; May n=39). (H) Heatmap showing RNA expression of selected genes. Differential expression analysis and statistical analysis of comparisons were performed using DESeq2. Significant DEGs (FDR<0.05, no FC cutoff) are indicated with an asterisk. Statistical analysis: (A-E) Two-way ANOVA with Tukey’s multiple comparisons test. (F-G) One-way ANOVA with Holm-Sidak’s multiple comparisons test. **** (p<0.0001), *** (p<0.0002), ** (p<0.0021), * (p<0.0332).
Figure 5:
Figure 5:. atBCs upregulate CD38 and secrete Ig when co-cultured with PD-1+CXCR5+ CD45RO+ CD4+ cTfh cells.
Representative flow cytometry plots showing the gating strategy used to FACS-sort (A) CD10 B cell subsets as well as (B) CD4+ CD3+ CD45RO+ CXCR5+ PD-1+ cTfh cells. B cell subsets were cultured with or without autologous cTfh cells in the presence or absence of Staphylococcal enterotoxin B (SEB). After 7 days, surface expression of CD38 and secreted Ig levels were measured. (C) Representative plots of CD38 staining on B cell subsets after 7-days of co-culture with SEB +/− cTfh cells. (D) Percentage of B cell subsets that are CD38+ after 7-day co-culture with SEB, cTfh cells, or SEB plus cTfh cells. Symbols represent individual donors (ages 12–19 years; SEB plus cTfh cells n=17; SEB no cTfh n=13; no SEB plus cTfh cells n=9; see supplementary data table 1 for additional information), lines represent medians. (E-I) IgG1–4 and IgM concentration in supernatants after 7-day co-culture with SEB, cTfh cells, or SEB plus cTfh cells. Symbols represent individual donors (SEB plus cTfh cells n=17; SEB no cTfh n=13; no SEB plus cTfh cells n=9;), lines represent medians. Statistical analysis: (D-I) Kruskall-Wallis with Dunn’s multiple comparison test. Data are representative of four independent experiments. **** (p<0.0001), *** (p<0.0002), ** (p<0.0021), * (p<0.0332).

References

    1. Braddom AE, Batugedara G, Bol S, Bunnik EM, Potential functions of atypical memory B cells in Plasmodium-exposed individuals, Int. J. Parasitol 50, 1033–1042 (2020). - PMC - PubMed
    1. Karnell JL, Kumar V, Wang J, Wang S, Voynova E, Ettinger R, Role of CD11c+ T-bet+ B cells in human health and disease, Cell. Immunol 321, 40–45 (2017). - PubMed
    1. Wildner NH, Ahmadi P, Schulte S, Brauneck F, Kohsar M, Lütgehetmann M, Beisel C, Addo MM, Haag F, Schulze Zur Wiesch J, B cell analysis in SARS-CoV-2 versus malaria: Increased frequencies of plasmablasts and atypical memory B cells in COVID-19, J. Leukoc. Biol 109, 77–90 (2021). - PMC - PubMed
    1. Joosten SA, van Meijgaarden KE, Del Nonno F, Baiocchini A, Petrone L, Vanini V, Smits HH, Palmieri F, Goletti D, Ottenhoff THM, Lewinsohn DM, Ed. Patients with Tuberculosis Have a Dysfunctional Circulating B-Cell Compartment, Which Normalizes following Successful Treatment, PLoS Pathog. 12, e1005687 (2016). - PMC - PubMed
    1. Moir S, Ho J, Malaspina A, Wang W, DiPoto AC, O’Shea MA, Roby G, Kottilil S, Arthos J, Proschan MA, Chun T-W, Fauci AS, Evidence for HIV-associated B cell exhaustion in a dysfunctional memory B cell compartment in HIV-infected viremic individuals, J. Exp. Med 205, 1797–1805 (2008). - PMC - PubMed

Publication types

Substances

Supplementary concepts