

Prenatal Oxygen and Glucose Therapy Normalizes Insulin Secretion and Action in Growth-Restricted Fetal Sheep
- PMID: 35560217
- PMCID: PMC9113332
- DOI: 10.1210/endocr/bqac053
Prenatal Oxygen and Glucose Therapy Normalizes Insulin Secretion and Action in Growth-Restricted Fetal Sheep
Abstract
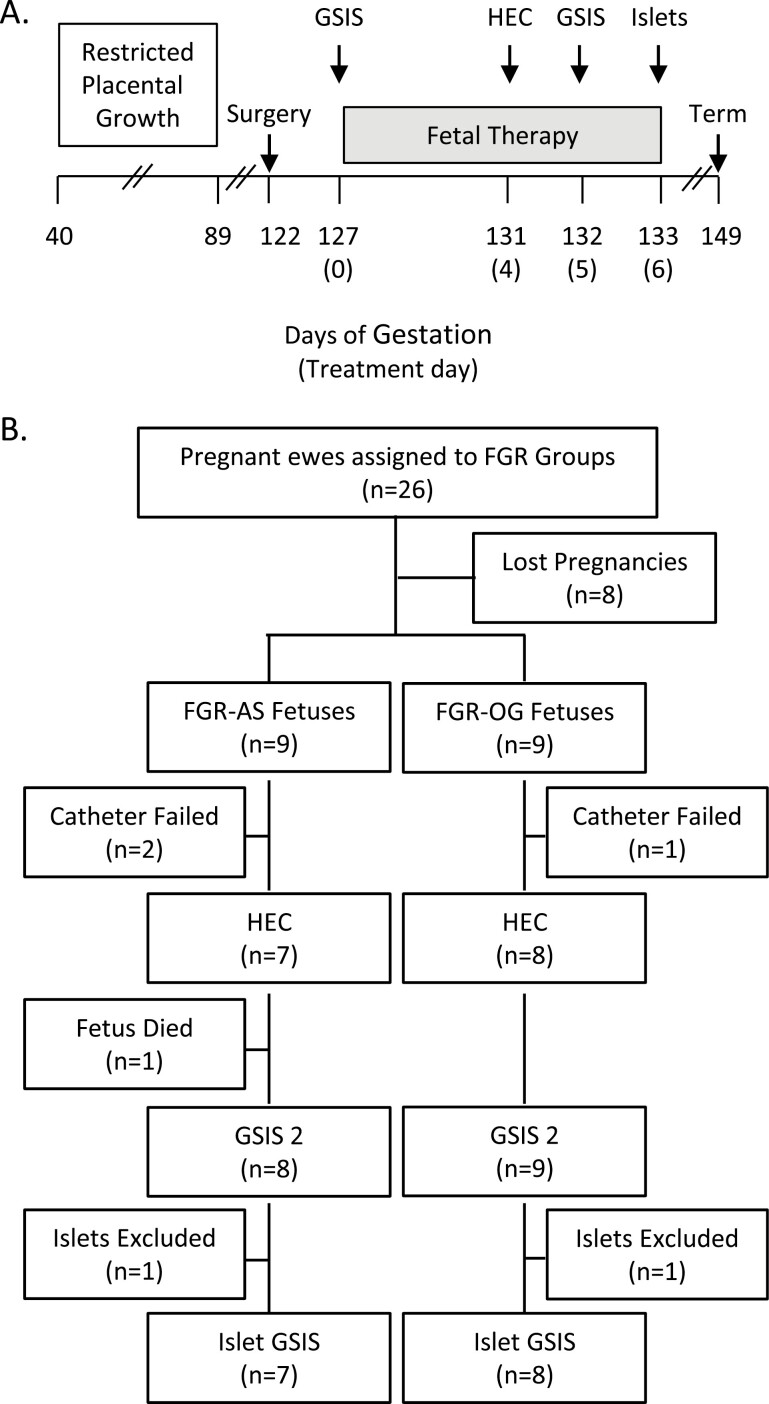
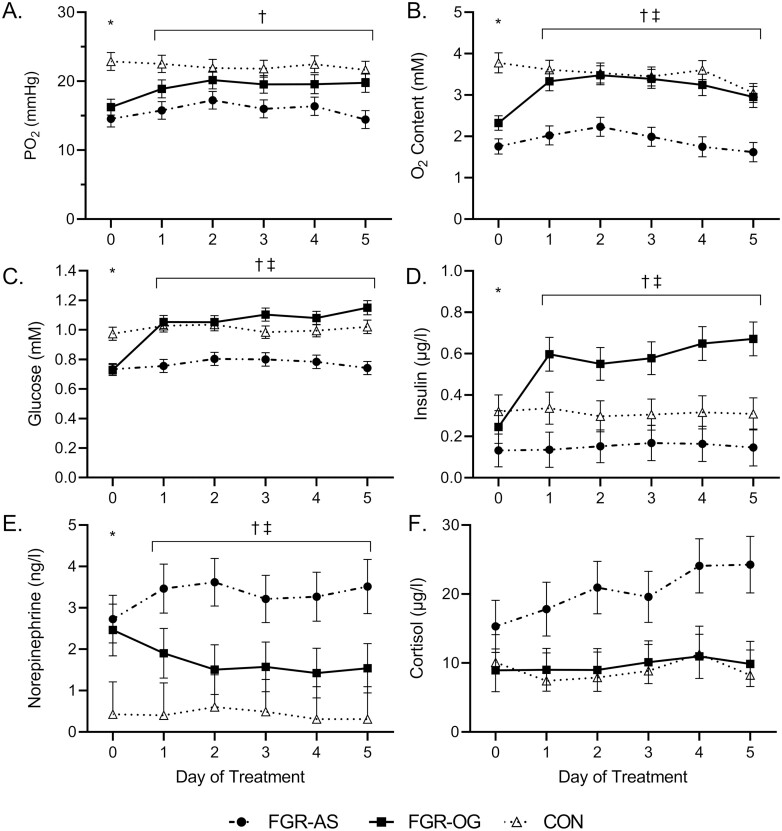
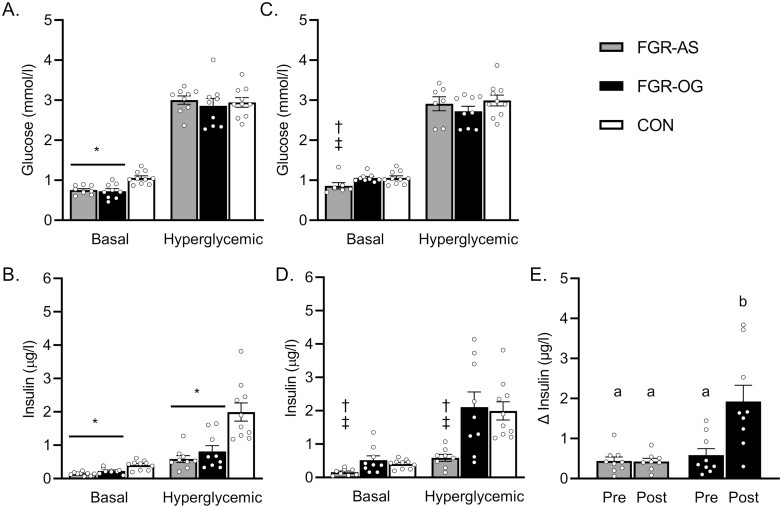
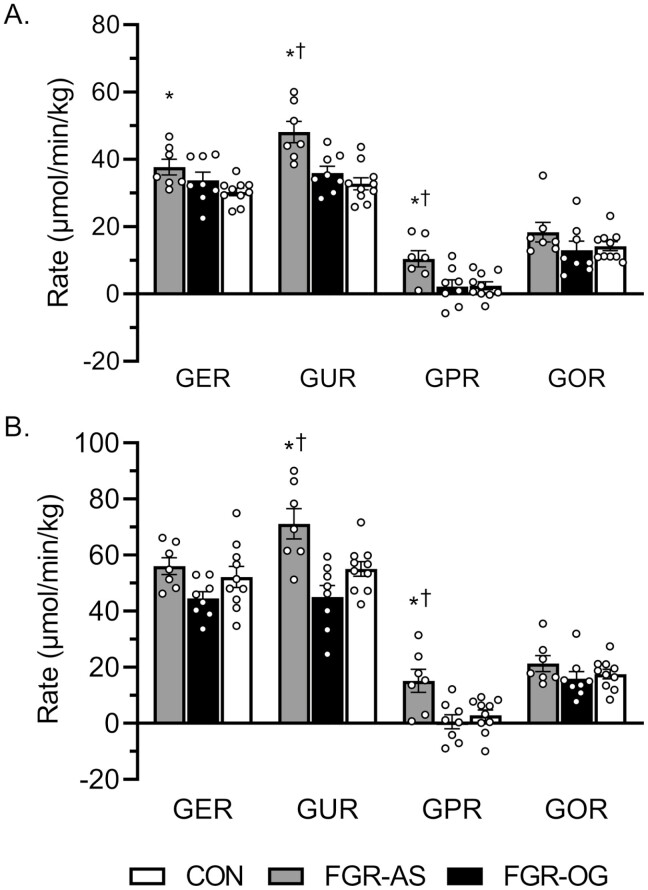
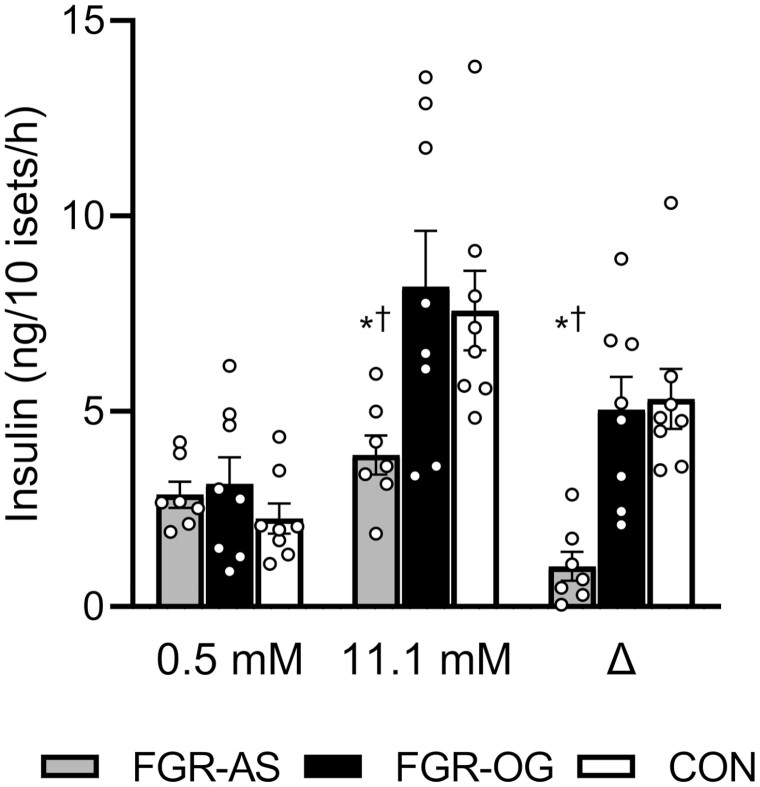
Placental insufficiency (PI) lowers fetal oxygen and glucose concentrations, which disrupts glucose-insulin homeostasis and promotes fetal growth restriction (FGR). To date, prenatal treatments for FGR have not attempted to correct the oxygen and glucose supply simultaneously. Therefore, we investigated whether a 5-day correction of oxygen and glucose concentrations in PI-FGR fetuses would normalize insulin secretion and glucose metabolism. Experiments were performed in near-term FGR fetal sheep with maternal hyperthermia-induced PI. Fetal arterial oxygen tension was increased to normal levels by increasing the maternal inspired oxygen fraction and glucose was infused into FGR fetuses (FGR-OG). FGR-OG fetuses were compared with maternal air insufflated, saline-infused fetuses (FGR-AS) and control fetuses. Prior to treatment, FGR fetuses were hypoxemic and hypoglycemic and had reduced glucose-stimulated insulin secretion (GSIS). During treatment, oxygen, glucose, and insulin concentrations increased, and norepinephrine concentrations decreased in FGR-OG fetuses, whereas FGR-AS fetuses were unaffected. On treatment day 4, glucose fluxes were measured with euglycemic and hyperinsulinemic-euglycemic clamps. During both clamps, rates of glucose utilization and production were greater in FGR-AS than FGR-OG fetuses, while glucose fluxes in FGR-OG fetuses were not different than control rates. After 5 days of treatment, GSIS increased in FGR-OG fetuses to control levels and their ex vivo islet GSIS was greater than FGR-AS islets. Despite normalization in fetal characteristics, GSIS, and glucose fluxes, FGR-OG and FGR-AS fetuses weighed less than controls. These findings show that sustained, simultaneous correction of oxygen and glucose normalized GSIS and whole-body glucose fluxes in PI-FGR fetuses after the onset of FGR.
Keywords: fetal therapy; glucose homeostasis; intrauterine intervention; islets of Langerhans; placental insufficiency.
© The Author(s) 2022. Published by Oxford University Press on behalf of the Endocrine Society. All rights reserved. For permissions, please e-mail: journals.permissions@oup.com.
Figures
Similar articles
-
IGF-1 LR3 does not promote growth in late-gestation growth-restricted fetal sheep.Am J Physiol Endocrinol Metab. 2025 Jan 1;328(1):E116-E125. doi: 10.1152/ajpendo.00259.2024. Epub 2024 Dec 16. Am J Physiol Endocrinol Metab. 2025. PMID: 39679943
-
Chronic exposure to elevated norepinephrine suppresses insulin secretion in fetal sheep with placental insufficiency and intrauterine growth restriction.Am J Physiol Endocrinol Metab. 2010 Apr;298(4):E770-8. doi: 10.1152/ajpendo.00494.2009. Epub 2010 Jan 19. Am J Physiol Endocrinol Metab. 2010. PMID: 20086198 Free PMC article.
-
Chronically elevated norepinephrine concentrations lower glucose uptake in fetal sheep.Am J Physiol Regul Integr Comp Physiol. 2020 Sep 1;319(3):R255-R263. doi: 10.1152/ajpregu.00365.2019. Epub 2020 Jul 15. Am J Physiol Regul Integr Comp Physiol. 2020. PMID: 32667834 Free PMC article.
-
Fetal adaptations in insulin secretion result from high catecholamines during placental insufficiency.J Physiol. 2017 Aug 1;595(15):5103-5113. doi: 10.1113/JP273324. Epub 2017 May 26. J Physiol. 2017. PMID: 28194805 Free PMC article. Review.
-
Placental-fetal glucose exchange and fetal glucose metabolism.Trans Am Clin Climatol Assoc. 2006;117:321-39; discussion 339-40. Trans Am Clin Climatol Assoc. 2006. PMID: 18528484 Free PMC article. Review.
Cited by
-
Dousing the flame: reviewing the mechanisms of inflammatory programming during stress-induced intrauterine growth restriction and the potential for ω-3 polyunsaturated fatty acid intervention.Front Physiol. 2023 Sep 1;14:1250134. doi: 10.3389/fphys.2023.1250134. eCollection 2023. Front Physiol. 2023. PMID: 37727657 Free PMC article. Review.
-
Reducing Systemic Inflammation in IUGR-Born Neonatal Lambs via Daily Oral ω-3 PUFA Supplement Improved Skeletal Muscle Glucose Metabolism, Glucose-Stimulated Insulin Secretion, and Blood Pressure.Metabolites. 2025 May 22;15(6):346. doi: 10.3390/metabo15060346. Metabolites. 2025. PMID: 40559370 Free PMC article.
-
IGF-1 LR3 does not promote growth in late-gestation growth-restricted fetal sheep.Am J Physiol Endocrinol Metab. 2025 Jan 1;328(1):E116-E125. doi: 10.1152/ajpendo.00259.2024. Epub 2024 Dec 16. Am J Physiol Endocrinol Metab. 2025. PMID: 39679943
-
Decreased Pyruvate but Not Fatty Acid Driven Mitochondrial Respiration in Skeletal Muscle of Growth Restricted Fetal Sheep.Int J Mol Sci. 2023 Oct 30;24(21):15760. doi: 10.3390/ijms242115760. Int J Mol Sci. 2023. PMID: 37958743 Free PMC article.
-
Timing of maternal nutrient restriction during mid- to late-gestation influences net umbilical uptake of glucose and amino acids in adolescent sheep.J Anim Sci. 2023 Jan 3;101:skad383. doi: 10.1093/jas/skad383. J Anim Sci. 2023. PMID: 37982730 Free PMC article.
References
Publication types
MeSH terms
Substances
Grants and funding
LinkOut - more resources
Full Text Sources
Research Materials
Miscellaneous
