

Elevation of fatty acid desaturase 2 in esophageal adenocarcinoma increases polyunsaturated lipids and may exacerbate bile acid-induced DNA damage
- PMID: 35560527
- PMCID: PMC9099135
- DOI: 10.1002/ctm2.810
Elevation of fatty acid desaturase 2 in esophageal adenocarcinoma increases polyunsaturated lipids and may exacerbate bile acid-induced DNA damage
Abstract
Background: The risk of esophageal adenocarcinoma (EAC) is associated with gastro-esophageal reflux disease (GERD) and obesity. Lipid metabolism-targeted therapies decrease the risk of progressing from Barrett's esophagus (BE) to EAC, but the precise lipid metabolic changes and their roles in genotoxicity during EAC development are yet to be established.
Methods: Esophageal biopsies from the normal epithelium (NE), BE, and EAC, were analyzed using concurrent lipidomics and proteomics (n = 30) followed by orthogonal validation on independent samples using RNAseq transcriptomics (n = 22) and immunohistochemistry (IHC, n = 80). The EAC cell line FLO-1 was treated with FADS2 selective inhibitor SC26196, and/or bile acid cocktail, followed by immunofluorescence staining for γH2AX.
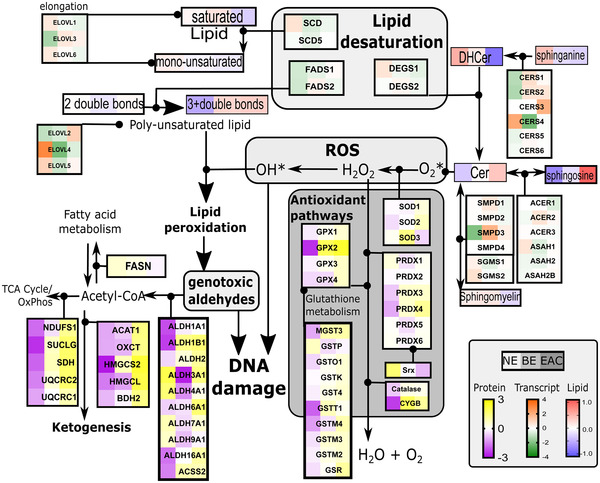
Results: Metabolism-focused Reactome analysis of the proteomics data revealed enrichment of fatty acid metabolism, ketone body metabolism, and biosynthesis of specialized pro-resolving mediators in EAC pathogenesis. Lipidomics revealed progressive alterations (NE-BE-EAC) in glycerophospholipid synthesis with decreasing triglycerides and increasing phosphatidylcholine and phosphatidylethanolamine, and sphingolipid synthesis with decreasing dihydroceramide and increasing ceramides. Furthermore, a progressive increase in lipids with C20 fatty acids and polyunsaturated lipids with ≥4 double bonds were also observed. Integration with transcriptome data identified candidate enzymes for IHC validation: Δ4-Desaturase, Sphingolipid 1 (DEGS1) which desaturates dihydroceramide to ceramide, and Δ5 and Δ6-Desaturases (fatty acid desaturases, FADS1 and FADS2), responsible for polyunsaturation. All three enzymes showed significant increases from BE through dysplasia to EAC, but transcript levels of DEGS1 were decreased suggesting post-translational regulation. Finally, the FADS2 selective inhibitor SC26196 significantly reduced polyunsaturated lipids with three and four double bonds and reduced bile acid-induced DNA double-strand breaks in FLO-1 cells in vitro.
Conclusions: Integrated multiomics revealed sphingolipid and phospholipid metabolism rewiring during EAC development. FADS2 inhibition and reduction of the high polyunsaturated lipids effectively protected EAC cells from bile acid-induced DNA damage in vitro, potentially through reduced lipid peroxidation.
Keywords: Barrett's esophagus; FADS2; esophageal adenocarcinoma; lipid desaturation; lipid metabolism.
© 2022 The Authors. Clinical and Translational Medicine published by John Wiley & Sons Australia, Ltd on behalf of Shanghai Institute of Clinical Bioinformatics.
Conflict of interest statement
The authors declare no conflict of interest.
Figures


Similar articles
-
APE1-mediated DNA damage repair provides survival advantage for esophageal adenocarcinoma cells in response to acidic bile salts.Oncotarget. 2016 Mar 29;7(13):16688-702. doi: 10.18632/oncotarget.7696. Oncotarget. 2016. PMID: 26934647 Free PMC article.
-
Activation of EGFR-DNA-PKcs pathway by IGFBP2 protects esophageal adenocarcinoma cells from acidic bile salts-induced DNA damage.J Exp Clin Cancer Res. 2019 Jan 9;38(1):13. doi: 10.1186/s13046-018-1021-y. J Exp Clin Cancer Res. 2019. PMID: 30626422 Free PMC article.
-
Expression of bile acid transporting proteins in Barrett's esophagus and esophageal adenocarcinoma.Am J Gastroenterol. 2009 Feb;104(2):302-9. doi: 10.1038/ajg.2008.85. Epub 2009 Jan 27. Am J Gastroenterol. 2009. PMID: 19174784 Free PMC article.
-
From genetics to signaling pathways: molecular pathogenesis of esophageal adenocarcinoma.Biochim Biophys Acta Rev Cancer. 2019 Aug;1872(1):37-48. doi: 10.1016/j.bbcan.2019.05.003. Epub 2019 May 30. Biochim Biophys Acta Rev Cancer. 2019. PMID: 31152823 Free PMC article. Review.
-
Molecular Evolution of Metaplasia to Adenocarcinoma in the Esophagus.Dig Dis Sci. 2018 Aug;63(8):2059-2069. doi: 10.1007/s10620-018-5090-8. Dig Dis Sci. 2018. PMID: 29766388 Free PMC article. Review.
Cited by
-
Lipid metabolism analysis in esophageal cancer and associated drug discovery.J Pharm Anal. 2024 Jan;14(1):1-15. doi: 10.1016/j.jpha.2023.08.019. Epub 2023 Sep 1. J Pharm Anal. 2024. PMID: 38352954 Free PMC article. Review.
-
Assessment of Colorectal Cancer Risk Factors through the Application of Network-Based Approaches in a Racially Diverse Cohort of Colon Organoid Stem Cells.Cancers (Basel). 2023 Jul 9;15(14):3550. doi: 10.3390/cancers15143550. Cancers (Basel). 2023. PMID: 37509213 Free PMC article.
-
Identification of novel serum lipid metabolism potential markers and metabolic pathways for oral cancer: a population-based study.BMC Cancer. 2025 Jan 30;25(1):177. doi: 10.1186/s12885-025-13561-x. BMC Cancer. 2025. PMID: 39885458 Free PMC article.
-
Multivariate Data Analysis Methods and Their Application in Lipidomics: A Gentle Comment on Appropriateness and Reliability Criteria.J Pineal Res. 2025 Jul;77(4):e70068. doi: 10.1111/jpi.70068. J Pineal Res. 2025. PMID: 40692122 Free PMC article.
-
Lipidomics reveals effect of EHHADH in lung squamous cell.Cell Biol Toxicol. 2025 May 31;41(1):94. doi: 10.1007/s10565-025-10044-4. Cell Biol Toxicol. 2025. PMID: 40450155 Free PMC article.
References
-
- Schlottmann F, Dreifuss NH, Patti MG. Obesity and esophageal cancer: GERD, Barrett´s esophagus, and molecular carcinogenic pathways. Exp Rev Gastroenterol Hepatol. 2020;14(6):425‐433. - PubMed
-
- Hoy AJ, Nagarajan SR, Butler LM. Tumour fatty acid metabolism in the context of therapy resistance and obesity. Nat Rev Cancer. 2021;21(12):753‐766. - PubMed
Publication types
MeSH terms
Substances
Supplementary concepts
LinkOut - more resources
Full Text Sources