

Variation in cardiovascular disease risk factors among older adults in the Hunter Community Study cohort: A comparison of diet quality versus polygenic risk score
- PMID: 35560851
- PMCID: PMC9542949
- DOI: 10.1111/jhn.13031
Variation in cardiovascular disease risk factors among older adults in the Hunter Community Study cohort: A comparison of diet quality versus polygenic risk score
Abstract
Background: The interplay between cardiovascular disease (CVD) genetic risk indexed by a polygenic risk score (PRS) and diet quality still requires further investigation amongst older adults or those with established or treated CVD. The present study aimed to evaluate the relative contribution of diet quality, measured using the Australian Recommended Food Score (ARFS) and PRS, with respect to explaining variation in plasma lipids CVD outcomes in the Hunter Cohort.
Methods: The study comprised a secondary analysis of cross-sectional data from the Hunter Cohort study. Single-nucleotide polymorphisms from previously derived polygenic scores (PGSs) for three lipid classes were obtained: low-density lipoprotein, high-density lipoprotein and triglycerides, as well as PRS for coronary artery disease (CAD) from the PGS catalogue. Regression modelling and odds ratios were used to determine associations between PRS, ARFS and CVD risk.
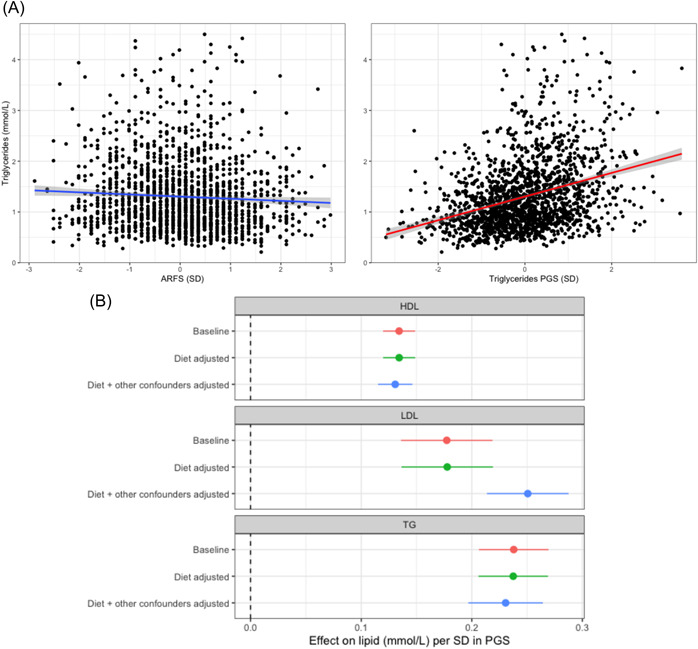
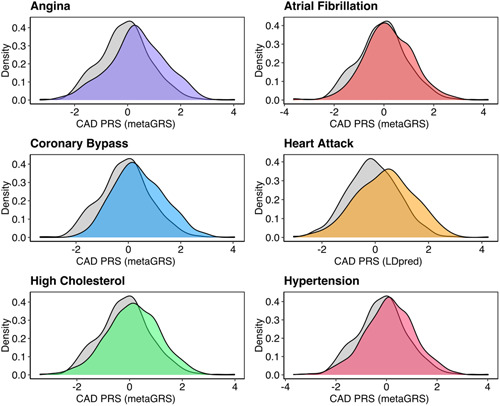
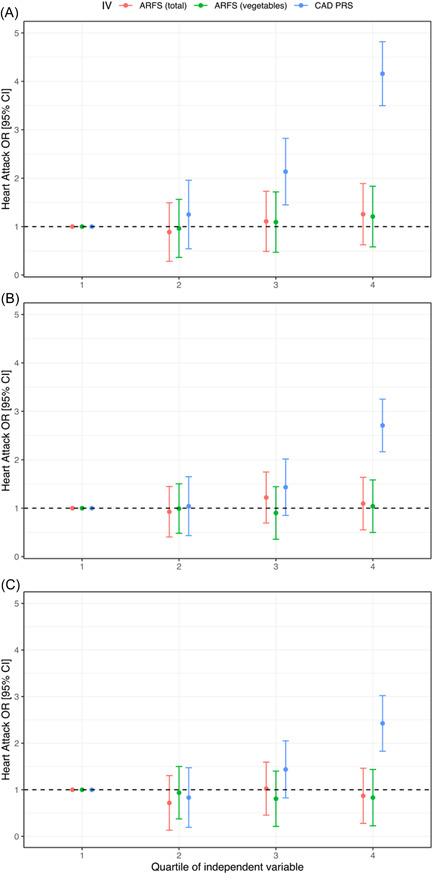
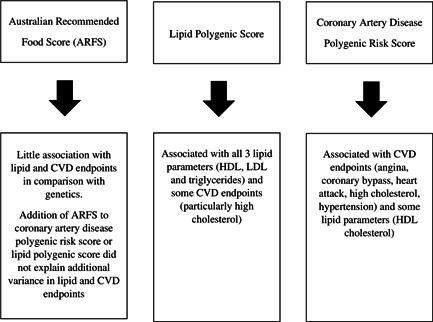
Results: In total, 1703 participants were included: mean ± SD age 66 ± 7.4 years, 51% female, mean ± SD total ARFS 28.1 ± 8 (out of 74). Total diet quality and vegetable subscale were not significantly associated with measured lipids. By contrast, PGS for each lipid demonstrated a markedly strong, statistically significant correlation with its respective measured lipid. There was a significant association between CAD PRS and 5/6 CVD phenotypes (all except atrial fibrillation), with the largest effect size shown with coronary bypass. Adding dietary intake as a covariate did not change this relationship.
Conclusions: Lipid PGS explained more variance in measured lipids than diet quality. However, the poor diet quality observed in the current cohort may have limited the ability to observe any beneficial effects. Future research should investigate whether the diet quality of older adults can be improved and also the effect of these improvements on changes in polygenic risk.
Keywords: Hunter Community Study; cardiovascular disease; cohort; diet quality; polygenic risk.
© 2022 The Authors. Journal of Human Nutrition and Dietetics published by John Wiley & Sons Ltd on behalf of British Dietetic Association.
Figures
Similar articles
-
Precision Medicine in Cardiovascular Disease Prevention: Clinical Validation of Multi-Ancestry Polygenic Risk Scores in a U.S. Cohort.Nutrients. 2025 Mar 6;17(5):926. doi: 10.3390/nu17050926. Nutrients. 2025. PMID: 40077796 Free PMC article.
-
Integration of a polygenic score into guideline-recommended prediction of cardiovascular disease.Eur Heart J. 2024 May 27;45(20):1843-1852. doi: 10.1093/eurheartj/ehae048. Eur Heart J. 2024. PMID: 38551411 Free PMC article.
-
Patients With High Genome-Wide Polygenic Risk Scores for Coronary Artery Disease May Receive Greater Clinical Benefit From Alirocumab Treatment in the ODYSSEY OUTCOMES Trial.Circulation. 2020 Feb 25;141(8):624-636. doi: 10.1161/CIRCULATIONAHA.119.044434. Epub 2019 Nov 11. Circulation. 2020. PMID: 31707832 Clinical Trial.
-
Polygenic Risk Scores to Identify CVD Risk and Tailor Therapy: Hope or Hype?Curr Atheroscler Rep. 2021 Jun 28;23(9):47. doi: 10.1007/s11883-021-00950-3. Curr Atheroscler Rep. 2021. PMID: 34181090 Review.
-
The clinical applicability of polygenic risk scores for LDL-cholesterol: considerations, current evidence and future perspectives.Curr Opin Lipidol. 2021 Apr 1;32(2):112-116. doi: 10.1097/MOL.0000000000000741. Curr Opin Lipidol. 2021. PMID: 33560669 Free PMC article. Review.
Cited by
-
Association of Metabolic Diseases and Moderate Fat Intake with Myocardial Infarction Risk.Nutrients. 2024 Dec 11;16(24):4273. doi: 10.3390/nu16244273. Nutrients. 2024. PMID: 39770895 Free PMC article.
-
Dietary metabolome profiles of a Healthy Australian Diet and a Typical Australian Diet: protocol for a randomised cross-over feeding study in Australian adults.BMJ Open. 2023 Jul 31;13(7):e073658. doi: 10.1136/bmjopen-2023-073658. BMJ Open. 2023. PMID: 37524561 Free PMC article.
-
Using Genetics to Inform Interventions Related to Sodium and Potassium in Hypertension.Circulation. 2024 Mar 26;149(13):1019-1032. doi: 10.1161/CIRCULATIONAHA.123.065394. Epub 2023 Dec 22. Circulation. 2024. PMID: 38131187 Free PMC article.
References
-
- Zhang YB, Pan XF, Chen J, Cao A, Xia L, Zhang Y, et al. Combined lifestyle factors, all‐cause mortality and cardiovascular disease: a systematic review and meta‐analysis of prospective cohort studies. J Epidemiol Community Health. 2021;75:92–9. - PubMed
-
- Schwingshackl L, Bogensberger B, Hoffmann G. Diet quality as assessed by the healthy eating index, alternate healthy eating index, dietary approaches to stop hypertension score, and health outcomes: an updated systematic review and meta‐analysis of cohort studies. J Acad Nutr Diet. 2018;118:74–100.e111. - PubMed
-
- Morze J, Danielewicz A, Hoffmann G, Schwingshackl L. Diet quality as assessed by the healthy eating index, alternate healthy eating index, dietary approaches to stop hypertension score, and health outcomes: a second update of a systematic review and meta‐analysis of cohort studies. J Acad Nutr Diet. 2020;120:1998–2031.e1915. - PubMed
Publication types
MeSH terms
Substances
LinkOut - more resources
Full Text Sources
Medical
Miscellaneous
