. 2022 Dec;76(6):1811-1824.
doi: 10.1002/hep.32568. Epub 2022 Jun 23.

Metabolic reprogramming of the intestinal microbiome with functional bile acid changes underlie the development of NAFLD

Affiliations

Metabolic reprogramming of the intestinal microbiome with functional bile acid changes underlie the development of NAFLD

Ekaterina Smirnova et al. Hepatology. 2022 Dec.

Abstract

Background and aims: Bile acids are hepatic metabolites and have many properties considered to be relevant to the pathophysiology of NAFLD. Circulating levels of the intestinal microbiome-modified bile acid deoxycholate are increased in cirrhosis.

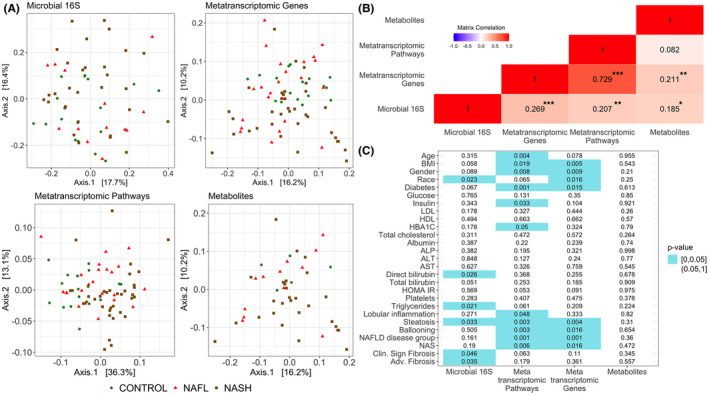
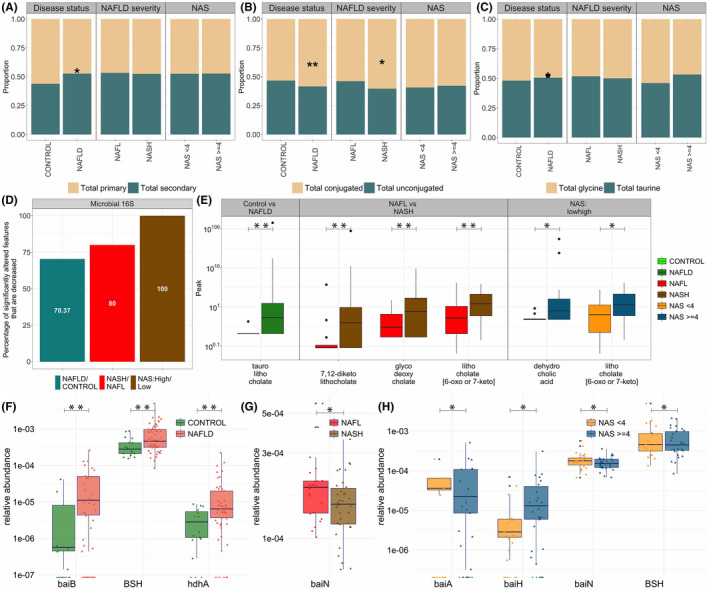
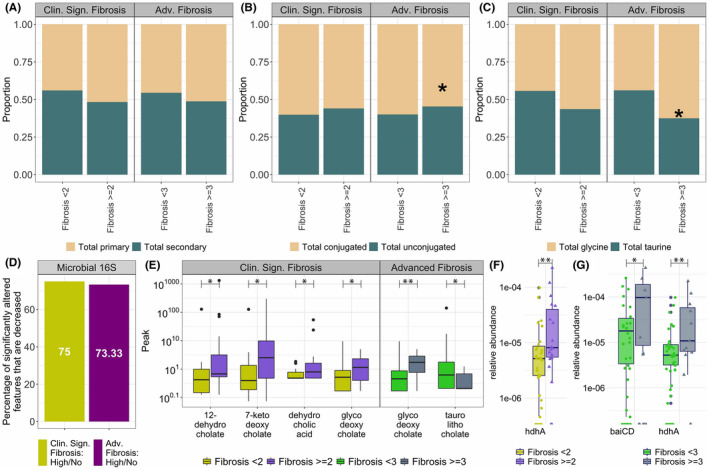
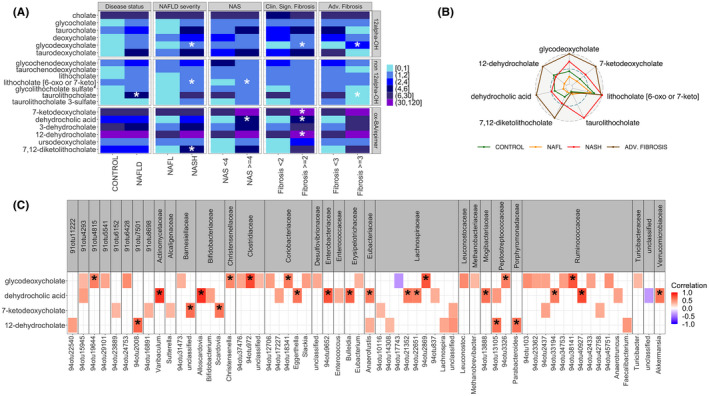
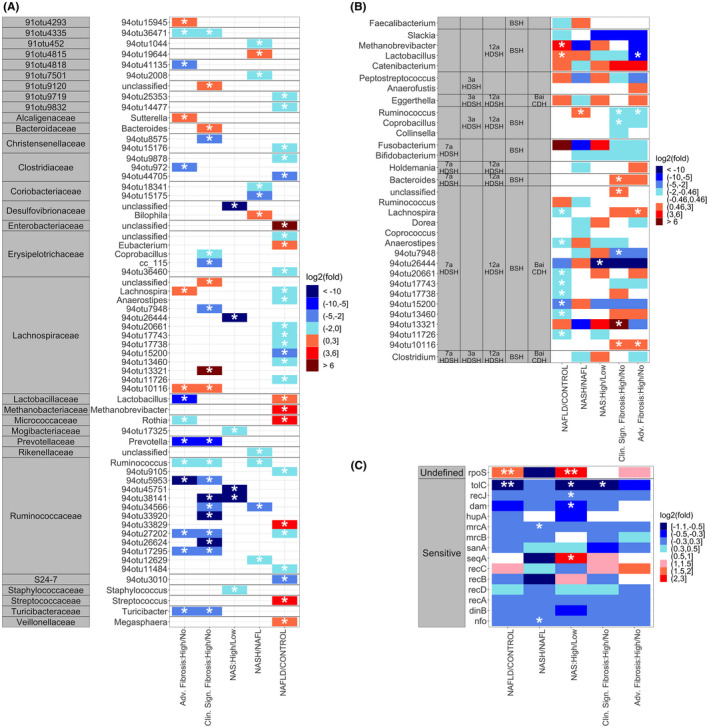
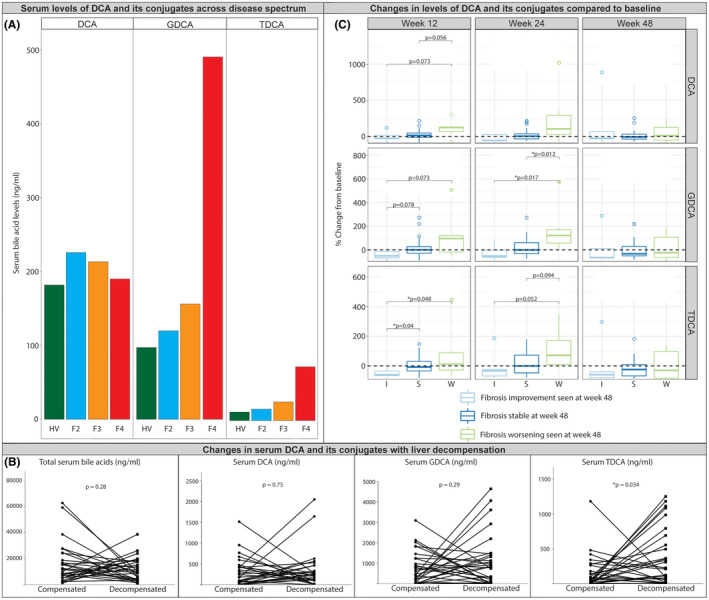
Approach and results: To further elucidate the role of bile acids and intestinal microbiota linked to bile acids in progressively severe NAFLD, a multiomic study of feces including 16S rRNA sequencing, microbial transcriptomics and metabolomics was performed in a cohort with varying phenotypes of NAFLD. Several bile acids of microbial origin derived from deoxycholic acid (DCA) (glycodeoxycholate, 7-ketodeoxycholic acid, dehydrocholic acid) increased with disease activity and fibrosis stage. These were linked to increased expression of microbial bile salt hydrolase, bile acid operon (BaiCD) and hydroxysteroid dehydrogenases (hdhA) required for DCA and downstream metabolite synthesis providing a mechanistic basis for altered bile acid profiles with disease progression. Bacteroidetes and several genera of Lachnospiraceae family containing DCA generating genes increased with increasing disease severity, whereas several potentially beneficial microbes sensitive to antibacterial effects of DCA e.g., Ruminococcaceae were decreased. The clinical relevance of these data was confirmed in an independent cohort enrolled in a clinical trial for NASH where at entry DCA and its conjugates were associated with advanced fibrosis. In patients treated with placebo, DCA declined in those with fibrosis regression and increased in those with fibrosis progression. DCA rose further in those with compensated cirrhosis when they experienced decompensation.

Conclusions: These findings demonstrate a role for bile acids and the bile acid dependent microbiome in the development and progression of NAFLD and set the stage to leverage these findings for NASH biomarker development and for therapeutics.


Conflict of interest statement

Andrew N. Billin owns stock in and is employed by Gilead Sciences. Jen‐Chieh Chuang owns stock in and is employed by Gilead Sciences and The Liver Company. Ryan S. Huss owns stock in and is employed by The Liver Company. He owns stock in Gilead Sciences. Robert P. Myers owns stock in and is employed by The Liver Company. He owns stock in Gilead Sciences. Nicole Narayan owns stock in and is employed by Second Genome. Arun J. Sanyal consults and received grants from Conatus, Gilead, Malinckrodt, Immuron, Boehringer Ingelhiem, Novartis, Bristol Myers Squibb, Merck, Lilly, Novo Nordisk, Fractyl, Siemens, Madrigal, Inventiva, and Covance. He owns stock in and consults for Genfit and Hemoshear. He consults for Intercept, Pfizer, Salix, Galectin, Sequana, Terns, Albireo, Sanofi, Jannsen, Takeda, Northsea, AMRA, Perspectum, Poxel, 89 Bio, AstraZeneca, NGM Bio, Amgen, Regeneron, Genetech, Roche, Albireo, Prosciento, Histoindex, Path AI, and Biocellvia. He received grants from Echosense‐Sandhill, OWL, and Second Genome. He received royalties from Elsevier and UptoDate. He owns stock in Sanyal Bio, Exhalenz, Durect, Indalo, Tiziana, and Rivus.

Figures

FIGURE 1
FIGURE 1
Multiomics of the NAFLD progression study. (A) Principal coordinates analyses (PCoA) Bray‐Curtis distance plots depicting the relationship between individual ‐omics type and NAFLD study groups. (B) Pairwise correlation between each ‐omics Bray‐Curtis distance matrices colored by correlation strength; for each correlation value stars represent significance strength accessed using mantel tests. Significance codes: *0.05 < p ≤ 0.1; **0.001 < p ≤ 0.05; ***p ≤ 0.001. (C) Significance values heatmap for univariate PERMANOVA tests of association between individual ‐omics data type (x axis) Bray‐Curtis distances and clinical covariates.
FIGURE 2
FIGURE 2
Comparison of NAFLD to control and disease activity groups: (i) NAFLD to CONTROL, (ii) NAFL to NASH, and (iii) NAS low to NAS high. (A) Proportion of total primary and total secondary bile acids. (B) Proportion of total conjugated and total unconjugated bile acids. (C) Proportion of total glycine conjugated and total taurine conjugated bile acids. (D) Proportion of features that are significantly decreased among the total number of significantly different 16S features in individual comparisons of NAFLD to control and disease activity groups. For each comparison group, proportions were calculated by dividing the number of taxa that were significantly decreased in that comparison (e.g., NAFLD vs. CONTROL) by a total number of taxa that were significantly different in that comparison group. (E) Boxplots of bile acid metabolites that are significantly different in NAFLD to control and disease activity group comparisons. (F‐H) comparison of expression of microbial genes involved in gut biotransformation of bile acids across NAFLD disease states; bai, bile acid inducible operon; BSH, bile acid hydrolase; HDH, hydroxysteroid dehydrogenase. Significantly expressed differences (p value ≤ 0.05) are identified by a * symbol; bile acid and genes in panels E–H controlled under the 11% the false discovery rate (FDR) are identified by a ** symbol.
FIGURE 3
FIGURE 3
Comparison of fibrosis stage groups: (i) clinically significant fibrosis, and (ii) advanced fibrosis. (A) Proportion of total primary and total secondary bile acids. (B) Proportion of total conjugated and total unconjugated bile acids. (C) Proportion of total glycine conjugated and total taurine conjugated bile acids. (D) Proportion of features that are significantly decreased among the total number of significantly different features in individual comparisons in two fibrosis stages for the 16S data set. For each comparison group, proportions were calculated by dividing the number of taxa that were significantly decreased in that comparison (e.g., high advanced fibrosis vs. no advanced fibrosis) by a total number of taxa that were significantly different in that comparison group. (E) Boxplots of bile acid metabolites that are significantly different in comparison of fibrosis stage groups. (F‐G) comparison of expression of microbial genes involved in gut biotransformation of bile acids across NAFLD disease states; bai, bile acid inducible operon; BSH, bile acid hydrolase; HDH, hydroxysteroid dehydrogenase. Significantly expressed differences (p value ≤0.05) are identified by a * symbol; bile acid and genes in panels D–G controlled under the 11% the false discovery rate (FDR) are identified by a ** symbol.
FIGURE 4
FIGURE 4
Changes in bile acids with NAFLD progression to fibrosis. (A) Heat map of bile acids relative concentrations averaged across all patients within each comparison group; 12α‐OH: 12α hydroxylated bile acids; ox‐BA/epimer: Bile acids with oxidation or epimerization at 3, 7 or 12 position. Significantly expressed differences (p value ≤ 0.05) are identified by a * symbol. (B) Radar plot for differentially expressed bile acids in control, NAFL, NASH and advanced fibrosis. Each pathway expression is normalized to the maximum across control, NAFL, and NASH patient groups. Outer dashed circle corresponds to the maximum expression of each pathway, middle dashed circle to the 0.5*maximum expression, and inner circle to the minimum expression. (C) Correlation heatmap of significantly expressed taxa with bile acids increased in clinically significant and advanced fibrosis. Only correlations with |ρ| ≥ 0.3 are highlighted in color. Correlations with p value ≤ 0.1 adjusted for the multiple comparisons are denoted by a * sign.
FIGURE 5
FIGURE 5
Analysis of changes in microbial genes and taxa related to bile acids within each comparison group. (A) Heatmap of the average log2 fold change for significantly expressed taxa in LEfSe pairwise comparisons of NAFLD to control and disease activity; significantly expressed taxa are identified by a * symbol. (B) Heatmap of the average log2 fold change for taxa known to contain genes involved in gut biotransformation of bile acids; significantly expressed taxa are identified by a * symbol. (C) Heatmap of the average log2 fold change for genes known to induce sensitivity or undefined changes in taxa susceptibility toward bile acids; genes with p value ≤ 0.1 are identified by a * symbol, genes with p value adjusted for the multiple comparisons value ≤ 0.1 are identified by ** symbol.
FIGURE 6
FIGURE 6
External data validation using serum biosamples. (A) Serum DCA and its conjugates across disease spectrum, seen in healthy volunteers (HV) and NASH with fibrosis stages 2–4 (F2–F4) at baseline in an independent data set from Selonsertib and Simtuzumab phase 2b studies.[ 16 , 17 ] Significant increase in G‐DCA and T‐DCA in fibrosis stage 4 (F4). (B) Changes of serum DCA and conjugates during liver decompensation in ATLAS study.[ 18 ] (C) Changes in serum DCA levels and its conjugates 12, 24, and 48 weeks from baseline over time in patients from placebo arm with improvement, stability, and worsening of fibrosis at week 48 in the ATLAS study.[ 18 ]

References

    1. Albhaisi S, Sanyal AJ. Gene‐environmental interactions as metabolic drivers of nonalcoholic steatohepatitis. Front Endocrinol. 2021;12:665987. - PMC - PubMed
    1. Chalasani N, Younossi Z, Lavine JE, Charlton M, Cusi K, Rinella M, et al. The diagnosis and management of nonalcoholic fatty liver disease: practice guidance from the American Association for the Study of Liver Diseases. Hepatology. 2018;67(1):328–57. - PubMed
    1. Han MAT, Altayar O, Hamdeh S, Takyar V, Rotman Y, Etzion O, et al. Rates of and factors associated with placebo response in trials of pharmacotherapies for nonalcoholic steatohepatitis: systematic review and meta‐analysis. Clin Gastroenterol Hepatol. 2019;17(4):616–29.e26. - PubMed
    1. Noureddin M, Muthiah MD, Sanyal AJ. Drug discovery and treatment paradigms in nonalcoholic steatohepatitis. Endocrinol Diabetes Metab. 2020;3(4):e00105. - PMC - PubMed
    1. The Human Microbiome Project Consortium , Gevers D, Knight R, Abubucker S, Badger JH, Chinwalla AT, et al. Structure, function and diversity of the healthy human microbiome. Nature. 2012;486(7402):207–14. - PMC - PubMed

Publication types

MeSH terms