

Airpart: interpretable statistical models for analyzing allelic imbalance in single-cell datasets
- PMID: 35561168
- PMCID: PMC9113279
- DOI: 10.1093/bioinformatics/btac212
Airpart: interpretable statistical models for analyzing allelic imbalance in single-cell datasets
Abstract
Motivation: Allelic expression analysis aids in detection of cis-regulatory mechanisms of genetic variation, which produce allelic imbalance (AI) in heterozygotes. Measuring AI in bulk data lacking time or spatial resolution has the limitation that cell-type-specific (CTS), spatial- or time-dependent AI signals may be dampened or not detected.
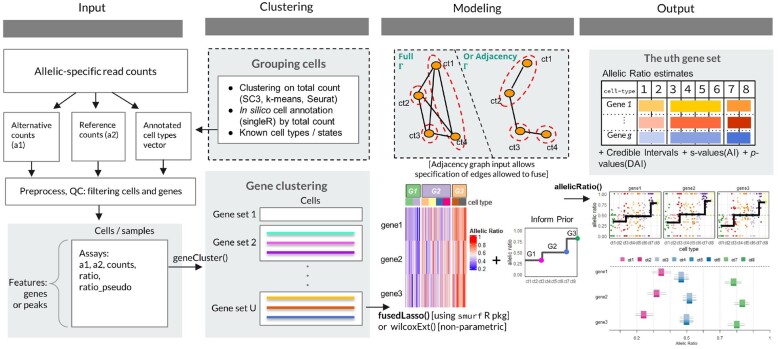
Results: We introduce a statistical method airpart for identifying differential CTS AI from single-cell RNA-sequencing data, or dynamics AI from other spatially or time-resolved datasets. airpart outputs discrete partitions of data, pointing to groups of genes and cells under common mechanisms of cis-genetic regulation. In order to account for low counts in single-cell data, our method uses a Generalized Fused Lasso with Binomial likelihood for partitioning groups of cells by AI signal, and a hierarchical Bayesian model for AI statistical inference. In simulation, airpart accurately detected partitions of cell types by their AI and had lower Root Mean Square Error (RMSE) of allelic ratio estimates than existing methods. In real data, airpart identified differential allelic imbalance patterns across cell states and could be used to define trends of AI signal over spatial or time axes.
Availability and implementation: The airpart package is available as an R/Bioconductor package at https://bioconductor.org/packages/airpart.
Supplementary information: Supplementary data are available at Bioinformatics online.
© The Author(s) 2022. Published by Oxford University Press.
Figures


Similar articles
-
Fast effect size shrinkage software for beta-binomial models of allelic imbalance.F1000Res. 2019 Nov 28;8:2024. doi: 10.12688/f1000research.20916.2. eCollection 2019. F1000Res. 2019. PMID: 33796271 Free PMC article.
-
ISoLDE: a data-driven statistical method for the inference of allelic imbalance in datasets with reciprocal crosses.Bioinformatics. 2020 Jan 15;36(2):504-513. doi: 10.1093/bioinformatics/btz564. Bioinformatics. 2020. PMID: 31350542 Free PMC article.
-
Power calculator for detecting allelic imbalance using hierarchical Bayesian model.BMC Res Notes. 2021 Nov 27;14(1):436. doi: 10.1186/s13104-021-05851-x. BMC Res Notes. 2021. PMID: 34838135 Free PMC article.
-
A flexible Bayesian method for detecting allelic imbalance in RNA-seq data.BMC Genomics. 2014 Oct 23;15(1):920. doi: 10.1186/1471-2164-15-920. BMC Genomics. 2014. PMID: 25339465 Free PMC article.
-
Testcrosses are an efficient strategy for identifying cis-regulatory variation: Bayesian analysis of allele-specific expression (BayesASE).G3 (Bethesda). 2021 May 7;11(5):jkab096. doi: 10.1093/g3journal/jkab096. G3 (Bethesda). 2021. PMID: 33772539 Free PMC article.
Cited by
-
Disentangling sex-dependent effects of APOE on diverse trajectories of cognitive decline in Alzheimer's disease.Neuroimage. 2024 Apr 15;292:120609. doi: 10.1016/j.neuroimage.2024.120609. Epub 2024 Apr 12. Neuroimage. 2024. PMID: 38614371 Free PMC article.
-
Modelling capture efficiency of single-cell RNA-sequencing data improves inference of transcriptome-wide burst kinetics.Bioinformatics. 2023 Jul 1;39(7):btad395. doi: 10.1093/bioinformatics/btad395. Bioinformatics. 2023. PMID: 37354494 Free PMC article.
-
Single-cell genomics and regulatory networks for 388 human brains.bioRxiv [Preprint]. 2024 Mar 30:2024.03.18.585576. doi: 10.1101/2024.03.18.585576. bioRxiv. 2024. Update in: Science. 2024 May 24;384(6698):eadi5199. doi: 10.1126/science.adi5199. PMID: 38562822 Free PMC article. Updated. Preprint.
-
Computational methods for allele-specific expression in single cells.Trends Genet. 2024 Nov;40(11):939-949. doi: 10.1016/j.tig.2024.07.003. Epub 2024 Aug 10. Trends Genet. 2024. PMID: 39127549 Review.
-
Single-cell genomics and regulatory networks for 388 human brains.Science. 2024 May 24;384(6698):eadi5199. doi: 10.1126/science.adi5199. Epub 2024 May 24. Science. 2024. PMID: 38781369 Free PMC article.
References
-
- Benjamini Y., Hochberg Y. (1995) Controlling the false discovery rate: a practical and powerful approach to multiple testing. J. R. Stat. Soc. Ser. B Methodol., 57, 289–300.
Publication types
MeSH terms
Grants and funding
LinkOut - more resources
Full Text Sources
Research Materials
