. 2022 May 17;119(20):e2123261119.
doi: 10.1073/pnas.2123261119. Epub 2022 May 13.

SNAT7 regulates mTORC1 via macropinocytosis

Affiliations

SNAT7 regulates mTORC1 via macropinocytosis

Delong Meng et al. Proc Natl Acad Sci U S A. .

Abstract

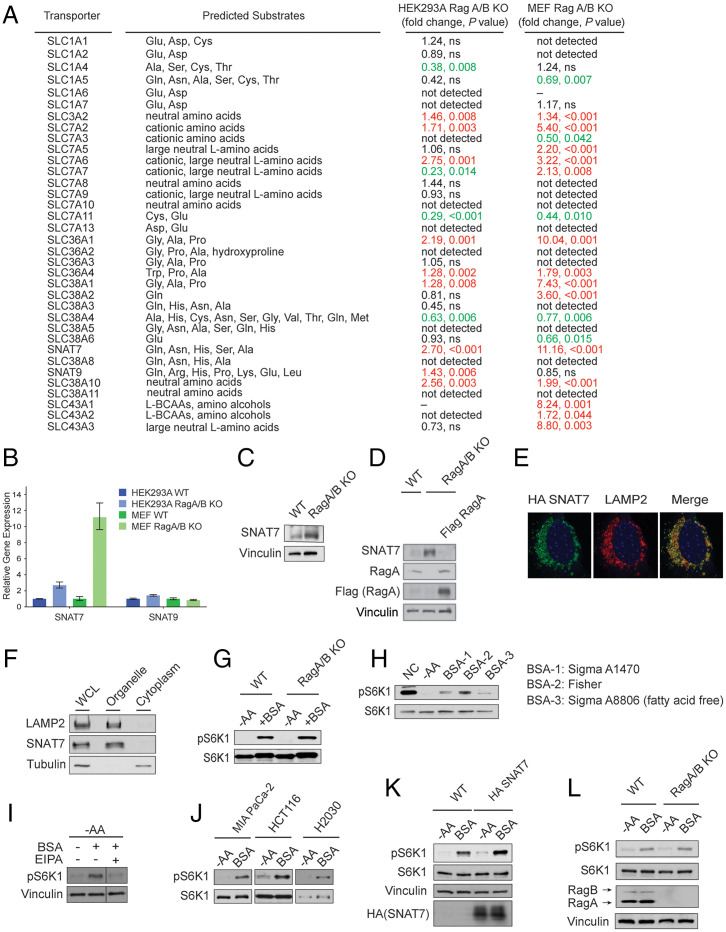
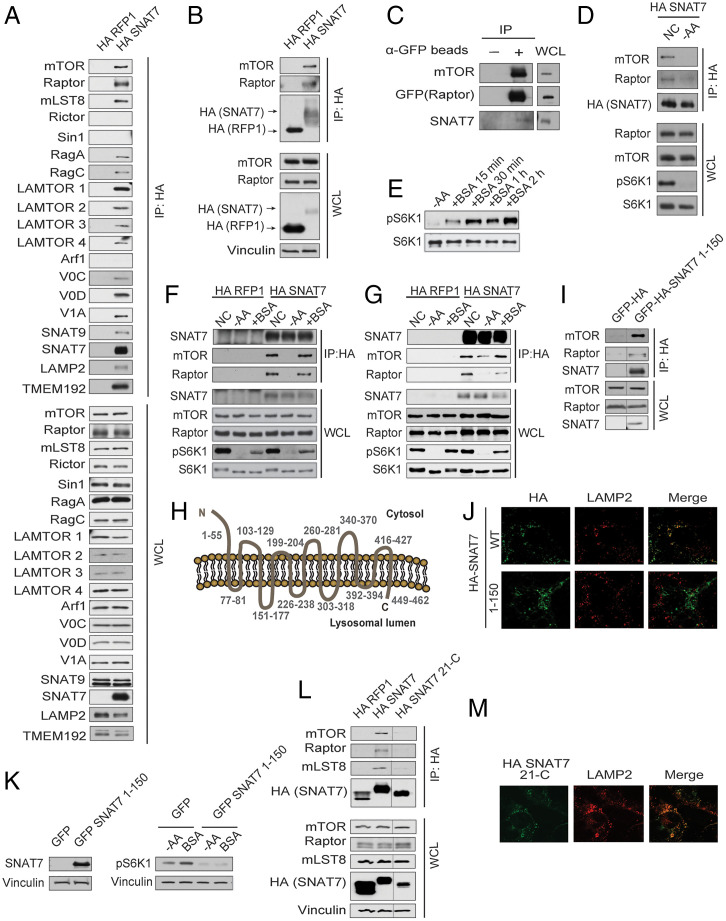
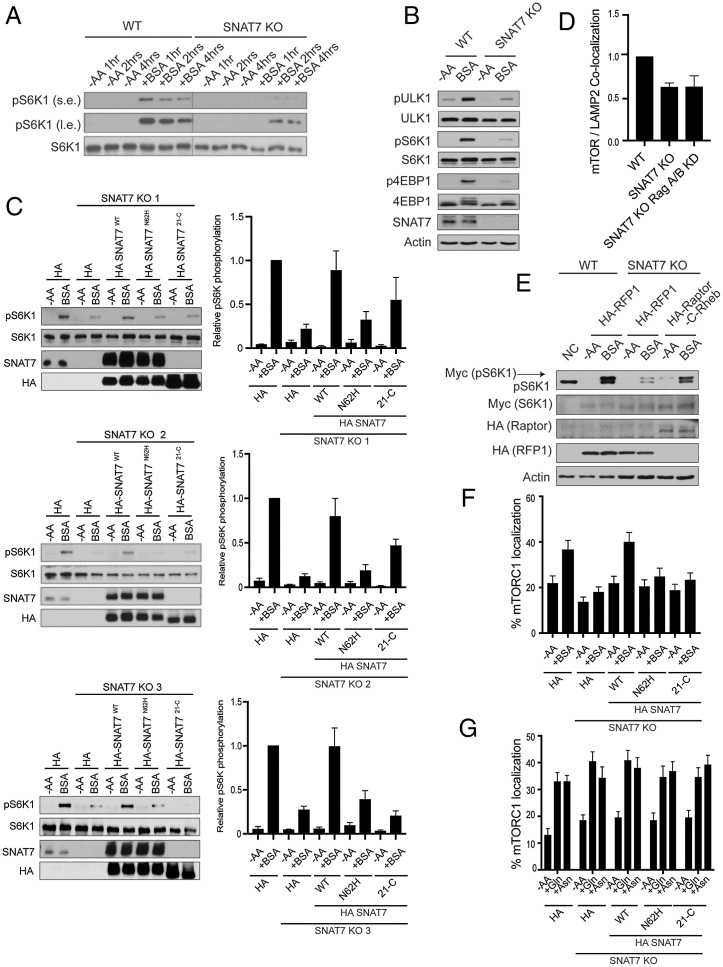
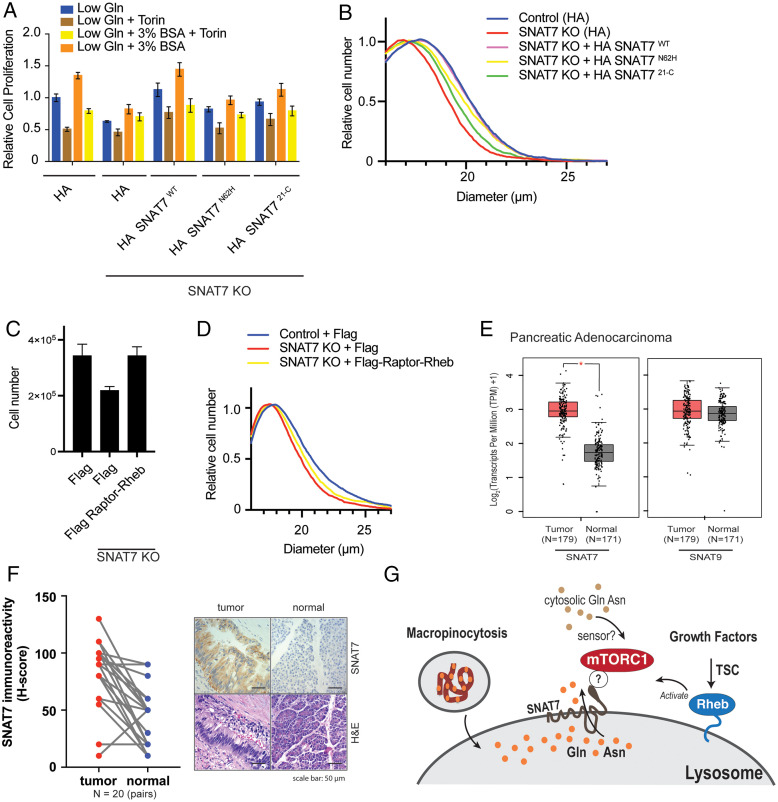
Mammalian target of rapamycin complex 1 (mTORC1) senses amino acids to control cell growth, metabolism, and autophagy. Some amino acids signal to mTORC1 through the Rag GTPase, whereas glutamine and asparagine activate mTORC1 through a Rag GTPase-independent pathway. Here, we show that the lysosomal glutamine and asparagine transporter SNAT7 activates mTORC1 after extracellular protein, such as albumin, is macropinocytosed. The N terminus of SNAT7 forms nutrient-sensitive interaction with mTORC1 and regulates mTORC1 activation independently of the Rag GTPases. Depletion of SNAT7 inhibits albumin-induced mTORC1 lysosomal localization and subsequent activation. Moreover, SNAT7 is essential to sustain KRAS-driven pancreatic cancer cell growth through mTORC1. Thus, SNAT7 links glutamine and asparagine signaling from extracellular protein to mTORC1 independently of the Rag GTPases and is required for macropinocytosis-mediated mTORC1 activation and pancreatic cancer cell growth.

Keywords: SNAT7; mTOR; macropinocytosis.


Conflict of interest statement

The authors declare no competing interest.

Figures

Fig. 1.
Fig. 1.
SNAT7 is elevated and promotes mTORC1 signaling in the absence of the Rag GTPases. (A) Table summarizing mRNA levels of solute carrier transporters in wild-type (WT) and RagA/B knockout (KO) human embryonic kidney 293A (HEK293A) and mouse embryonic fibroblast (MEF) cells. P values were determined by Student’s t tests. P values greater than 0.05 were labeled as not significant (ns). Red text denotes increase in expression, whereas green text denotes a decrease in expression. mRNA levels that were not determined due to bad performance of primers were labeled as “–”. (B) Expression of SNAT7 and SNAT9 in WT and RagA/B KO HEK293A and MEF cells. mRNA levels of SNAT7 and SNAT9 were determined in WT or RagA/B KO MEF or HEK293A cells by real-time quantitative PCR. See (A) for P values. (C) SNAT7 expression is elevated in Rag A/B KO MEF cells. Protein levels of SNAT7 in WT or RagA/B KO MEFs were determined by Western blotting. Vinculin was used as a loading control. (D) Protein levels of SNAT7 in WT, Rag A/B KO MEFs, or Rag A/B KO MEFs stably expressing Flag-tagged Rag A were determined by Western blotting. RagA and Flag-tagged RagA were blotted for as controls. Vinculin was used as a loading control. (E) SNAT7 localizes to the lysosome, shown by immunofluorescence analysis depicting HA-tagged SNAT7 (green) and the lysosomal marker LAMP2 (red). (F) Subcellular fractionation experiments in HEK293A cells were performed separating the organelle and cytoplasmic fraction. SNAT7, LAMP2 (lysosomal marker), and Tubulin (cytoplasmic marker) were immunoblotted. (G) Bovine serum albumin (BSA) activates mTORC1 in the absence of the Rag GTPases. WT or RagA/B KO MEF cells were starved of amino acids (−AA) for 2 h and then stimulated with 3% BSA for 2 h. mTORC1 activity was analyzed by immunoblotting for the phosphorylation status of S6K1 (pS6K1) at threonine 389. S6K, actin, and vinculin were used as loading controls. (H) mTORC1 is activated by BSA. MIA PaCa-2 cells were starved of amino acids (−AA) for 2 h and then stimulated with different BSA (3%) for 4 h. mTORC1 activity was analyzed as described in (G). (I) BSA activates mTORC1 through macropinocytosis. MIA PaCa-2 cells were starved of amino acids (−AA) for 2 h and then stimulated with BSA (3%) for 4 h. Macropinocytosis inhibitor EIPA (25 μM) or DMSO as a control was maintained for the whole period of the starvation and stimulation process. mTORC1 activity was analyzed as described in (G). (J) BSA activates mTORC1 in pancreatic, colon, and lung cancer cell lines. Pancreatic (MIA PaCa-2), colon (HCT116), or lung (H2030) cancer Ras transformed cells were starved for amino acids (−AA) for 2 h followed by 3% BSA stimulation for 2 h (in HCT116) or 4 h (in MIA PaCa-2 and H2030). mTORC1 activity was analyzed as described in (G). (K) Expression of SNAT7 enhances BSA-induced mTORC1 activation. WT or HA-tagged SNAT7 stably expressed MIA PaCa-2 cells were starved of amino acids (−AA) for 2 h and then stimulated with 3% BSA for 4 h. mTORC1 activity was analyzed as described in (G). S6K1 and vinculin were used as loading controls. HA-tagged SNAT7 overexpression was confirmed by Western blotting. (L) Albumin signals to mTORC1 in the absence of the Rag GTPases. MIA PaCa-2 cells were starved of amino acids (−AA) for 2 h and then stimulated with 3% BSA for 4 h. mTORC1 activity was analyzed as described in (G). RagA/B levels were confirmed using Western blotting. Vinculin and S6K were used as loading controls.
Fig. 2.
Fig. 2.
SNAT7 interacts with mTORC1 at the lysosome. (A) Overexpressed SNAT7 interacts with mTORC1. MIA PaCa-2 cells overexpressing HA-tagged SNAT7 or HA-tagged RFP (control) were immunoprecipitated with anti-HA beads, and then analyzed for indicated proteins (mTOR, Raptor, mLST8, Rictor, Sin 1, RagA, RagC, LAMTOR1-4, Arf1, V0C, V0D, V1A, SNAT9, SNAT7, LAMP2, and TMEM 192). (B) Overexpressed SNAT7 interacts with mTORC1 in the absence of the Rag GTPases. RagA/B knockout (KO) human embryonic kidney 293A (HEK293A) cells were transfected with HA-tagged RFP1 or HA-tagged SNAT7 for 24 h. Under normal culturing conditions (with amino acids present), anti-HA lysates were analyzed for mTORC1 components (mTOR, Raptor, and mLST8) via Western blot analysis. HA-tagged SNAT7, HA-tagged RFP1, and vinculin were probed for as controls. IP, immunoprecipitation; WCL, whole cell lysate. (C) Endogenous SNAT7 interacts with mTORC1. RagA/B KO HAP1 cells with an endogenously tagged GFP on Raptor were used to detect an endogenous interaction between mTORC1 and SNAT7 under normal culturing conditions. Anti-GFP immunoprecipitates were probed for GFP-tagged Raptor, mTOR and SNAT7 by Western blot analysis. (D) SNAT7 forms a nutrient sensitive complex with mTORC1. HA-tagged SNAT7 stably overexpressed RagA/B KO HEK293A cells were starved of amino acids (−AA) for 4 h or not starved (NC), and anti-HA lysates were analyzed for mTORC1 components (mTOR and Raptor). Phosphorylation status of S6K1 (pS6K1) at threonine 389 was assessed for mTORC1 activity by Western blot. S6K were probed for as loading controls. NC, normal culturing conditions. (E) BSA activates mTORC1. MIA PaCa-2 cells were starved of amino acids (−AA) for 2 h and then stimulated with BSA for 15 mins, 30 mins, 1 h, or 2 h. mTORC1 activity was analyzed as in (D). (F) Albumin regulates SNAT7-mTORC1 binding. HA-tagged SNAT7 stably overexpressed in MIA PaCa-2 cells were starved for amino acids (−AA) for 2 h followed by 3% bovine serum albumin (BSA) stimulation for 15 mins or (G) 4 h, and anti-HA lysates were analyzed for mTORC1 components (mTOR and Raptor). mTORC1 activity was analyzed as in (D). (H) A schematic of the 11-transmembrane protein SNAT7 on lysosomal membrane. “N” and “C” denote N terminus and C terminus, respectively. Number ranges indicate amino acid sequences of corresponding regions of this protein. (I) The N terminus of SNAT7 interacts with mTORC1. RagA/B KO HEK293A cells were transfected with GFP-tagged HA, or GFP-HA-tagged SNAT7 1–150 for 24 h. Proteins were immunoprecipitated with HA beads, and probed for mTOR, Raptor, mLST8, and SNAT7. (J) HA-tagged SNAT7 or HA-tagged SNAT7 1–150 (green) was overexpressed in HEK293A RagA/B KO cells for 24 h. Colocalization of HA-tagged SNAT7 or HA-tagged SNAT7 1–150 and the lysosomal protein (LAMP2, red) was analyzed via confocal microscopy. (K) Overexpression of the N terminus of SNAT7 inhibits mTORC1 signaling. RagA/B KO HEK293A cells were transfected with GFP-HA or GFP-HA-tagged SNAT7 1–150 for 24 h. (Left) Overexpression of HA-tagged SNAT7 1–150 truncation was confirmed by Western blot and Vinculin was probed for as control. (Right) Cells were then starved of amino acids (−AA) and stimulated with 3% BSA for 4 h. mTORC1 activity was determined as described in (D). Vinculin was probed for as a loading control. (L) The N terminus (amino acids 1–20) of SNAT7 is required to interact with mTORC1. RagA/B KO HEK293A cells were transfected with HA-tagged RFP1, HA-tagged SNAT7, and HA-tagged SNAT7 missing amino acids 1–20 (HA-tagged SNAT7 21-C) for 24 h. Proteins were immunoprecipitated with HA beads, and probed for mTOR, Raptor, mLST8, and HA. WCL were probed for mTOR, Raptor, mLST8, HA, and vinculin as controls. (M) Deletion of the N terminus (amino acids 1–20) does not alter SNAT7 lysosomal localization. HA-tagged SNAT7 21-C (green) was overexpressed in HEK293A RagA/B KO cells for 24 h. Colocalization of HA-tagged SNAT7 21-C and the lysosomal protein (LAMP2, red) was analyzed via confocal microscopy.
Fig. 3.
Fig. 3.
SNAT7 is required for albumin-induced mTORC1 activation. (A) SNAT7 deletion impairs mTORC1 activation by macropinocytosis at multiple time points. WT or SNAT7 KO MIA PaCa-2 cells (SNAT7 KO) were starved of amino acids for 2 h and then maintained in amino acid starvation media (−AA) or stimulated with 3% bovine serum albumin (+BSA) for the indicated times. mTORC1 activity was analyzed by immunoblotting for the phosphorylation status of S6K1 (pS6K1) at threonine 389. s.e., short exposure; l.e., long exposure. S6K1 was probed for as a loading control. (B) SNAT7 is required for macropinocytosis mediated mTORC1 activation of multiple downstream substrates. SNAT7 KO MIA PaCa-2 cells were starved of serum and amino acids (−AA) and stimulated with 3% BSA for 4 h. mTORC1 activity was analyzed by immunoblotting for the phosphorylation status of ULK1 at serine 758 (pULK1), S6K1 at threonine 389 (pS6K1), 4EBP1 at serine 65 (p4EBP1), or by mobility shift of the total 4EBP1 protein. ULK1, S6K1, SNAT7, and actin were probed for as controls. (C) SNAT7 is required for BSA-induced mTORC1 activation. WT MIA PaCa-2 cells, SNAT7 KO (3 different clones as indicated), or SNAT7 KO cells overexpressing HA-tagged SNAT7WT, HA-tagged SNAT7N62H, or HA-tagged SNAT721-C were starved of amino acids (−AA) for 2 h and then stimulated with BSA. (Left) mTORC1 activity was analyzed by the phosphorylation of S6K. SNAT7 levels were confirmed using Western blotting. S6K and HA are loading controls. (Right) Quantification of pS6K levels and statistical analysis. Clone 1: WT + BSA vs. SNAT7 KO + BSA, P < 0.001; WT + BSA vs. HA-SNAT7N62H + BSA, P < 0.001; WT + BSA vs. HA-SNAT721-C + BSA, P > 0.05; and SNAT7 KO + BSA vs. HA-SNAT7WT + BSA, P < 0.05. Clone 2: WT + BSA vs. SNAT7 KO + BSA, P < 0.0001; WT + BSA vs. HA-SNAT7N62H + BSA, P < 0.001; WT + BSA vs. HA-SNAT721-C + BSA, P < 0.01; and SNAT7 KO + BSA vs. HA-SNAT7WT + BSA, P < 0.05. Clone 3: WT + BSA vs. SNAT7 KO + BSA, P < 0.0001; WT + BSA vs. HA-SNAT7N62H + BSA, P < 0.01; WT + BSA vs. HA-SNAT721-C + BSA, P < 0.001; and SNAT7 KO + BSA vs. HA-SNAT7WT + BSA, P < 0.05. (D) SNAT7 regulates mTORC1 lysosomal localization. WT, SNAT7 KO, or SNAT7 KO with RagA/B knocked down (KD) MIA PaCa-2 cells were assessed for mTORC1 lysosomal localization. Images were quantified for mTOR/LAMP2 colocalization. Significance (P value): WT vs. SNAT7 KO, P < 0.01; WT vs. SNAT7 KO Rag A/B KD, P < 0.05; and SNAT7 KO vs. SNAT7 KO Rag A/B KD, P = 0.984. (E) mTORC1 activation deficiency in SNAT7 KO cells can be rescued by artificially targeting mTORC1 to the lysosome. WT or KO MIA PaCa-2 cells were cotransfected with HA-tagged RFP1, Raptor, or Raptor fused with the C terminus of Rheb (Raptor-C-Rheb), together with Myc-tagged S6K1. Cells were starved of amino acids (−AA) for 2 h and stimulated with 3% BSA for 4 h. mTORC1 activity was assessed as in (A). Myc, HA, and actin were probed for as controls. (F) SNAT7 is required for BSA-induced mTORC1 lysosomal localization. WT, SNAT7 KO, or SNAT7 KO cells overexpressing HA-tagged SNAT7WT, HA-tagged SNAT7N62H, or HA-tagged SNAT721-C were starved of amino acids (−AA) for 2 h and then stimulated with 3% BSA for 4 h. Colocalization of mTOR and the lysosomal protein (LAMP2) was analyzed via confocal microscopy. P values: WT -AA vs. WT + BSA, P < 0.05; HA-SNAT7WT −AA vs. HA-SNAT7WT + BSA, P < 0.01; WT + BSA vs. SNAT7 KO + BSA, P < 0.001; SNAT7 KO + BSA vs. HA-SNAT7WT + BSA, P < 0.001; WT + BSA vs. HA-SNAT7N62H + BSA, P < 0.05; WT + BSA vs. HA-SNAT721-C + BSA, P < 0.05; SNAT7WT + BSA vs. HA-SNAT7N62H + BSA, P < 0.05; and SNAT7WT + BSA vs. HA-SNAT721-C + BSA, P < 0.01. (G) SNAT7 is not required for glutamine and asparagine induced mTORC1 lysosomal localization. WT, SNAT7 knockout (KO), or SNAT7 KO MIA PaCa-2 cells overexpressing HA-tagged SNAT7WT, HA-tagged SNAT7N62H, or HA-tagged SNAT721-C were starved of amino acids (−AA) for 2 h and then stimulated with 4 mM glutamine (+Gln) or asparagine (+Asn) for 2 h. mTOR and lysosomal protein (LAMP2) colocalization was analyzed with confocal microscopy. P values: WT −AA vs. WT + Gln, P < 0.001; WT −AA vs. WT + Asn, P < 0.001; SNAT7 KO −AA vs. SNAT7 KO + Gln, P < 0.001; SNAT7 KO −AA vs. SNAT7 KO +Asn, P < 0.01; SNAT7WT −AA vs. SNAT7WT + Gln, P < 0.001; SNAT7WT −AA vs. SNAT7WT + Asn, P < 0.001; HA-SNAT7N62H −AA vs. HA-SNAT7N62H + Gln, P < 0.01; HA-SNAT7N62H −AA vs. HA-SNAT7N62H + Asn, P < 0.01; HA-SNAT721-C −AA vs. HA-SNAT721-C + Gln, P < 0.01; and HA-SNAT721-C −AA vs. HA-SNAT721-C + Asn, P < 0.001.
Fig. 4.
Fig. 4.
SNAT7 regulates pancreatic cancer cell growth through mTORC1. (A) SNAT7 depletion inhibits BSA-induced mTORC1 activation and cell proliferation in pancreatic cancer cell lines. Relative cell proliferation was determined for WT MIA PaCa-2 cells, SNAT7 KO, SNAT7 KO MIA PaCa-2 cells expressing HA-tagged SNAT7WT, HA-tagged SNAT7N62H, or HA-tagged SNAT721-C in low glutamine (Gln) with or without Torin, or low Gln + 3% BSA with or without Torin for 24 h. P values: WT Gln vs. WT Gln + BSA, P < 0.001; WT Gln vs. SNAT7 KO Gln, P < 0.001; WT Gln vs. SNAT7 KO Gln + BSA, P < 0.05; WT Gln vs. HA-SNAT7WT Gln, not significant; WT Gln vs. HA- SNAT7WT Gln + BSA, P < 0.01; WT Gln vs. HA-SNAT7N62H Gln, P < 0.01; WT Gln vs. HA-SNAT7N62H Gln + BSA, not significant; WT Gln vs. HA-SNAT721-C Gln, not significant; WT Gln vs. HA-SNAT721-C Gln + BSA, not significant; WT Gln + BSA vs. SNAT7 KO Gln + BSA, P < 0.001; WT Gln + BSA vs. HA- SNAT7WT Gln + BSA, not significant; WT Gln + BSA vs. HA-SNAT7N62H Gln + BSA, P < 0.001; WT Gln + BSA vs. HA-SNAT721-C Gln + BSA, P < 0.05; SNAT7 KO Gln vs. HA-SNAT7WT Gln, P < 0.001; SNAT7 KO Gln vs. HA-SNAT7N62H Gln, P < 0.01; SNAT7 KO Gln vs. HA-SNAT721-C Gln, P < 0.001; SNAT7 KO Gln + BSA vs. HA-SNAT7WT Gln + BSA, P < 0.001; SNAT7 KO Gln + BSA vs. HA-SNAT7N62H Gln + BSA, not significant; and SNAT7 KO Gln + BSA vs. HA-SNAT721-C Gln + BSA, P < 0.01. (B) SNAT7 depletion inhibits cell growth in pancreatic cancer cell lines. The cell size of control, SNAT7 KO, SNAT7 KO expressing HA-tagged SNAT7WT, SNAT7 KO expressing HA-tagged SNAT7N62H, or SNAT7 KO expressing HA-tagged SNAT721-C MIA PaCa-2 cells were analyzed after 48 h in low glutamine with 3% BSA condition. P values: control vs. SNAT7 KO, P < 0.001; control vs. HA-SNAT7WT, not significant; control vs. HA-SNAT7N62H, P < 0.01; control vs. SNAT7 KO, P < 0.01; SNAT7 KO vs. HA- SNAT7WT P < 0.001; SNAT7 KO vs. HA-SNAT7N62H, P < 0.001; and SNAT7 KO vs. HA-SNAT721-C, P < 0.01. (C) Targeting mTORC1 to the lysosome rescues cell proliferation when SNAT7 is depleted. Cell proliferation was analyzed in WT MIA PaCa-2 cells (control), SNAT7 KO, or SNAT7 KO cells expressing Flag-tagged Raptor-Rheb. P values: control vs. SNAT7 KO, P < 0.01 and SNAT7 KO vs. SNAT7 KO expressing Flag-tagged Raptor-Rheb, P < 0.01. (D) Targeting mTORC1 to the lysosome partially rescues cell size when SNAT7 is depleted. Cell size was measured for WT MIA PaCa-2 cells (control), SNAT7 KO, or SNAT7 KO cells expressing Flag-tagged Raptor-Rheb 48 h after seeding. P values: control vs. SNAT7 KO, P < 0.01 and SNAT7 KO vs. SNAT7 + Flag-Raptor-Rheb, P < 0.05. (E) Expression of SNAT7 is elevated in pancreatic adenocarcinomas. mRNA expression of SNAT7 or SNAT9 in pancreatic adenocarcinomas was analyzed at the GEPIA platform based on TCGA and GTEx dataset. TPM, transcripts per million. *q < 0.001, ANOVA analysis followed by Benjamini and Hochberg false discovery rate correction. (F) SNAT7 protein expression is up-regulated in pancreatic ductal adenocarcinoma tissues. SNAT7 protein expression was analyzed by immunohistochemistry (IHC) staining in 20 pairs of pancreatic ductal adenocarcinoma tissues. (Left) Immunoreactivity scores (H-score) was calculated based on percentage and intensity of staining (see Materials and Methods for details). Statistical analysis was performed by paired Student’s t test. P < 0.0001. (Right) Representative staining images of IHC and corresponding hematoxylin and eosin staining are also shown for tumor and normal samples as indicated. (G) Working model of glutamine (Gln) and asparagine (Asn) signaling pathway to mTORC1. Macropinocytosis engulfs proteins, such as albumin where it is targeted to the lysosome and degraded by proteolysis. Then lysosomal amino acids, specifically Gln and Asn, are exported out of the lysosome into the cytoplasm by SNAT7. Cytosolic Gln and Asn (from macropinocytosis or intracellular/extracellular stores) can then activate mTORC1 through an unknown sensor(s). Growth factors activate mTORC1 through tuberous sclerosis complex (TSC)-Rheb signaling axis. ? denotes that another protein may bridge the SNAT7-mTORC1 interaction.

References

    1. Jewell J. L., Guan K. L., Nutrient signaling to mTOR and cell growth. Trends Biochem. Sci. 38, 233–242 (2013). - PMC - PubMed
    1. Saxton R. A., Sabatini D. M., mTOR signaling in growth, metabolism, and disease. Cell 169, 361–371 (2017). - PubMed
    1. Palm W., Thompson C. B., Nutrient acquisition strategies of mammalian cells. Nature 546, 234–242 (2017). - PMC - PubMed
    1. Gomes A. P., Blenis J., A nexus for cellular homeostasis: The interplay between metabolic and signal transduction pathways. Curr. Opin. Biotechnol. 34, 110–117 (2015). - PMC - PubMed
    1. Sancak Y., et al. , The Rag GTPases bind raptor and mediate amino acid signaling to mTORC1. Science 320, 1496–1501 (2008). - PMC - PubMed

Publication types

MeSH terms

Substances

LinkOut - more resources