. 2022 Sep 20;23(5):bbac167.
doi: 10.1093/bib/bbac167.

FIRM: Flexible integration of single-cell RNA-sequencing data for large-scale multi-tissue cell atlas datasets

Collaborators, Affiliations

FIRM: Flexible integration of single-cell RNA-sequencing data for large-scale multi-tissue cell atlas datasets

Jingsi Ming et al. Brief Bioinform. .

Abstract

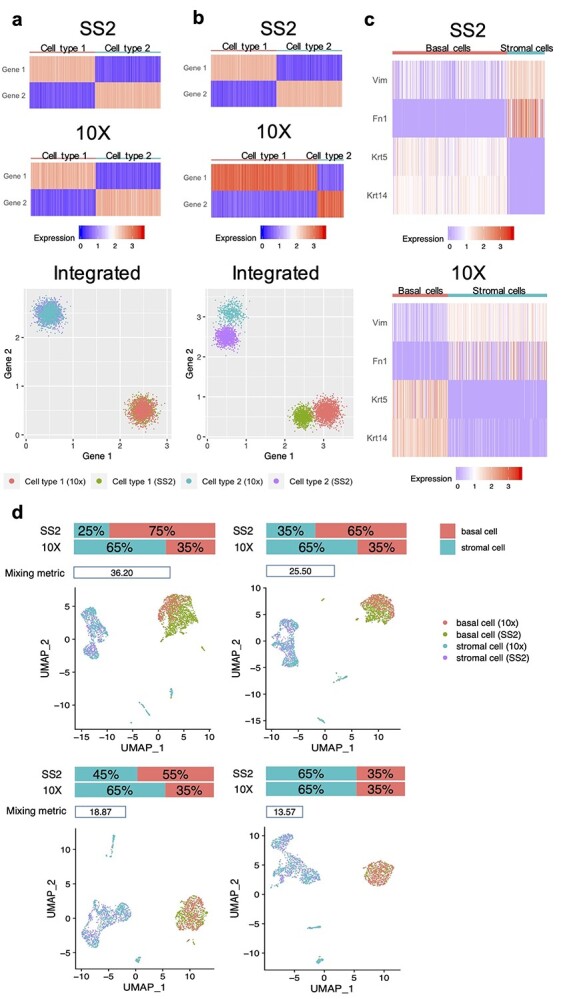
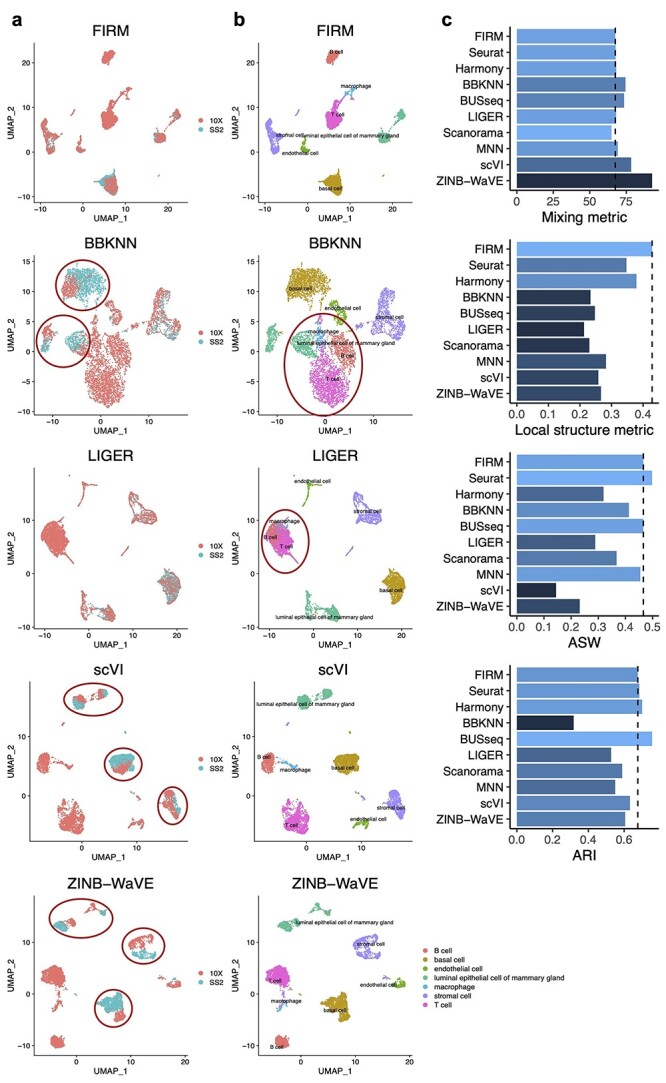
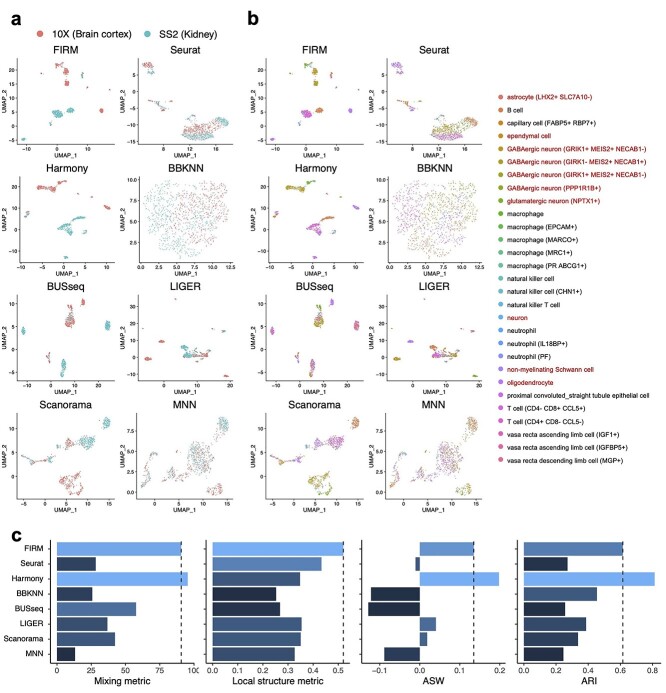
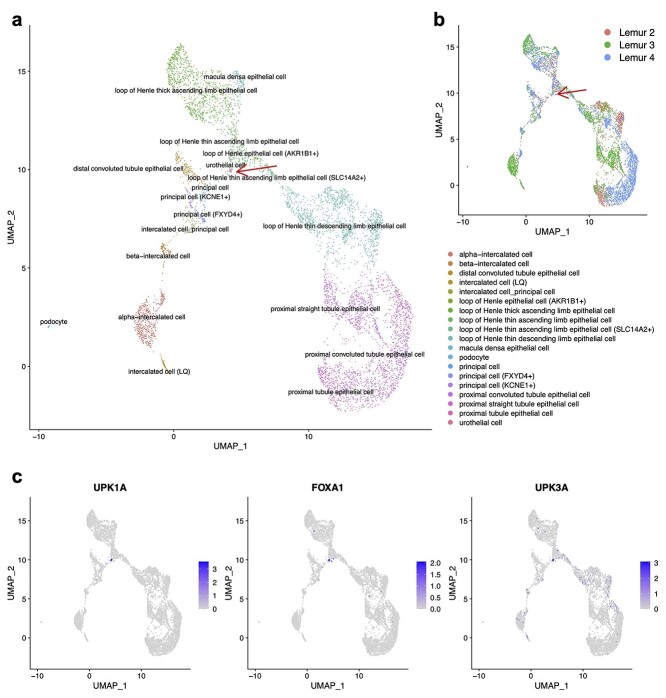
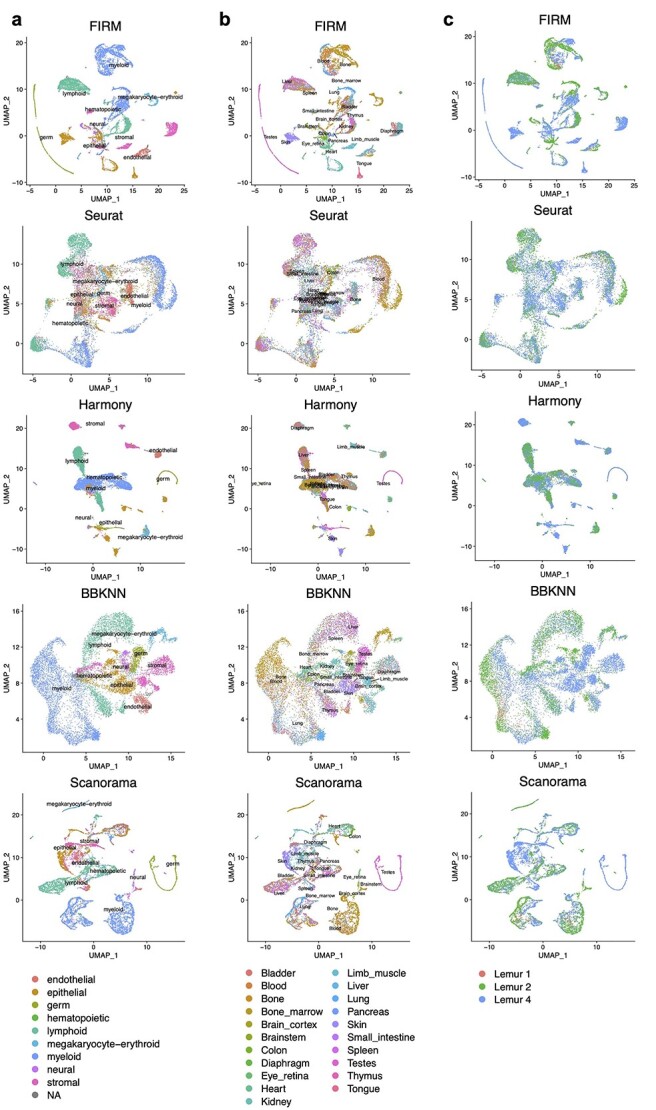
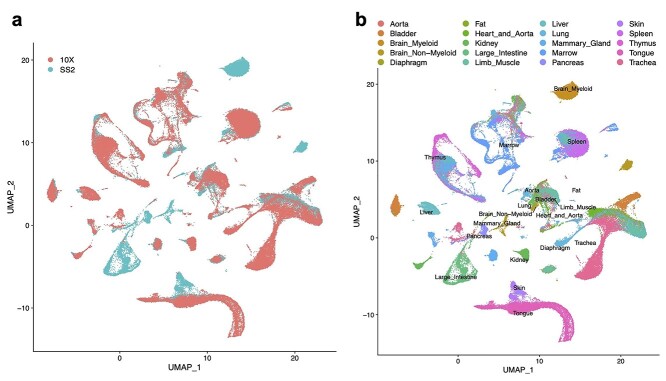
Single-cell RNA-sequencing (scRNA-seq) is being used extensively to measure the mRNA expression of individual cells from deconstructed tissues, organs and even entire organisms to generate cell atlas references, leading to discoveries of novel cell types and deeper insight into biological trajectories. These massive datasets are usually collected from many samples using different scRNA-seq technology platforms, including the popular SMART-Seq2 (SS2) and 10X platforms. Inherent heterogeneities between platforms, tissues and other batch effects make scRNA-seq data difficult to compare and integrate, especially in large-scale cell atlas efforts; yet, accurate integration is essential for gaining deeper insights into cell biology. We present FIRM, a re-scaling algorithm which accounts for the effects of cell type compositions, and achieve accurate integration of scRNA-seq datasets across multiple tissue types, platforms and experimental batches. Compared with existing state-of-the-art integration methods, FIRM provides accurate mixing of shared cell type identities and superior preservation of original structure without overcorrection, generating robust integrated datasets for downstream exploration and analysis. FIRM is also a facile way to transfer cell type labels and annotations from one dataset to another, making it a reliable and versatile tool for scRNA-seq analysis, especially for cell atlas data integration.

Keywords: bioinformatics; cell atlas; data integration; single-cell RNA sequencing.


Figures

Figure 1
Figure 1
Illustration of the influence of cell type composition for scRNA-seq datasets integration based on hypothetical datasets (A and B) and real datasets (C and D). A and B, Gene expressions for cells in SS2 dataset, 10X dataset and integrated dataset after scaling to unit variance for each gene. Each row represents one gene and each column represents one cell. The color gradient shows the gene expression levels in the cells. (A) In the first scenario, the cell type compositions in the hypothetical datasets are the same across datasets (SS2: 50% cell type 1 and 50% cell type 2; 10X: 50% cell type 1 and 50% cell type 2). (B) In the second scenario, the cell type compositions are different across datasets (SS2: 50% cell type 1 and 50% cell type 2; 10X: 80% cell type 1 and 20% cell type 2). (C and D) Illustration of the key problem for integration based on the mammary gland scRNA-seq datasets generated by SS2 and 10X from Tabula Muris, withholding only the basal cells and stromal cells. (C) Marker expressions for basal cells and stromal cells in SS2 dataset and 10X dataset after scaling to unit variance for each gene, where the cell type compositions are different across datasets (SS2: 75% basal cells and 25% stromal cells; 10X: 35% basal cells and 50% stromal cells). (D) Uniform manifold approximation and projection (UMAP) visualization and mixing metric for the integrated dataset with different cell type composition by subsampling basal cells in SS2 dataset.
Figure 2
Figure 2
Comparison of integration methods based on the mammary gland scRNA-seq datasets generated by SS2 and 10X from Tabula Muris. (A and B) UMAP plots of the integrated scRNA-seq dataset colored by platform (A) and by cell type (B) using FIRM, Seurat, BBKNN, BUSseq, LIGER, scVI and ZINB-WaVE. The red circles highlight the problems of the integration results given by these methods. (C) Metrics for evaluating performance across the 10 methods on four properties: cell mixing across platforms (Mixing metric), the preservation of within-dataset local structure (Local structure metric), average silhouette width of annotated subpopulations (ASW) and adjusted rand index (ARI). The color (from light to dark) represents the performance (from the best to the worst). The dashed lines were set at the values for FIRM as reference lines.
Figure 3
Figure 3
Comparison of integration methods for scRNA-seq datasets from two tissues in Tabula Microcebus (lemur 2) generated by different platforms (Kidney: SS2, Brain cortex: 10X). For clear illustration, we withheld several cell types in each of the dataset to make the cell types non-overlapped across datasets. (A and B) UMAP plots of scRNA-seq datasets colored by platform (A) and by cell type (B) after integration using FIRM, Seurat, Harmony, BBKNN, BUSseq, LIGER, Scanorama and MNN. The labels for cell types in Brain cortex (10X) are colored by red. (C) Metrics for evaluating performance across the eight methods on four properties: cell mixing across platforms (Mixing metric), the preservation of within-dataset local structure (Local structure metric), average silhouette width of annotated subpopulations (ASW) and adjusted rand index (ARI). The color (from light to dark) represents the performance (from the best to the worst). The dashed lines were set at the values for FIRM as reference lines.
Figure 4
Figure 4
The FIRM integration for the kidney datasets across individuals and platforms in Tabula Microcebus. We subset the scRNA-seq datasets to keep the cells belonging to the epithelial compartment. (A and B) UMAP plots colored by cell type (A) and by individual (B) after integration using FIRM. (C) The expression levels of three marker genes (UPK1A, FOXA1 and UPK3A) for urothelial cells.
Figure 5
Figure 5
Comparison of FIRM, Seurat, Harmony, BBKNN and Scanorama for integration of all SS2 datasets across individuals and tissues in Tabula Microcebus. (AC) UMAP plots of scRNA-seq datasets colored by compartment (A), by tissue (B) and by individual (C) after integration using FIRM, Seurat, Harmony, BBKNN and Scanorama.
Figure 6
Figure 6
The performance of FIRM for integrating the whole SS2 dataset and 10X dataset of the entire organism in Tabula Muris. (A and B) UMAP plots of scRNA-seq datasets colored by platform (A) and by tissue (B) after integration using FIRM.

References

    1. Villani AC, Satija R, Reynolds G, et al. . Single-cell RNA-seq reveals new types of human blood dendritic cells, monocytes, and progenitors. Science 2017;356(6335):eaah4573. - PMC - PubMed
    1. Treutlein B, Brownfield DG, Wu AR, et al. . Reconstructing lineage hierarchies of the distal lung epithelium using single-cell RNA-seq. Nature 2014;509(7500):371–5. - PMC - PubMed
    1. Enge M, Arda HE, Mignardi M, et al. . Single-cell analysis of human pancreas reveals transcriptional signatures of aging and somatic mutation patterns. Cell 2017;171(2):321–330.e14. - PMC - PubMed
    1. Halpern KB, Shenhav R, Matcovitch-Natan O, et al. . Single-cell spatial reconstruction reveals global division of labour in the mammalian liver. Nature 2017;542(7641):1–5. - PMC - PubMed
    1. Zilionis R, Nainys J, Veres A, et al. . Single-cell barcoding and sequencing using droplet microfluidics. Nat Protoc 2017;12(1):44–73. - PubMed

Publication types