. 2022 Jul 1;10(7):829-843.
doi: 10.1158/2326-6066.CIR-21-0826.

Epigenetic Repression of STING by MYC Promotes Immune Evasion and Resistance to Immune Checkpoint Inhibitors in Triple-Negative Breast Cancer

Affiliations

Epigenetic Repression of STING by MYC Promotes Immune Evasion and Resistance to Immune Checkpoint Inhibitors in Triple-Negative Breast Cancer

Kyung-Min Lee et al. Cancer Immunol Res. .

Abstract

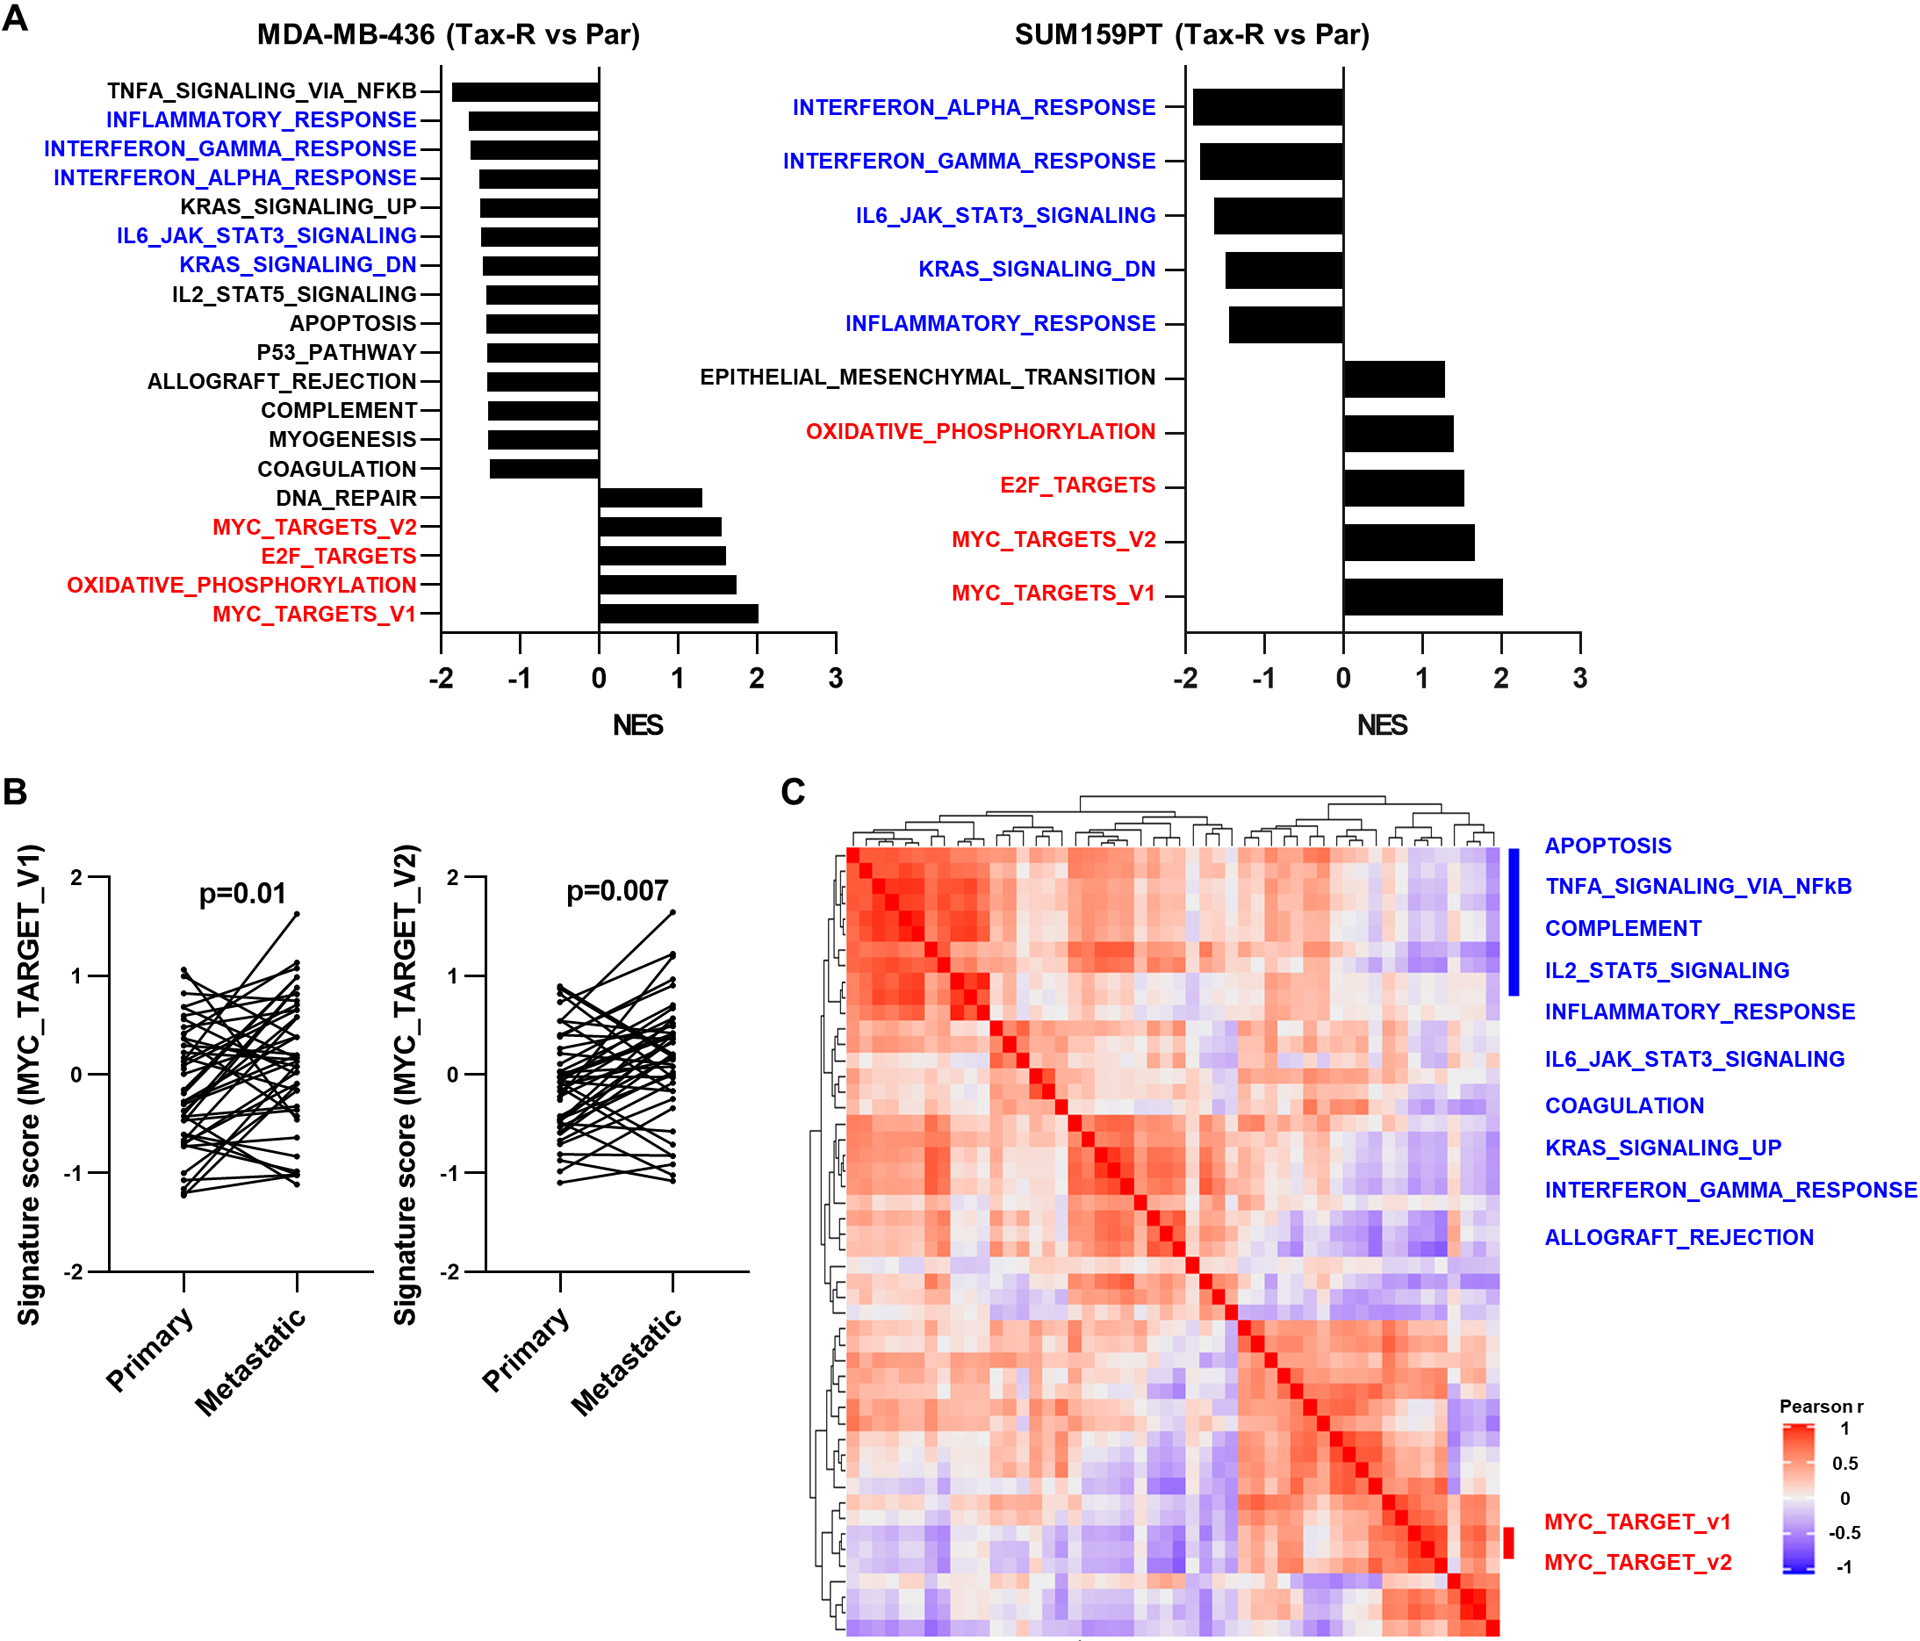
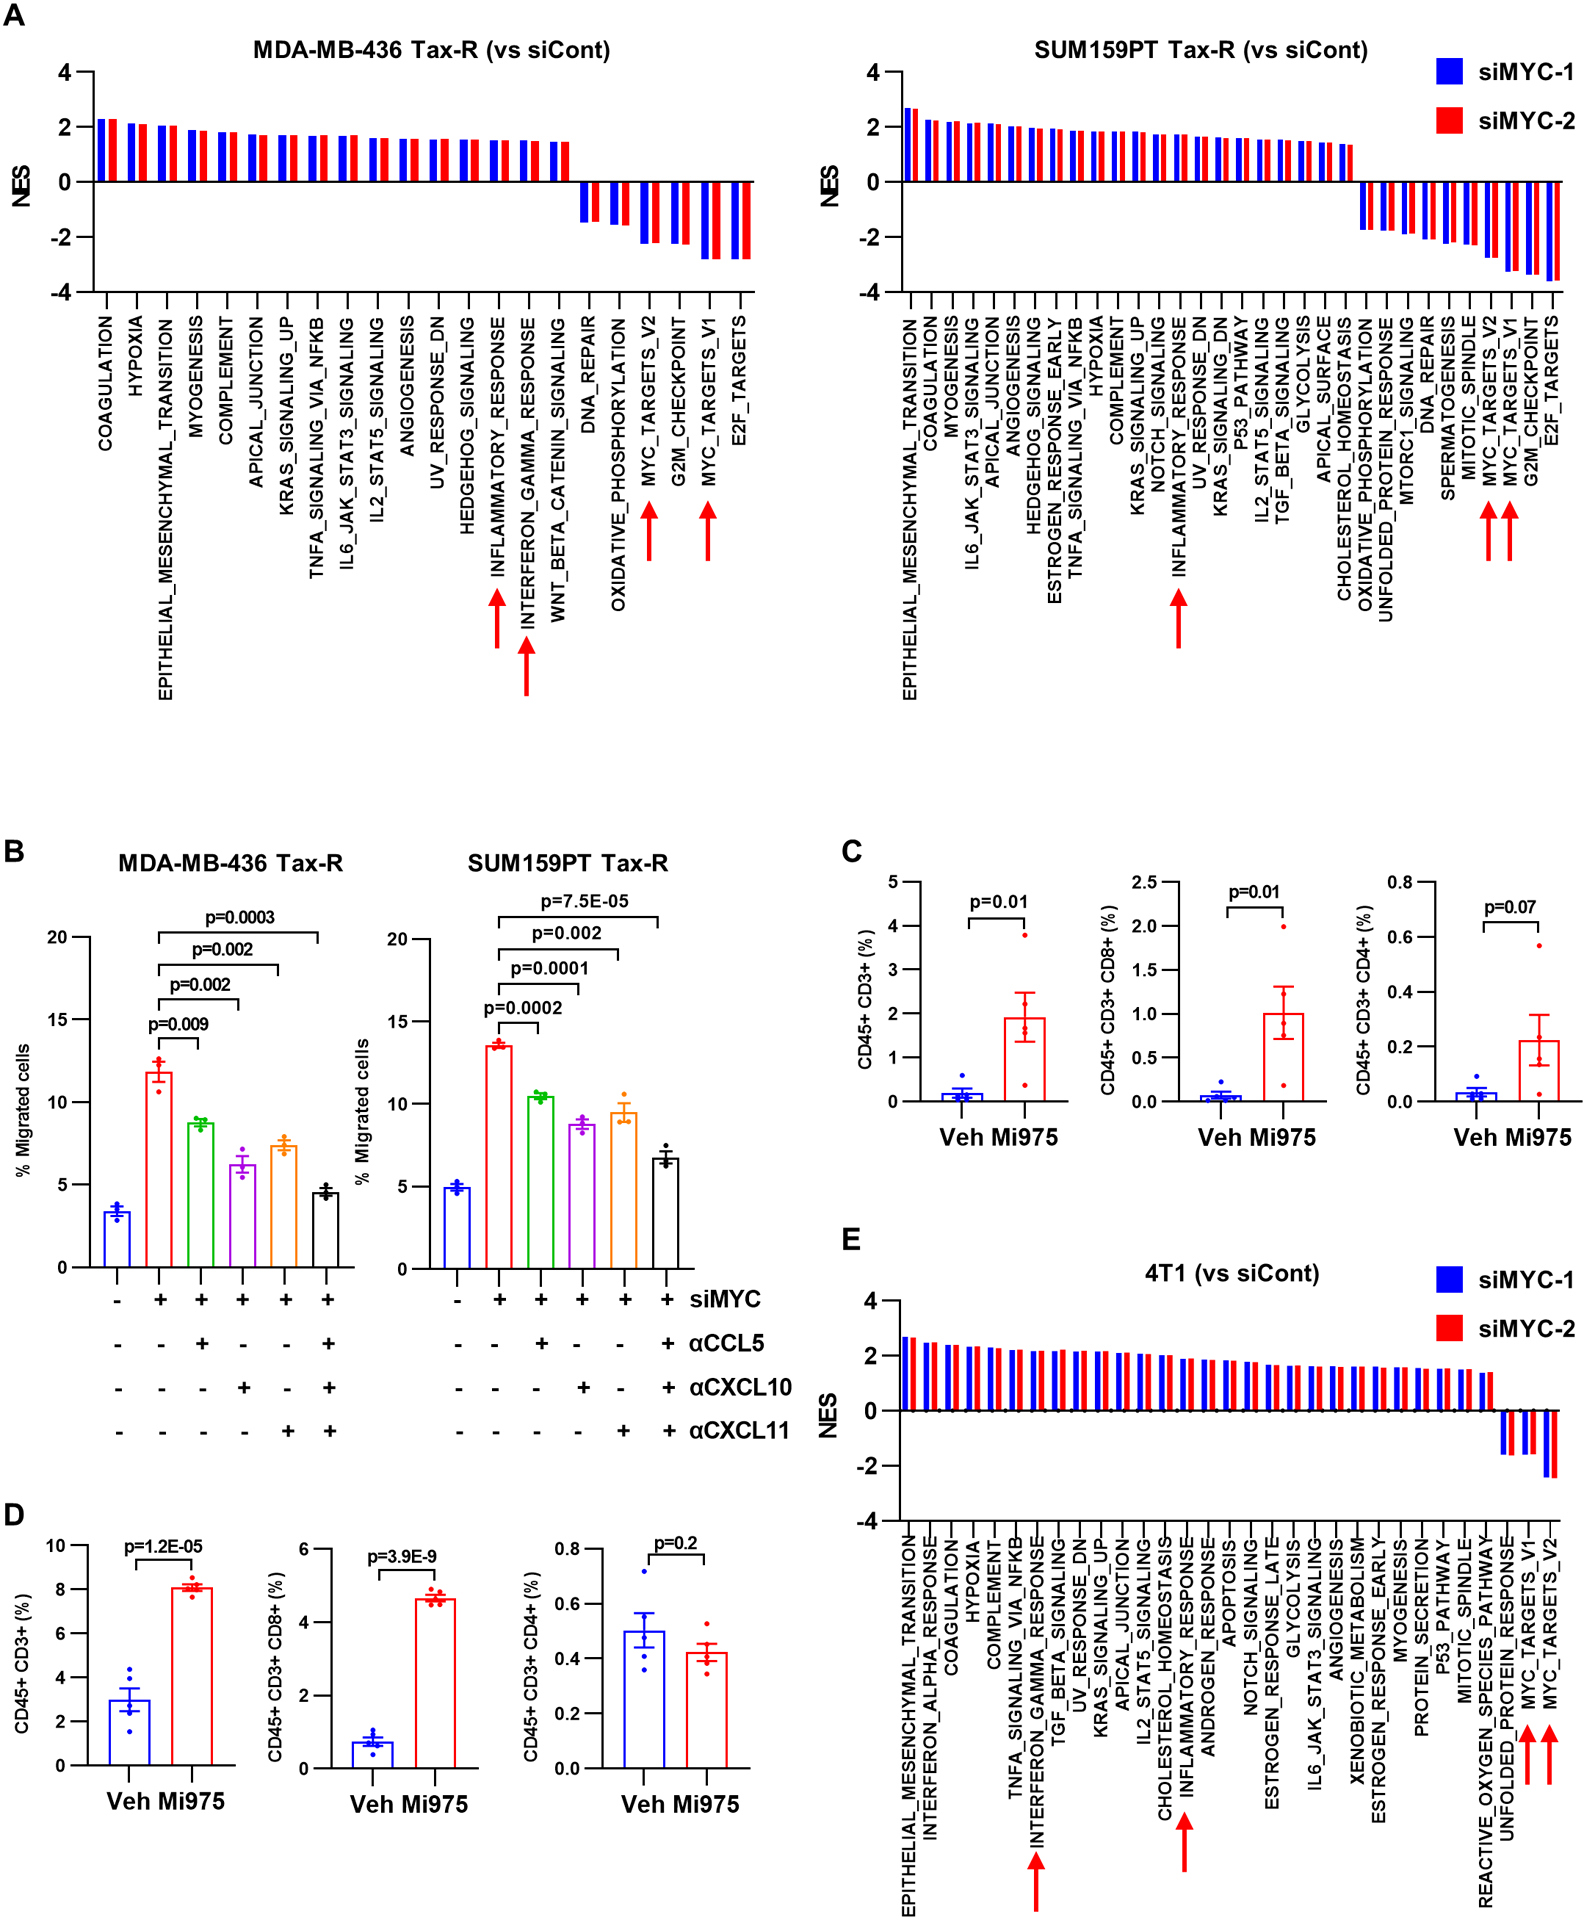
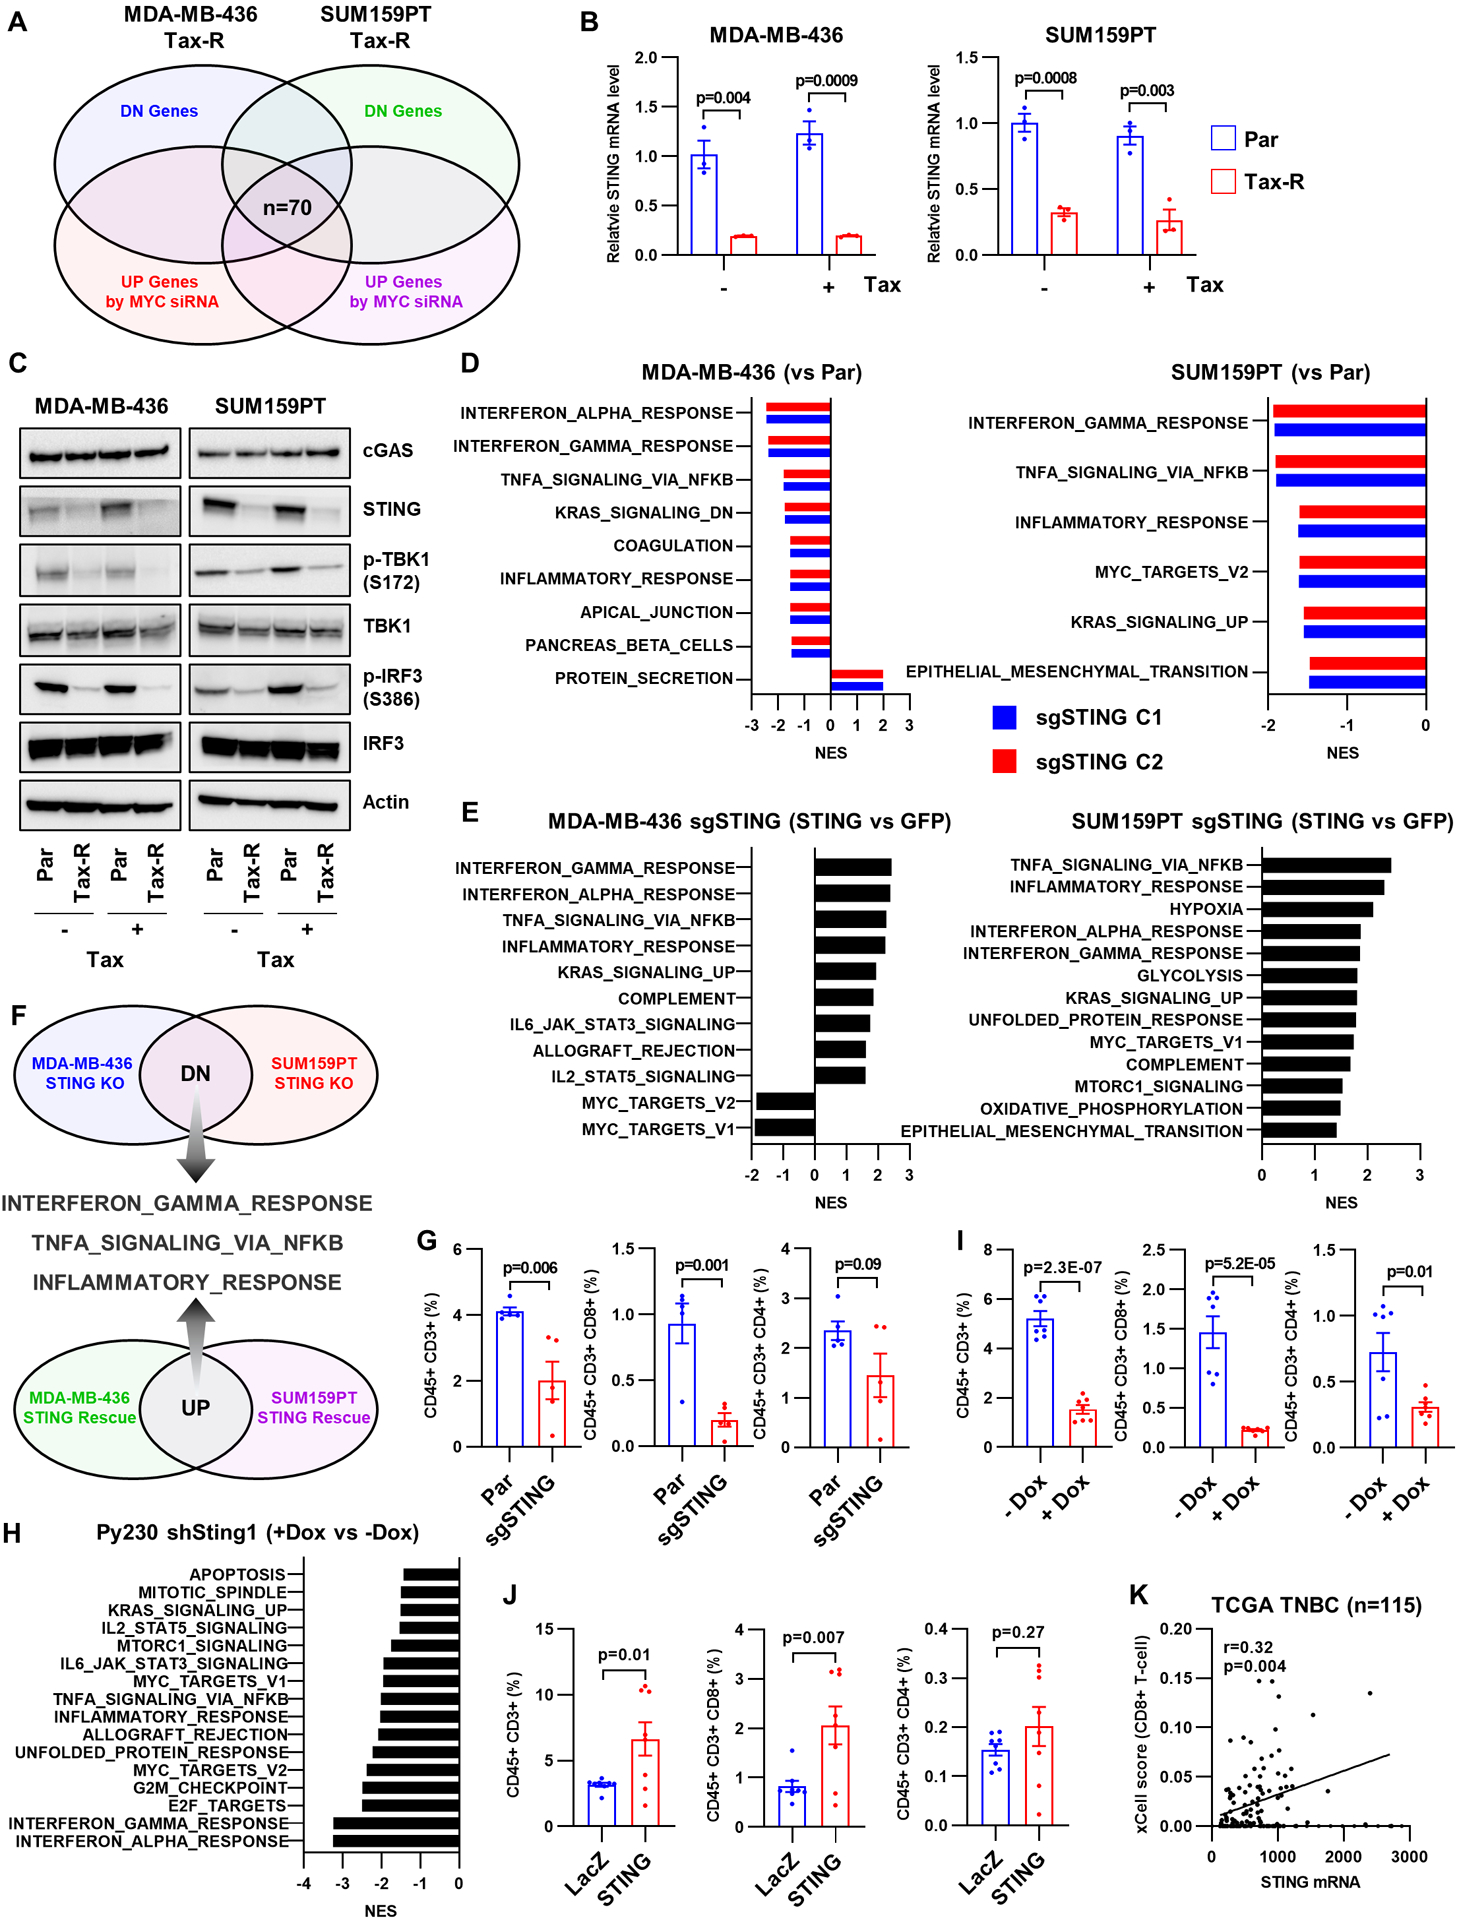
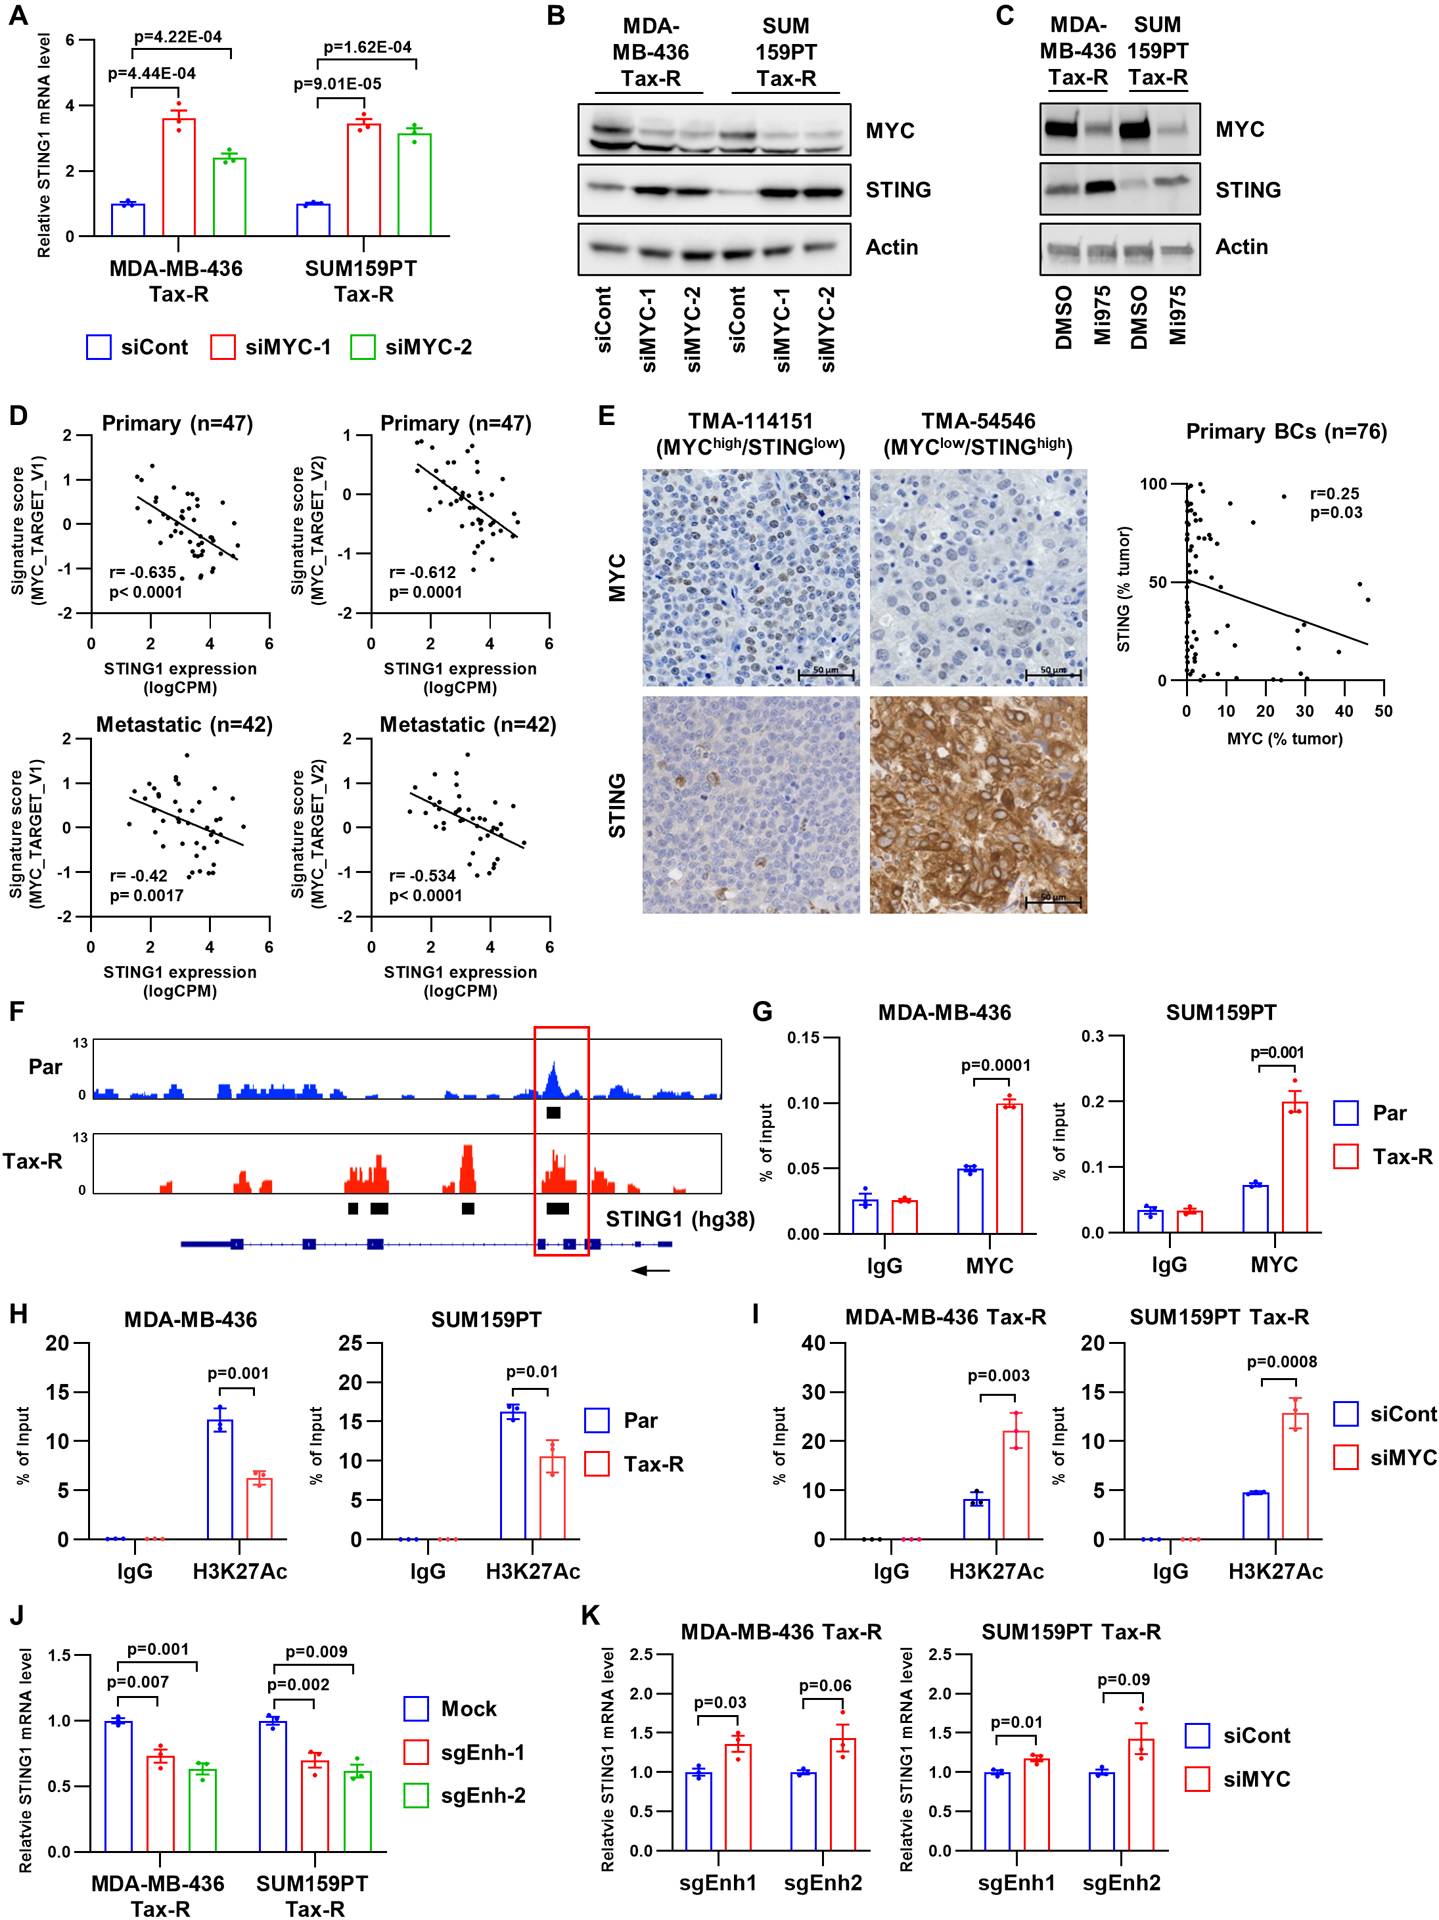
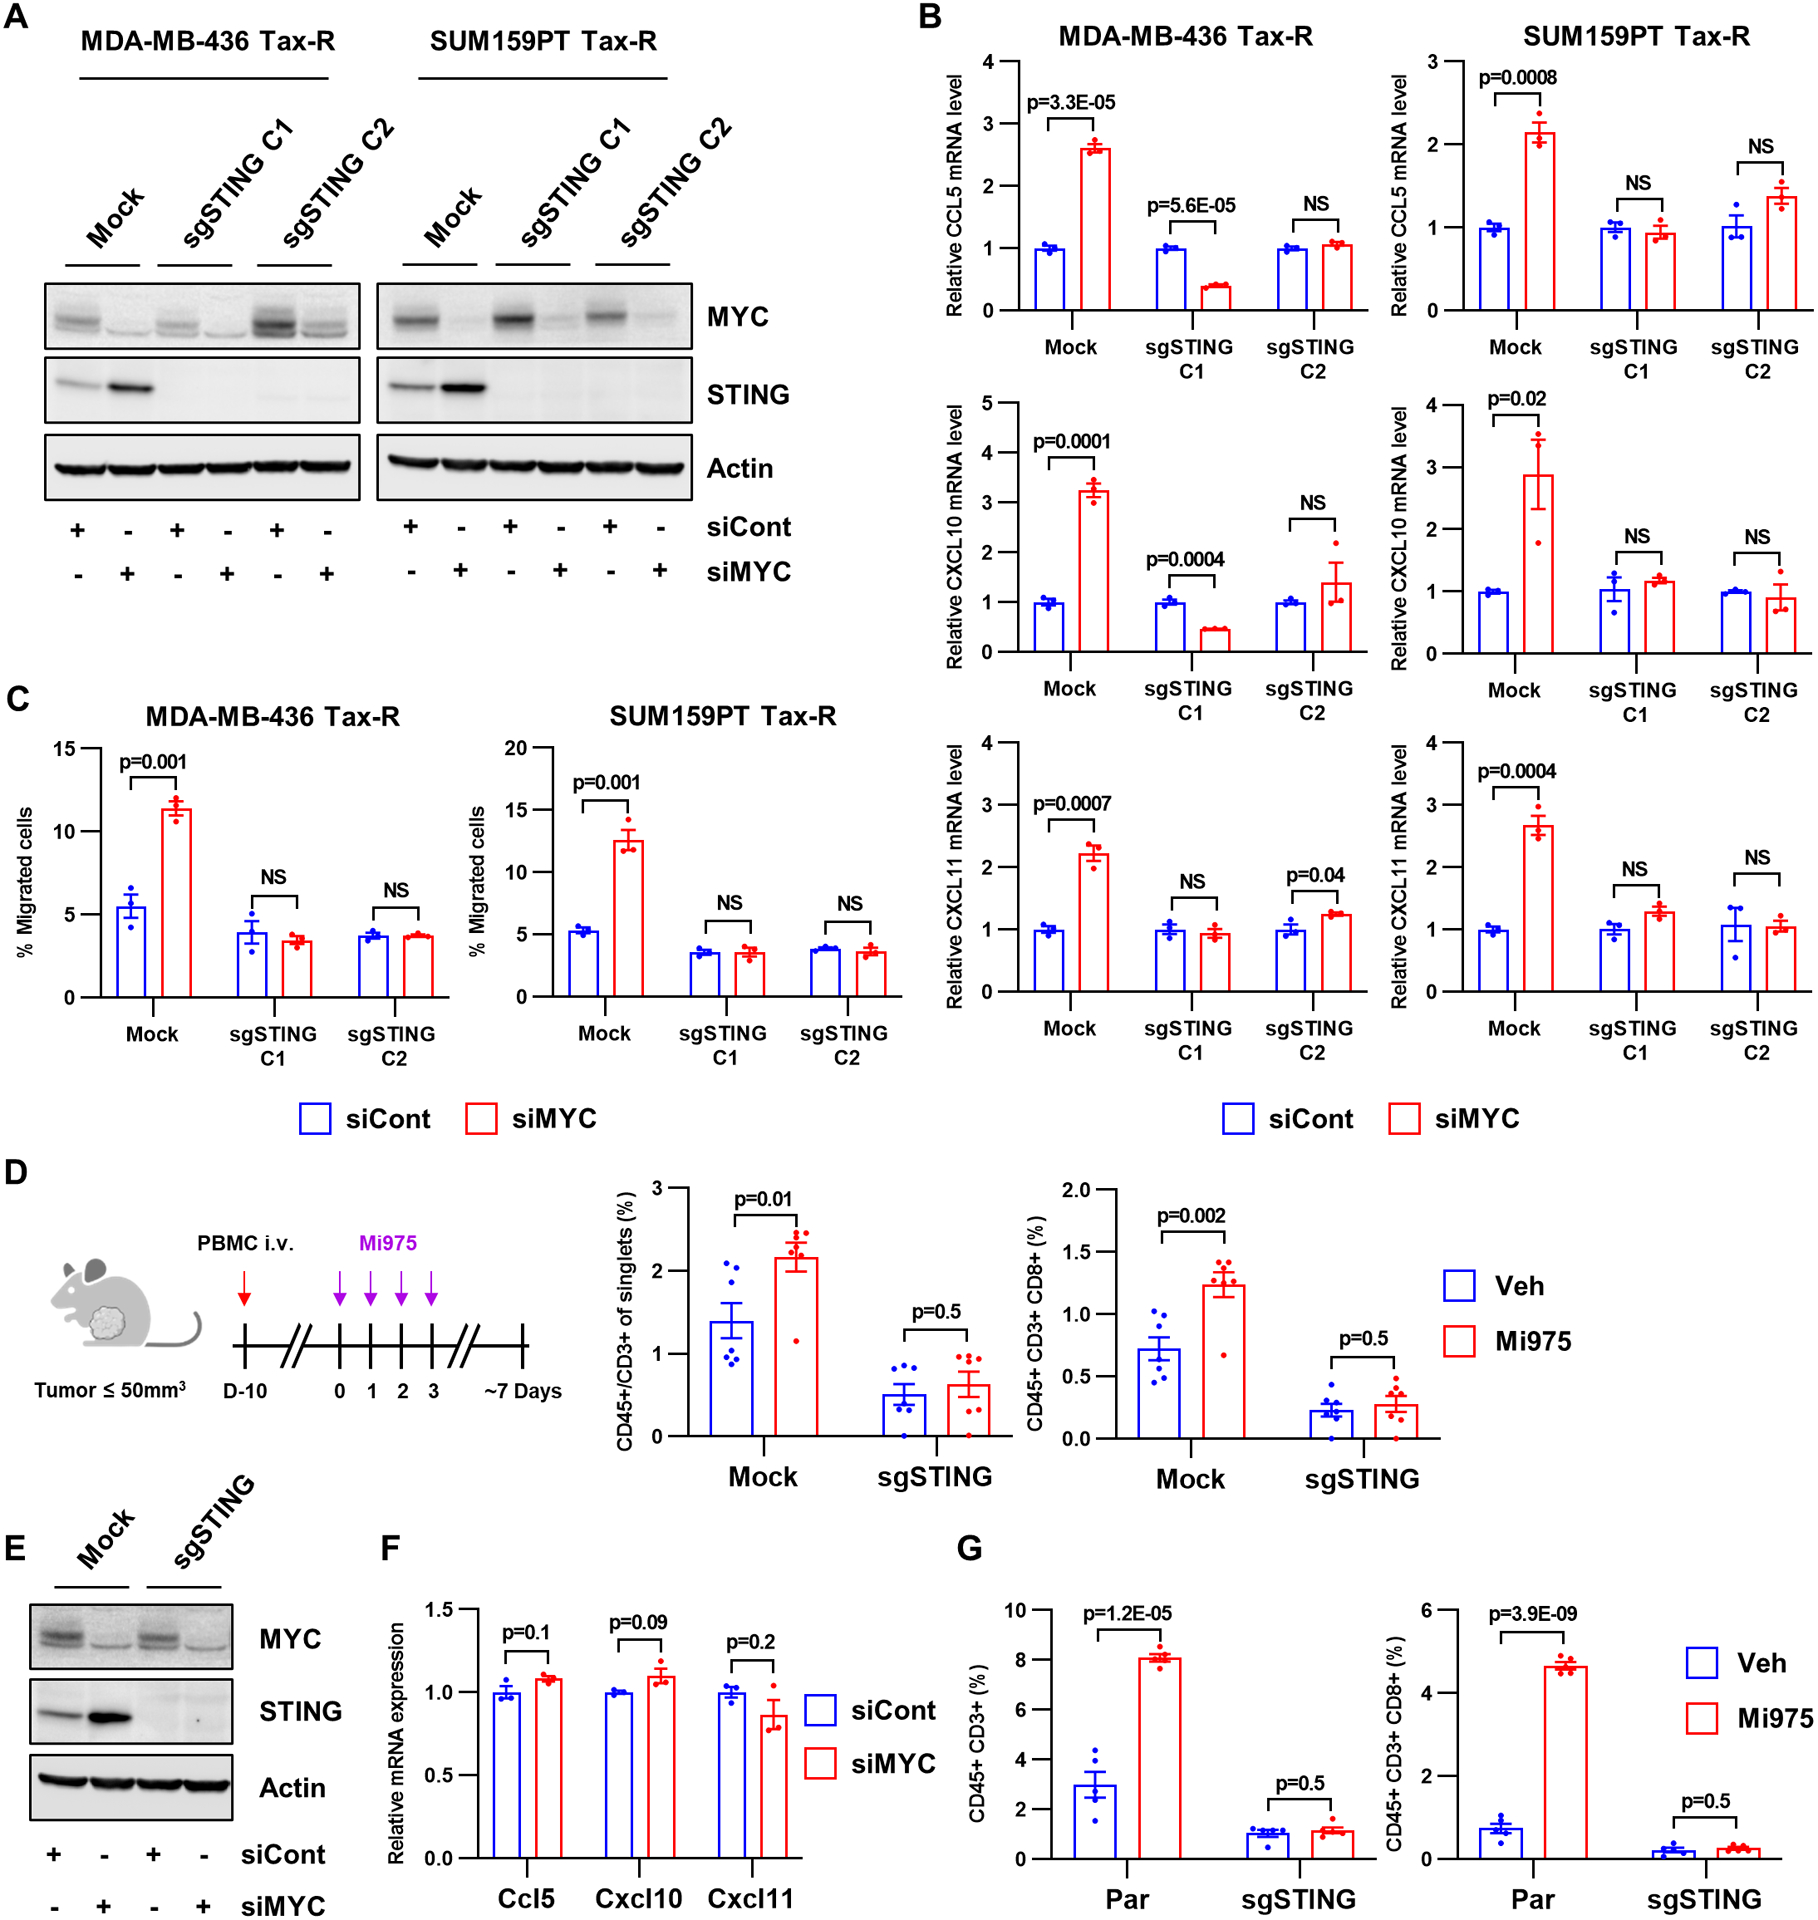
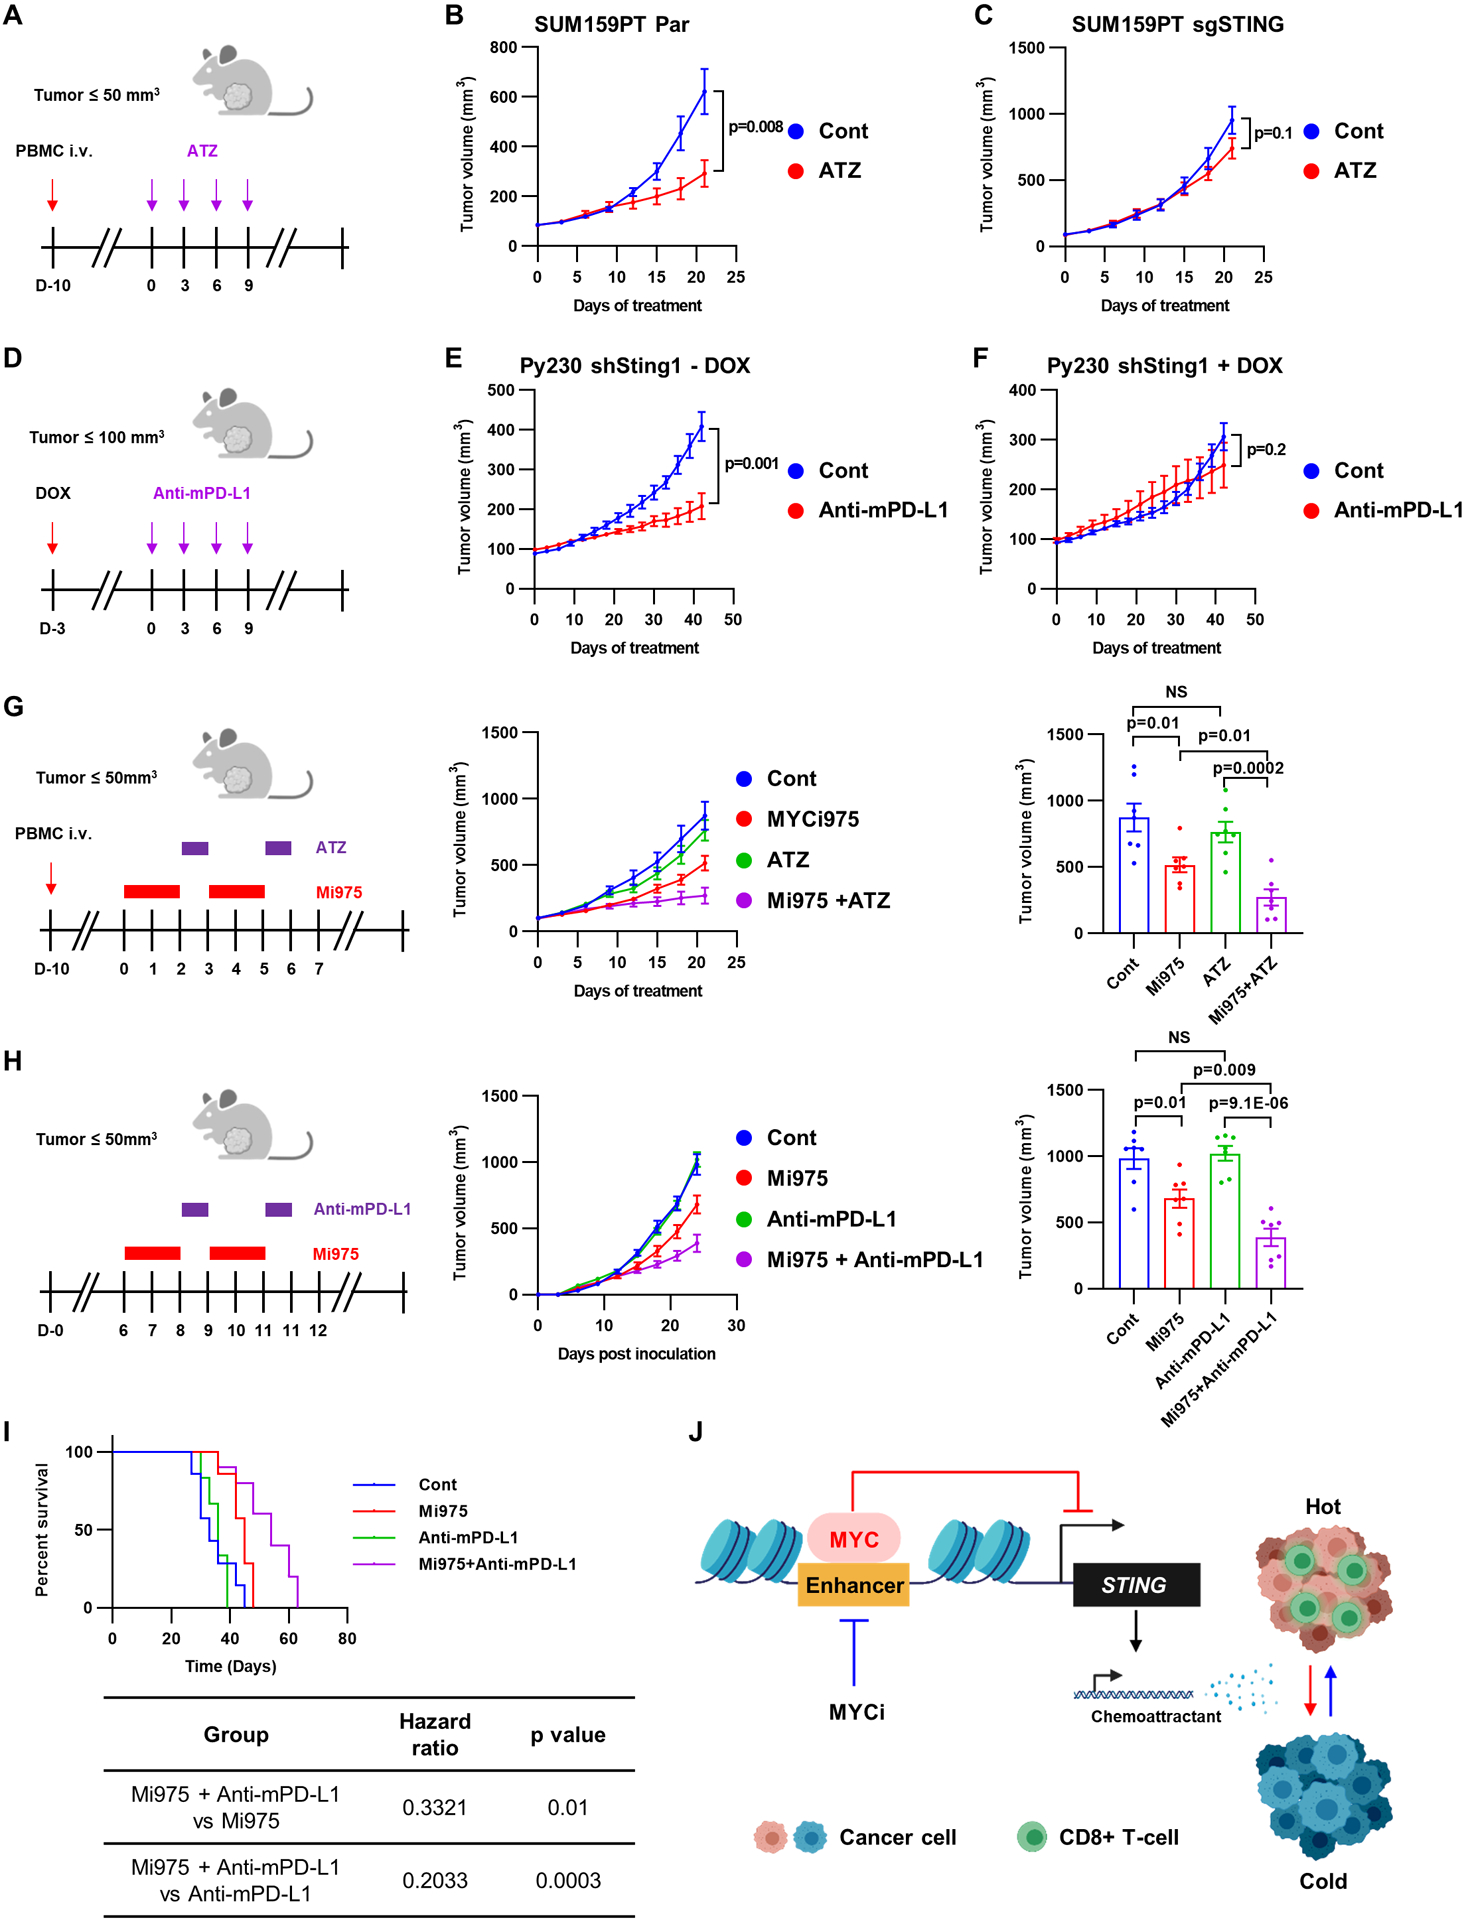
The MYC oncogene is frequently amplified in triple-negative breast cancer (TNBC). Here, we show that MYC suppression induces immune-related hallmark gene set expression and tumor-infiltrating T cells in MYC-hyperactivated TNBCs. Mechanistically, MYC repressed stimulator of interferon genes (STING) expression via direct binding to the STING1 enhancer region, resulting in downregulation of the T-cell chemokines CCL5, CXCL10, and CXCL11. In primary and metastatic TNBC cohorts, tumors with high MYC expression or activity exhibited low STING expression. Using a CRISPR-mediated enhancer perturbation approach, we demonstrated that MYC-driven immune evasion is mediated by STING repression. STING repression induced resistance to PD-L1 blockade in mouse models of TNBC. Finally, a small-molecule inhibitor of MYC combined with PD-L1 blockade elicited a durable response in immune-cold TNBC with high MYC expression, suggesting a strategy to restore PD-L1 inhibitor sensitivity in MYC-overexpressing TNBC.


Figures

Figure 1.
Figure 1.. MYC pathway activation is associated with suppression of immune-related gene expression in TNBC
A, Hallmark gene signatures significantly enriched or downregulated in MDA-MB-436 Tax-R and SUM159PT Tax-R cell transcriptomes relative to respective parental cells (FDR<0.05). The x-axis represents the normalized enrichment score (NES). Hallmark gene sets identified in both cell lines are denoted in blue (downregulated) or red (upregulated). B, Hallmark gene signatures of MYC activation assessed from transcriptome data of primary TNBCs and matched metastatic tumors (n=41 pairs; two-tailed paired t-tests). C, Gene set variation analysis (GSVA) correlations with fifty hallmark gene signatures from TNBCs in TCGA. The color key represents Pearson correlation coefficient.
Figure 2.
Figure 2.. MYC inhibition promotes a T cell–inflamed tumor microenvironment
A, Hallmark gene sets significantly enriched or downregulated in MDA-MB-436 and SUM159PT Tax-R cells transfected (24 h) with each of two MYC siRNAs compared to control siRNA (FDR<0.05). B, Transwell migration of Jurkat CXCR3 cells with CM from MDA-MB-436 and SUM159PT Tax-R cells ± neutralizing CCL5, CXCL10 or CXCL11 antibodies. Each bar represents the mean ± SEM (n=3; two-tailed unpaired t-tests). C-D, Flow cytometry quantification of tumor-infiltrating lymphocytes isolated from PBMC-humanized mice bearing SUM159PT Tax-R tumors (C) or immunocompetent mice bearing syngeneic 4T1 tumors (D) treated with or without MYCi975. Each bar represents the mean ± SEM (n=5, n=5; two-tailed unpaired t-tests). E, Hallmark gene sets significantly enriched or downregulated in 4T1 cells transfected with each of two MYC siRNAs compared to control siRNA (FDR<0.05).
Figure 3.
Figure 3.. STING suppression reduces tumor-infiltrating T cells
A, A Venn diagram identifying seventy overlapping genes across groups of downregulated genes in Tax-R compared to parental cells (top circles) and upregulated genes in Tax-R cells transfected with MYC siRNA compared to control siRNA-transfected cells (bottom circles). B, RNA extracted from the indicated cells after treatment with 10 nM taxol for 48 h was used for quantification of STING1 mRNA RT-qPCR. Each bar represents the mean ± SEM (n=3; two-tailed unpaired t-tests). C, Lysates from the same cells described in B were subjected to immunoblot analysis with cGAS, STING, phospho-TBK1(serine 172), TBK1, phospho-IRF3 (serine 386), IRF3 and actin antibodies. D, Hallmark gene sets significantly enriched or downregulated in MDA-MB-436 STING1 knockout (KO) and SUM159PT STING1 KO cells compared to parental cells (FDR<0.05). E, Hallmark gene sets significantly enriched or downregulated by the re-expression of STING1 in MDA-MB-436 STING1 KO and SUM159PT STING1 KO cells (FDR<0.05). F, Hallmark gene sets found in E and F were integrated to identify hallmark gene sets regulated by STING. G, Flow cytometry quantification of tumor-infiltrating lymphocytes isolated from PBMC-humanized mice bearing SUM159PT parental and STING1 KO tumors. Each bar represents the mean ± SEM (n=5; two-tailed unpaired t-tests). H, Hallmark gene sets significantly enriched or downregulated in Py230 doxycycline-inducible shSting1 cells treated with 200 ng/mL doxycycline (48h) compared to untreated cells (FDR<0.05). I and J, Flow cytometry quantification of tumor-infiltrating lymphocytes isolated from immunocompetent mice bearing Py230 doxycycline-inducible shSting1 tumors ± 10 mg/kg doxycycline (i.p) for 2 weeks (I) or 4T1 tumors stably expressing LacZ or Sting1 (J). Each bar represents the mean ± SEM (n=7; two-tailed unpaired t-tests). K, CD8+ T cell xCell scores correlations with STING1 mRNA expression in the TCGA TNBC cohort (r, Pearson correlation coefficient).
Figure 4.
Figure 4.. MYC binds to a STING1 enhancer and directly represses STING1 expression
A, MDA-MB-436 Tax-R and SUM159PT Tax-R cells were transfected with control or MYC siRNA. After 48 h, RNA was extracted and subjected to RT-qPCR. Bars represent the mean ± SEM (n=3; two-tailed unpaired t-tests). B, Lysates from the same cells shown in A were subjected to immunoblot analysis with MYC, STING and actin antibodies. C, Lysates from MDA-MB-436 Tax-R and SUM159PT Tax-R cells, which had been treated with 6 μM MYCi975 for 48 h, were subjected to immunoblot analysis with MYC, STING and actin antibodies. D, STING1 mRNA abundance was compared to hallmark MYC activation gene signatures scores in primary and metastatic TNBC tumors (r, Spearman correlation coefficient). E, MYC and STING protein were assessed by IHC in residual TNBCs after neoadjuvant chemotherapy (n=76). Representative IHC images are shown on the left. The scatter plot shows Pearson correlation coefficient of the MYC and STING IHC scores (right). F, Binding of MYC to chromatin regions of STING1 in SUM159PT parental and Tax-R cells by ChIP-sequencing. Black rectangles indicate regions with significant association of MYC. G, ChIP-qPCR validating binding of MYC to STING1 chromatin in the indicated cells. Bars represent the mean ± SEM of enrichment values that were expressed as percent of input (n=3; two-tailed unpaired t-tests). H, ChIP-qPCR of acetylated H3K27 binding to the putative enhancer regions of STING1 in the indicated cells. Bars represent the mean ± SEM (n=3; two-tailed unpaired t-tests). I, ChIP-qPCR of acetylated H3K27 binding to the putative enhancer regions of STING1 in the indicated cells that had been transfected with MYC siRNA or control siRNA. Bars represent the mean ± SEM (n=3; two-tailed unpaired t-tests). J, STING1 RT-qPCR from RNA extracted from MDA-MB-436 Tax-R and SUM159PT Tax-R cells, which were transduced with dCas9-KRAB and sgRNA that recognizes the putative enhancer region of STING1. Each bar represents the mean ± SEM relative to non-transduced cells (n=3; two-tailed unpaired t-tests). K, STING1 RT-qPCR on RNA extracted from cells described in J transfected with MYC siRNA or control siRNA. Bars represent the mean ± SEM (n=3; two-tailed unpaired t-tests).
Figure 5.
Figure 5.. T cell–inflamed TME driven by MYC inhibition is mediated by STING
A, Immunoblot analysis for MYC, STING and actin in MDA-MB-436 and SUM159PT Tax-R STING1 KO cells transfected with MYC siRNA or control siRNA. B, RNA was extracted from cells shown in A and subjected to RT-qPCR. Bars represent the mean ± SEM (n=3; two-tailed unpaired t-tests). C, Transwell migration of Jurkat CXCR3 cells. Conditioned media from cells shown in A was added to the bottom wells. Each bar represents the mean ± SEM (n=3; two-tailed unpaired t-tests). D, Flow cytometry quantification of tumor-infiltrating lymphocytes isolated from PBMC-humanized mice bearing established SUM159PT Tax-R or Tax-R STING1 KO tumors treated with vehicle or MYCi975. Bars represent the mean ± SEM (n=5; two-tailed unpaired t-tests). E, 4T1 Sting1 KO cells were transfected with MYC siRNA or control siRNA for 48 h. Cell lysates were prepared and subjected to immunoblot analysis with MYC, STING and actin antibodies. F, RNA was extracted from cells shown in E and subjected to RT-qPCR. Bars represent the mean ± SEM of mRNA relative to cells transfected with control siRNA (n=3; two-tailed unpaired t-tests). G, Flow cytometry quantification of tumor-infiltrating lymphocytes isolated from BALB/c female mice bearing 4T1 parental and Sting1 KO tumors treated with vehicle or MYCi975. Each bar represents the mean ± SEM (n=5; two-tailed unpaired t-tests).
Figure 6.
Figure 6.. MYC-driven STING repression promotes resistance to immune checkpoint inhibitors
A, Experimental schema for B and C. ATZ, atezolizumab B and C, hPBMCs were inoculated into NOD/SCID female mice bearing established SUM159PT parental (B) or SUM159PT STING1 KO (C) tumors treated with vehicle or atezolizumab. Tumor volumes were serially measured with calipers and monitored for 3 weeks. Bars represent the mean ± SEM of tumor volume (n=7; two-tailed unpaired t-tests). D, Experimental schema for D and E. E and F, Py230 cells transduced with doxycycline-inducible Sting1 shRNA were orthotopically injected into C57BL/6 female mice treated with vehicle (E) or doxycycline (F). Three days after starting doxycycline, mice were randomized for treatment with a mPD-L1 antibody or IgG1 isotype control. Bars represent the mean ± SEM (n=7; two-tailed unpaired t-tests). G, hPBMCs were inoculated into NOD/SCID female mice bearing established SUM159PT Tax-R tumors and randomized for treatment with 1) vehicle, 2) atezolizumab, 3) MYCi975, or 4) atezolizumab plus MYCi975. Tumor volumes were serially measured with calipers and monitored for 3 weeks. Data in middle panel represent the mean ± SEM of tumor volume over time. Bars (in right panel) represent the mean ± SEM of tumor volume at the end of the experiment (n=7; two-tailed unpaired t-tests). H, 4T1 WT cells were orthotopically injected into BALB/c female mice randomized for treatment with 1) vehicle, 2) mPD-L1 antibody, 3) MYCi975, or 4) mPD-L1 antibody plus MYCi975. Data in middle panel represent the mean ± SEM. tumor volume in mm3 over time. Bars (in right panel) represent the mean ± SEM of tumor volume in mm3 at the end of the experiment (n=7; two-tailed unpaired t-tests). I, Overall survival of BALB/c mice bearing 4T1 tumors (n=7/ group; logrank). J, Mechanism by which MYC drives immune-cold TNBCs via STING repression.

References

    1. Foulkes WD, Smith IE, Reis-Filho JS. Triple-negative breast cancer. N Engl J Med 2010;363(20):1938–48 doi 10.1056/NEJMra1001389. - DOI - PubMed
    1. Brown SD, Warren RL, Gibb EA, Martin SD, Spinelli JJ, Nelson BH, et al. Neo-antigens predicted by tumor genome meta-analysis correlate with increased patient survival. Genome Res 2014;24(5):743–50 doi 10.1101/gr.165985.113. - DOI - PMC - PubMed
    1. Wimberly H, Brown JR, Schalper K, Haack H, Silver MR, Nixon C, et al. PD-L1 Expression Correlates with Tumor-Infiltrating Lymphocytes and Response to Neoadjuvant Chemotherapy in Breast Cancer. Cancer Immunol Res 2015;3(4):326–32 doi 10.1158/2326-6066.CIR-14-0133. - DOI - PMC - PubMed
    1. Schmid P, Rugo HS, Adams S, Schneeweiss A, Barrios CH, Iwata H, et al. Atezolizumab plus nab-paclitaxel as first-line treatment for unresectable, locally advanced or metastatic triple-negative breast cancer (IMpassion130): updated efficacy results from a randomised, double-blind, placebo-controlled, phase 3 trial. Lancet Oncol 2020;21(1):44–59 doi 10.1016/S1470-2045(19)30689-8. - DOI - PubMed
    1. Mittendorf EA, Zhang H, Barrios CH, Saji S, Jung KH, Hegg R, et al. Neoadjuvant atezolizumab in combination with sequential nab-paclitaxel and anthracycline-based chemotherapy versus placebo and chemotherapy in patients with early-stage triple-negative breast cancer (IMpassion031): a randomised, double-blind, phase 3 trial. Lancet 2020;396(10257):1090–100 doi 10.1016/S0140-6736(20)31953-X. - DOI - PubMed

Publication types

MeSH terms