. 2022 Jun 9;185(12):2086-2102.e22.
doi: 10.1016/j.cell.2022.04.022. Epub 2022 May 12.

Disrupting autorepression circuitry generates "open-loop lethality" to yield escape-resistant antiviral agents

Affiliations

Disrupting autorepression circuitry generates "open-loop lethality" to yield escape-resistant antiviral agents

Sonali Chaturvedi et al. Cell. .

Erratum in

Abstract

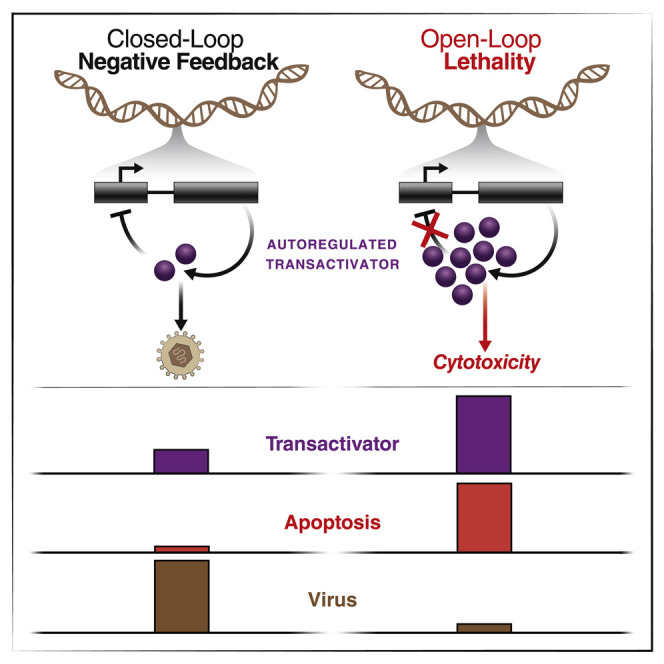
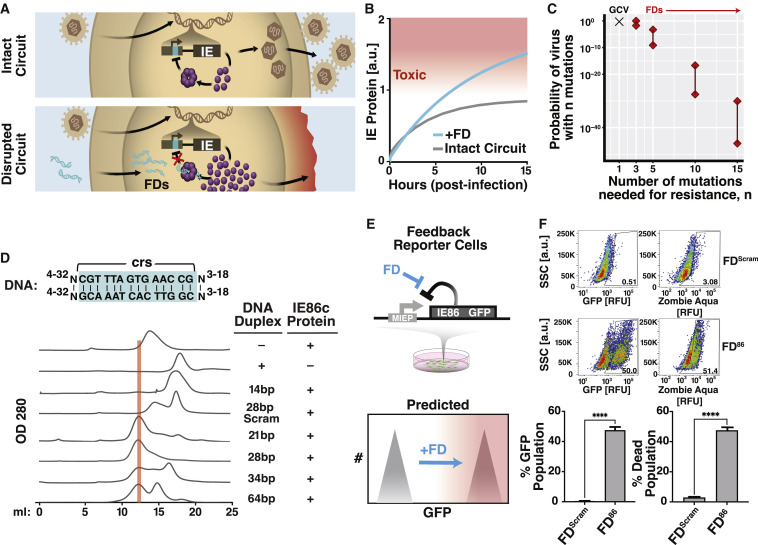
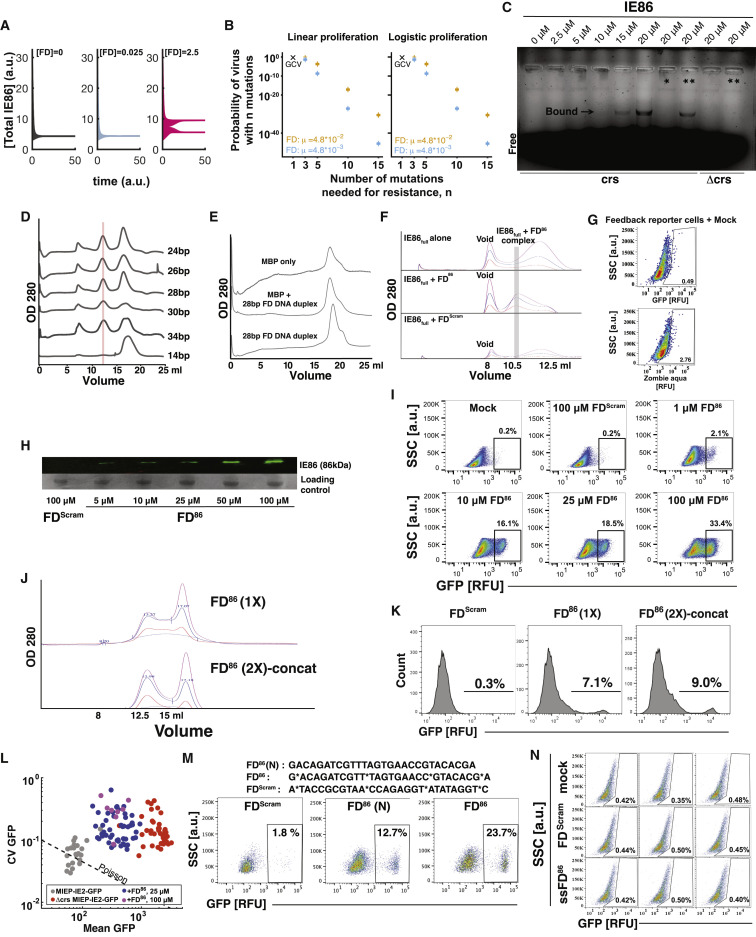
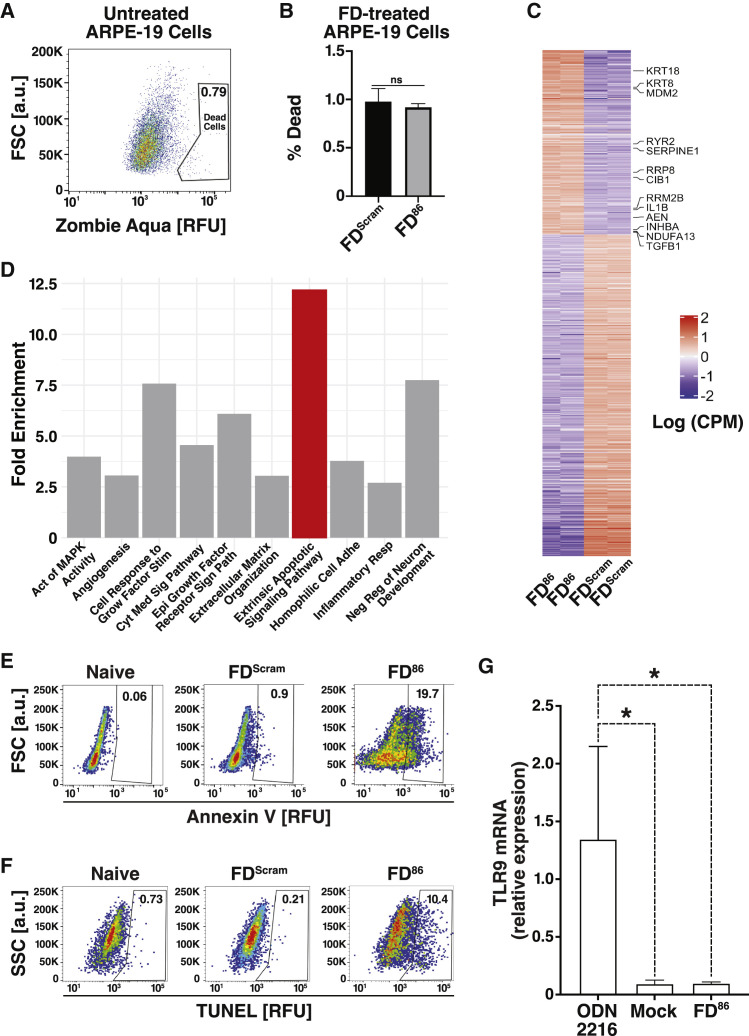
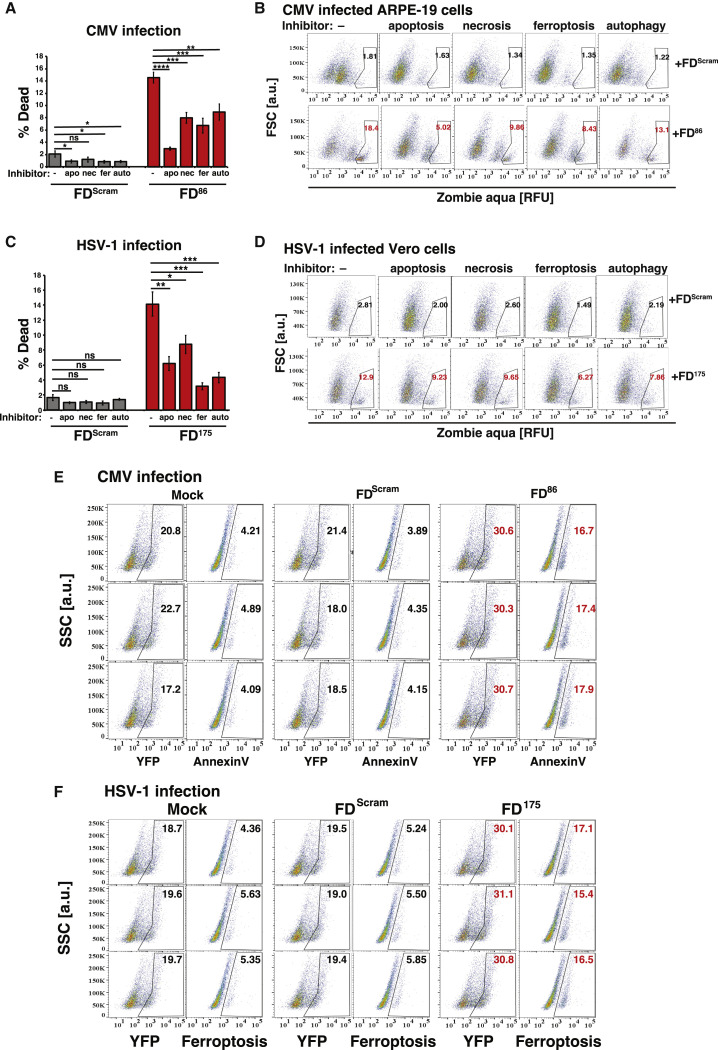
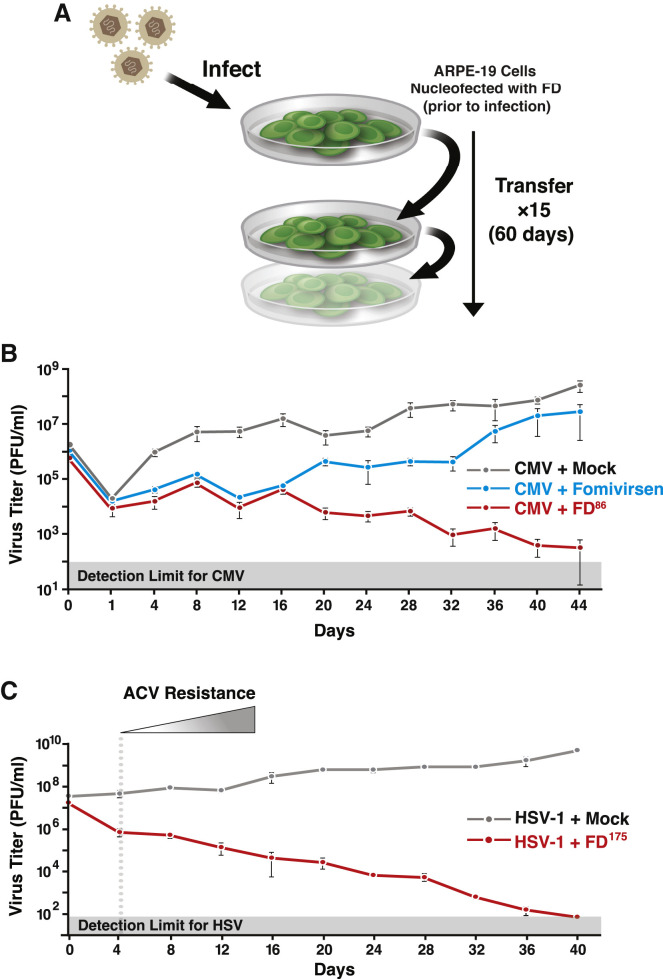
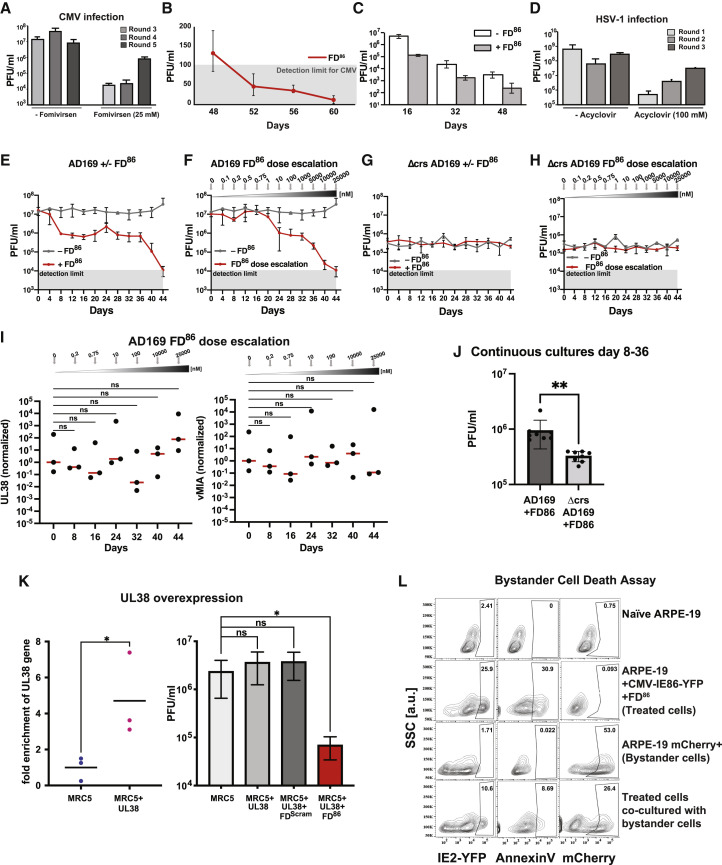
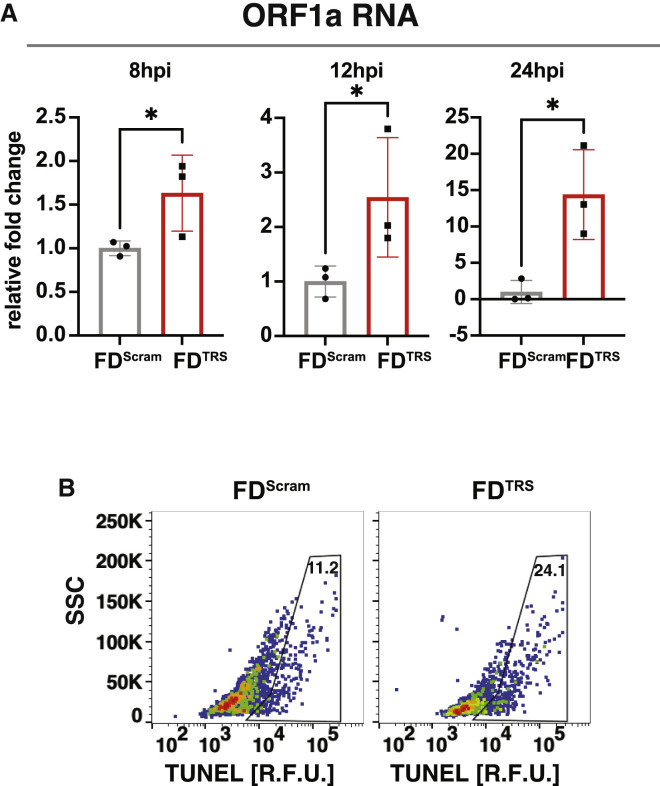
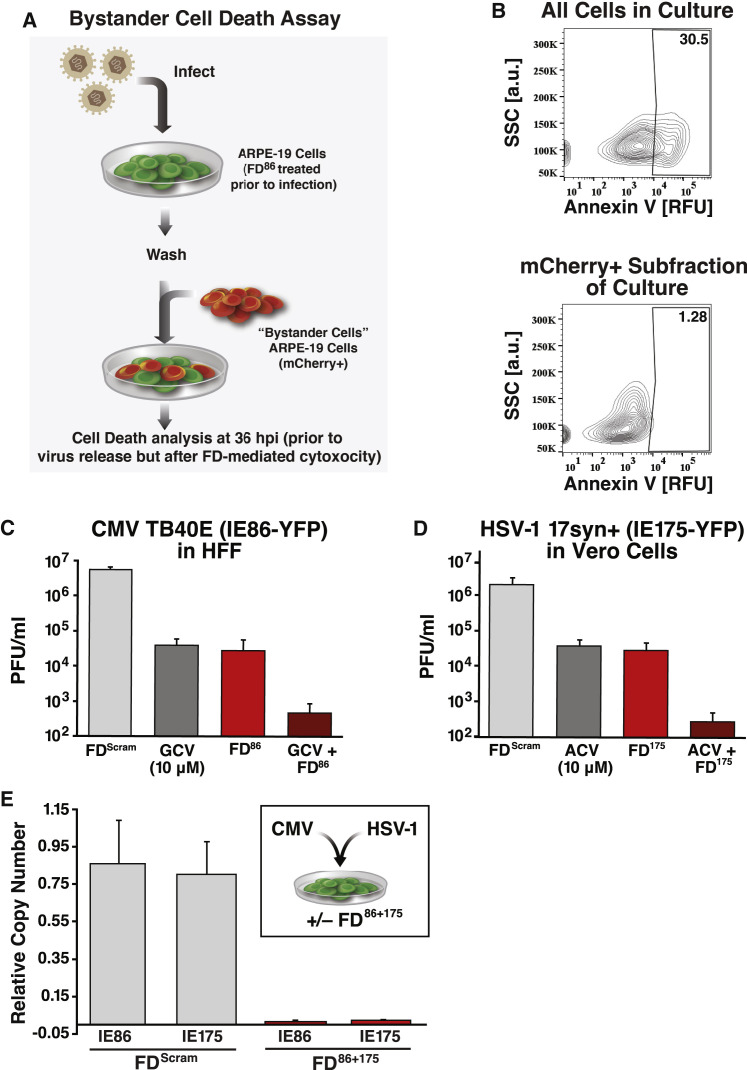
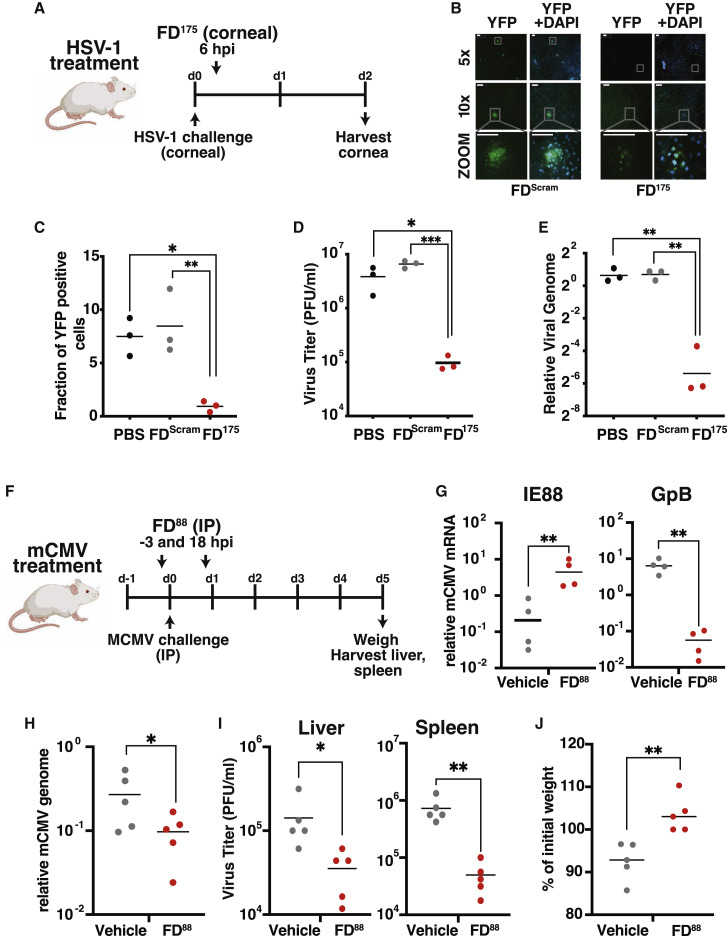
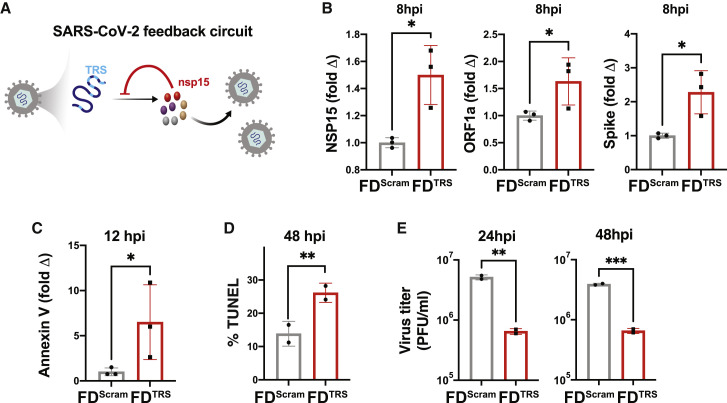
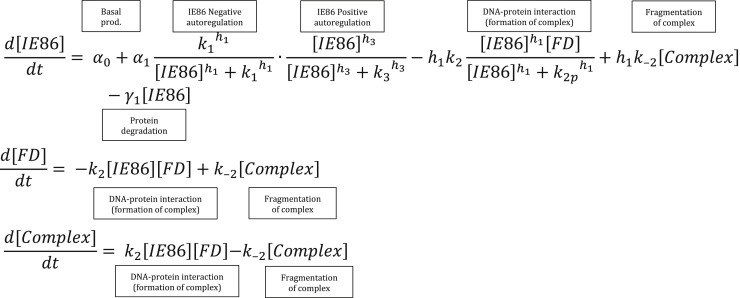
Across biological scales, gene-regulatory networks employ autorepression (negative feedback) to maintain homeostasis and minimize failure from aberrant expression. Here, we present a proof of concept that disrupting transcriptional negative feedback dysregulates viral gene expression to therapeutically inhibit replication and confers a high evolutionary barrier to resistance. We find that nucleic-acid decoys mimicking cis-regulatory sites act as "feedback disruptors," break homeostasis, and increase viral transcription factors to cytotoxic levels (termed "open-loop lethality"). Feedback disruptors against herpesviruses reduced viral replication >2-logs without activating innate immunity, showed sub-nM IC50, synergized with standard-of-care antivirals, and inhibited virus replication in mice. In contrast to approved antivirals where resistance rapidly emerged, no feedback-disruptor escape mutants evolved in long-term cultures. For SARS-CoV-2, disruption of a putative feedback circuit also generated open-loop lethality, reducing viral titers by >1-log. These results demonstrate that generating open-loop lethality, via negative-feedback disruption, may yield a class of antimicrobials with a high genetic barrier to resistance.

Keywords: autoregulatory circuit; feedback; nucleic acids; synthetic biology; transcriptional feedback; viral evolution.


Conflict of interest statement

Declaration of interests Competing interests: L.S.W. is an inventor of “Compositions and methods of use thereof for identifying antiviral agents” (US patent no. US10106817B2). L.S.W. and S.C. are inventors of “Compositions for herpesvirus transcriptional feedback circuit disruption and uses thereof” (US patent no. US2021/0395746A1).

Figures

None
Graphical abstract
Figure 1
Figure 1
Theory and biochemical identification of feedback disruptors that induce open-loop lethality (A) Schematics of the herpesvirus IE (IE86 and IE175) transcriptional negative-feedback circuits in the intact wild-type form (upper) and after disruption (lower) by putative feedback disruptors (FDs). When feedback is intact, IE proteins bind the cis-repression sequence (crs) in their respective IE promoters (cyan) and autorepress transcription. When feedback is disrupted (e.g., by titrating IE proteins with free crs-encoding DNA), the IE promoter is not autorepressed, and IE proteins reach cytotoxic levels. (B) Computational modeling showing that FDs can effectively break feedback to increase IE protein levels. (C) Probability of a drug-resistant CMV variant arising during the course of therapy. If only 1–2 mutations generate resistance (e.g., for GCV), the probability of resistance is 70%–100%. For three mutations, resistance becomes unlikely, and for >5 mutations, the probability becomes negligibly small. Uncertainties in probabilities (lines between diamonds) arise from the uncertainty in the mutation rate, drug efficacy, and dynamics of target cell proliferation. (D) Top: schematic of different lengths of DNA duplexes tested for catalyzing homo-multimerization of the IE86 C terminus fragment protein (IE86C). Bottom: chromatographs of IE86C incubated with either a sequence-scrambled control or crs-containing DNA duplexes of differential lengths. A 28-bp crs-encoding duplex most efficiently titrates free IE86 protein from the 15 mL fraction into the 13 mL fraction (protein-DNA homomultimer fraction) with ∼98% of protein found in the 13-mL protein-DNA complex fraction in presence of the 28-bp duplex. (E) Schematic of the minimal IE negative-feedback circuit (MIEP-IE86-IRES-GFP) stably expressed in ARPE-19 cells (“feedback-reporter cells”) and illustration of the effect of negative-feedback disruption on GFP fluorescence and cell viability. (F) Representative flow cytometry plots of feedback-reporter cells after nucleofection with 28-bp DNA duplex encoding crs (FD86) or a scrambled 28-bp DNA duplex (FDScram). GFP expression analyzed at 48-h post-nucleofection; cell-death analyzed by Zombie Aqua at 96-h post-nucleofection. Mean ± 1 SD shown, n = 3 biological replicates. p values derived from Student’s t test: ∗∗∗∗ < 0.0005. See also Figure S1.
Figure S1
Figure S1
Simulations and in vitro analyses of FD DNA duplexes, related to Figure 1 (A) Numerical simulations of an experimentally validated ordinary differential equation (ODE) model of the major immediate early circuit of CMV (Teng et al., 2012) modified to include FDs as described in STAR Methods for three different FD dosages [0, 0.025, and 2.5] and heterogenous initial IE86 levels. All other parameters are kept constant. (B) Parameter sensitivity analysis for the within-host CMV model of FD resistance. Two models of cell proliferation were tested across a range of parameter combinations (STAR Methods). Each “+” represents the predicted probability of resistance from a simulation using a particular parameter combination. Multiple overlapping “+”s (e.g., when the number of mutations n and the mutation rate μ are kept constant) indicate that the predicted risk of resistance is insensitive relative to other parameters (e.g., drug efficacy). (C) Electrophoresis mobility shift assays (EMSA) verifying that the C terminus of IE86 specifically interacts with crs-containing DNA duplexes. Digoxigenin (DIG)-labeled DNA duplex probes of the crs and Δcrs sequences, as previously described (Asmar et al., 2004), were used for binding and detection. EMSA was performed after incubating DIG-labeled DNA probes with increasing concentrations of IE86 protein (0 μM to 20 μM) for 30 min at room temperature (lanes 1–6). To determine whether the IE86-crs interaction was sequence specific, either 20-fold of unlabeled crs DNA duplex () was added (lane 7) or 20-fold unlabeled Δcrs DNA duplex (∗∗) was added (lanes 8 and 10). (D) crs-encoding DNA duplexes ranging from 20 to 30 bp efficiently catalyze IE86 homomultimer formation. Size-exclusion chromatography of mixtures of DNA duplexes of different lengths (as indicated) with C terminus of IE86 protein. The IE86 homomultimer protein-DNA complex elutes at ∼13-mL column volume (red bar). (E) Size-exclusion chromatography of maltose-binding protein (MBP) together with FD86 indicates that MBP does not oligomerize in the presence of FD86, thereby excluding an MBP-mediated protein-DNA interaction. (F) Size-exclusion chromatography of purified full-length IE86 protein shows that FD86 efficiently catalyzes IE86 oligomerization, eluting at ∼11-mL column volume. (G) Mock nucleofection of the IE86 feedback-reporter cell line. (H) Top: quantitative (LICOR™) western blot analysis of IE86 from cell lysates of the IE86 feedback-reporter cell line at 2 days post-nucleofection of the crs-containing 28-bp DNA duplex; bottom: Coomassie blue loading control for western blot. (I) Flow cytometry analysis of the IE86 feedback-reporter cell line after nucleofection with increasing doses of the crs-containing 28-bp DNA duplex and 100 μM of the sequence-scrambled 28-bp DNA duplex control analyzed at 3 days post-nucleofection (SSC, side scatter). We note that the efficiency of nucleofection is <100%, which manifests as an apparent bimodality. (J) Size-exclusion chromatography of purified IE86C (N terminus tagged with MBP) incubated with the 28-bp crs-encoding DNA duplex containing one crs sequence (FD 1 ×) or two concatenated crs sequences (FD 2× -concat) for 30 min at room temperature (see Table S1 for FD sequences). Oligomerized fraction (% absorbance at ∼13mL fraction at OD280) was compared for both the samples. (K) Flow cytometry analysis of IE86 feedback-reporter cells 2 days post-nucleofection with 25 μM of either FD 1 ×, or FD 2× -concat, or the control sequence-scrambled DNA duplex (FDScram). (L) Quantification of feedback strength by gene-expression fluctuation (noise) analysis from single-cell time-lapse imaging. Each data point represents one cell. Feedback-reporter cells (n = 22), broken-feedback-reporter cells (Δcrs) (n = 42), and FD86-nucleofected feedback-reporter cells (25 μM, n = 49; 100 μM, n = 8) were imaged over 48 h. Single-cell imaging traces were analyzed by calculating the coefficient of variation (CV) and the mean of GFP expression for each individual cell. The expected noise obtained without disrupting feedback is given by the Poisson curve. Each dot represents one single-cell imaging trace. (M) Phosphorothioation of feedback-disruptor DNA duplexes: flow cytometry dot plots of IE86 feedback-reporter cells 4 days post-nucleofection with 25 μM of either a 28-bp crs-encoding DNA duplex (FD86) containing four phosphorothioate bonds, a 28-bp sequence-scrambled DNA duplex (FDScram) also containing four phosphorothioate bonds, or a nonphosphorothioated version of FD86. (N) Flow cytometry analysis of IE86 feedback-reporter cells 2 days post-nucleofection with 25 μM of a single-stranded 28mer crs-encoding oligonucleotide (ssFD86) containing four phosphorothioate bonds as compared with the sequenced-scrambled 28-bp DNA duplex also containing four phosphorothioate bonds (FDScram) in triplicate.
Figure 2
Figure 2
Disruption of viral transcriptional feedback generates open-loop lethality without activating innate immune responses (A and B) Cell viability analysis by flow cytometry after nucleofecting naive ARPE-19 cells with FD duplexes. (C) RNA-seq heatmap of differentially enriched genes after nucleofecting feedback-reporter cells with FD86 or FDScram in biological duplicate. Six hundred and forty nine differentially enriched genes depicted; specific genes within apoptotic pathways listed. (D) Pathway gene ontology (GO) enrichment analysis. The top ten most enriched pathways as analyzed in David are plotted. (E and F) Apoptosis analysis by flow cytometry after nucleofecting feedback-reporter cells with FD duplexes, showing apoptosis by annexin V and TUNEL staining. (G) qRT-PCR analysis of TLR9 expression 48 h after induction with a CpG-rich TLR agonist (ODN 2216) or FD duplexes. Error bars represent mean ± 1 SD, n = 3 biological replicates. p values derived from Student’s t test:  < 0.05; ns, non-significant. See also Figure S2.
Figure S2
Figure S2
RNA-seq analysis, related to Figure 2 (A) Heatmap showing the logCPM (log counts per million) values for clusters of differentially expressed genes from RNA-seq of cells nucleofected with either FD86 or FDScram (biological duplicates shown for each condition). The clusters are numbered on the left side of the plot, and the sample IDs are indicated at the bottom. (B) Differentially expressed genes clustered by the logCPM values of FD and FDScram samples. Cluster 4 is a set of upregulated genes with enrichment of GO terms related to cell migration, endocytosis, and apoptosis. Analysis for other clusters not presented due to <100 genes. The y axis shows the enriched terms, and the x axis shows GeneRatio (the fraction of genes associated with a term that were among the genes in this cluster). The sizes of the data point represent the number of genes in the cluster associated with the respective term and the colors represent the FDR-adjusted p values. The apoptotic signaling pathway term is high in GeneRatio and Gene Count with an adjusted p value < 0.05. (C) 25 genes enriched by FDScram treatment. The four genes that are also enriched in FD86-treated cells are marked with an asterisk. (D) Specific genes with GO terms associated with inflammation that are enriched in cells overexpressing IE86 (FD86 treated).
Figure S3
Figure S3
FD duplexes in the context of CMV infection, related to Figure 3 (A) Flow cytometry dot plots of naive or FD86-nucleofected ARPE-19 cells after infection with CMV TB40E-IE86-YFP (MOI = 0.1) showing no reduction in the percentage of infected IE86 expressing cells. Cells were infected 24 h after nucleofection with FD86 and were analyzed at 4 hpi (hours post infection). (B) Viral entry assay. Fluorescent micrographs of HFF cells (nucleofected ± FD86), then infected with CMV TB40E-IE86-YFP, imaged at 2 hpi (MOI = 5), and stained for viral pp65 protein (red, 594 nm) and DAPI (blue, 405 nm). (C) Schematic of the Δcrs CMV virus with a disrupted IE86-feedback circuit due to a 3-bp mutation in the crs. (D) FD86 does not reduce Δcrs virus replication. Cells (human foreskin fibroblast, HFF) were nucleofected with 25 μM FD86 (or FDScram) and 24 h post-nucleofection infected with parent AD169 CMV virus or Δcrs AD169 CMV mutant virus (MOI = 0.1) and then titered (4 dpi for parent virus and 6 dpi for Δcrs virus due to its slower growth). (E) FD86 does not increase IE86 levels in Δcrs infected cells. Fluorescent micrographs of HFF cells infected with Δcrs virus in the presence of FDScram or FD86 (6 dpi). (F) FDs do not act through the cGAS-STING pathway. ARPE-19 (low cGAS-STING activity) and MRC-5 cells (high cGAS-STING activity) were nucleofected with 25 μM FD86 or mock and infected with CMV TB40E-IE86-YFP or AD169 (MOI = 0.1), respectively. Virus titers were assayed by TCID-50 at 4 dpi. (G) FD86 interferes with replication of ganciclovir-resistant (GCVR) and foscarnet-resistant (FOSR) CMV strains. MRC-5 cells were nucleofected with 25 μM FD86 or FDScram and 24 h later were infected with either parent CMV AD169 (control) or GCVR or FOSR strains (CMV GDGrK17, CMV GDGrP53, CMV 759rD100-1, CMV PFArD100) at MOI = 0.1. Virus titers were assayed by TCID-50 at 4 dpi. (H) Sequence homology for the crs of human CMV, murine CMV (mCMV), and rhesus CMV (RhCMV); green represents sequence homology, whereas red represents divergence. (I) FDmCMV interferes with mCMV replication. NIH 3T3 mouse fibroblast cells were nucleofected with either 25 μM FDmCMV, FDScram, or mock nucleofected 24 h prior to mCMV infection at MOI = 0.1. At 4 dpi, virus titers were assayed by TCID-50 on 3T3 cells. (J) FDRhCMV interferes with RhCMV replication. Telo-RF cells were nucleofected with either 25 μM FDRhCMV or (FDScram/mock) and infected with RhCMV (RhCMV 68.1 GFP) at MOI = 0.1. Virus titers were assayed by TCID-50 at 4 dpi. (K) Live-dead analysis; left: flow cytometry analysis of ARPE-19 cells in the absence or presence of 100 μM FD175 stained with Zombie Aqua at 4 dpi; right: quantification of % Zombie Aqua positive cells from the flow plots. (L) Live-dead analysis; left: Flow cytometry plots of ARPE-19 cells in the absence or presence of 100 μM FD86 + 10 μM of ganciclovir stained with Zombie Aqua at 4 dpi; right quantification of % Zombie Aqua positive cells from the flow plots.
Figure 3
Figure 3
Open-loop lethality generates an antiviral effect against diverse herpesviruses (A) Flow cytometry analysis showing that feedback disruption generates IE86 overexpression in CMV-infected cells. ARPE-19 cells were nucleofected with 25 μM FD86 or FDScram, then 24 h later infected with CMV (TB40E) encoding an IE86-YFP fusion (MOI = 0.1), and analyzed at 2 days postinfection (dpi). (B) Micrographs of YFP fluorescence in ARPE-19 cells at 24 h postinfection with TB40E-IE-YFP treated with FD86 or FDScram (MOI = 1.0). Scale bar, 200 μm. (C) FD86 dose-response curve and corresponding IC50 value. ARPE-19 cells were nucleofected with FD86 at the concentration specified, infected with TB40E-IE86-YFP virus (MOI = 0.1), and virus titered 4 dpi (error bars represent mean ± 1 SD, n = 3 biological replicates). (D) Antiviral effect of FD86 on CMV. ARPE-19 cells were nucleofected with 25 μM FD86 (or mock/FDScram), and 24-h post-nucleofection, cells were infected with TB40E-IE86-YFP virus at different MOIs (0.1, 0.5, 1.0, 2.0), and titered at 4 dpi (error bars represent mean ± 1 sd, n = 3 biological replicates). (E) Apoptosis induction in CMV-infected cells: ARPE-19 cells were nucleofected with 25 μM FD86 (or mock/FDScram), 24 h later infected with TB40E-IE86-YFP virus (MOI = 1), and at 48 hpi stained for annexin V and analyzed by flow cytometry. (F) Feedback disruption leads to IE175 overexpression in HSV-1-infected cells. ARPE-19 cells were nucleofected with 25 μM FD175 or FDScram (or mock), then 24 h later infected with HSV-1 (17syn+ strain) encoding an IE175-YFP (MOI = 0.1), and analyzed at 2 dpi. (G) Micrographs of YFP fluoresence in Vero cells 12 h postinfection with 17syn+ IE175-YFP (MOI = 1.0) and treated with FD175 or FDScram. Scale bar, 200 μm. (H) FD175 dose-response curve and corresponding IC50 values. Titers were calculated on Vero cells nucleofected with FD175 at the concentration indicated, infected with HSV-1 IE175-YFP (17syn+ strain, MOI = 0.1) 24 h later, and titered 2 dpi (error bars represent mean ± 1 sd, n = 3 biological replicates). (I) Antiviral effect of FD175 on HSV-1. Vero cells were nucleofected with 25 μM FD175 (or mock/FDScram), and 24 h post-nucleofection, cells were infected with HSV-1 (17syn+ strain) at different MOIs (0.1, 0.5, 1.0, 2.0), and titered at 4 dpi (error bars represent mean ± 1 SD, n = 3 biological replicates). (J) Ferroptosis induction in HSV-infected Vero cells. Cells were nucleofected with 25 μM FD175 (or mock/FDScram) and then 24 h later, infected with HSV-1 (17syn+ strain) IE175-YFP (MOI = 1), and at 24-hpi cells, were harvested, stained with a ferroptosis marker (BODIPY C11), and analyzed by flow cytometry. p values derived from Student’s t test: ns, non-significant, ∗∗ < 0.01. See also Figures S3, S4, and S5.
Figure S4
Figure S4
FD duplexes in the context of HSV-1 infection, related to Figure 3 (A) Flow cytometry dot plots of naive or FD175-nucleofected ARPE-19 cells after infection with HSV-1 strain 17syn+ IE175-YFP (MOI = 0.1). Cells were infected 24 h post-nucleofection with FD175 and analyzed at 4 hpi. The uninfected control is the same as in Figure S3A. (B) Fluorescent micrographs of Vero cells (nucleofected ± FD175), then infected with HSV-1 17syn+ IE175-YFP, imaged at 1 hpi (MOI = 20), and stained for ICP5 protein (red, 594 nm) and DAPI (blue, 405 nm). (C) Flow cytometry live-dead analysis using Zombie Aqua of uninfected (naive) Vero cells (i.e., control) showing gating for dead cells. Dead cell gate was drawn by comparing with HSV-1-infected Vero cells in Figure S5D (left-most column). Percentage of dead cells is <1%. (D) Uninfected Vero cells nucleofected with FDScram or FD175 (mean of biological triplicates shown); nucleofection of FD175 does not generate significant increases in dead cells compared with nucleofection of FDScram control. (E) FD175 interferes with HSV-1 (KOS strain) replication. Vero cells were nucleofected with either 25 μM FD175 (or mock/FDScram) and 24 h later were infected with HSV-1 (KOS strain) at MOI = 0.1, then virus quantified by TCID-50 at 4 dpi. (F and G) Absence of nonspecific antiviral effects. (F) Vero cells were nucleofected with 25 μM FD86 or FDScram and infected with HSV-1 (17syn+ strain IE175-YFP virus, MOI = 0.1), followed by quantification of virus titer 4 dpi by TCID50. (G) ARPE-19 cells were nucleofected with 25 μM FD86 or FDScram and infected with CMV (TB40E-IE86-YFP MOI = 0.1), followed by quantification of virus titer 4 dpi by TCID50. (H) Left: flow cytometry plots of naive Vero cells or in the presence of 100 μM FD175 stained with Zombie Aqua stain at 4 dpi; right: quantification of % Zombie Aqua positive cells from the flow plots. (I) Left: flow cytometry plots of naive Vero cells or in the presence of 100 μM FD175 + 10μM of acyclovir stained with Zombie Aqua stain at 4 dpi; right: quantification of % Zombie Aqua positive cells from the flow plots.
Figure S5
Figure S5
FD duplexes induce cytotoxicity by crosstalk between cell-death pathways, related to Figure 3 (A and B) (A) Bar graph quantification and (B) flow cytometry plots of the cell-death “rescue” assay. FD86 induces apoptosis in CMV-infected cells. ARPE-19 cells were nucleofected with 25 μM FD86 (or mock/FDScram) and at 24 h later infected with CMV (TB40E-IE86-YFP, MOI = 0.1) in the presence of the indicated cell-death inhibitors: auto (autophagy inhibitor); apo (apoptosis inhibitor); nec (necroptosis inhibitor); fer (ferroptosis inhibitor). Cells were harvested at 48 hpi, stained for dead cells with Zombie Aqua (BioLegend, Cat# 423101), and analyzed by flow cytometry. Experiment performed in three biological replicates. p values were calculated using two-way ANOVA followed by Tukey’s multiple comparisons test. (C and D) (C) Bar graph quantification and (D) flow cytometry plots of the cell-death “rescue” assay. FD175 induces ferroptosis in HSV-infected cells. Vero cells were nucleofected with 25μM FD175 (or mock/FDScram), then 24 h later infected with HSV-1 (17syn+ strain) IE175-YFP virus (MOI = 0.1) in the presence of the indicated cell-death inhibitors: auto (autophagy inhibitor); apo (apoptosis inhibitor); nec (necroptosis inhibitor); and fer (ferroptosis inhibitor). Cells were harvested at 24 hpi, stained for dead cells with Zombie Aqua (BioLegend, Cat# 423101), and analyzed by flow cytometry. Experiment performed in three biological replicates. p values were calculated using two-way ANOVA followed by Tukey’s multiple comparisons test. (E) Triplicate repeats of FD-treated CMV-infected ARPE-19 cells stained with apoptosis marker. ARPE-19 cells were nucleofected with 25 μM FD86 (or mock/FDScram); 24 h later, cells were infected with CMV (TB40E) IE86-YFP virus (MOI = 1) and at 48 h post infection stained with annexin V. (F) Triplicate repeats of HSV-1 infected Vero cells stained for ferroptosis (BODIPY C11) in the presence of FDs. Vero cells, which were nucleofected with 25 μM FD175 (or mock/FDScram), were infected with HSV-1 IE175-YFP (17syn+ strain) at MOI = 1 at 24 h post-nucleofection. At 24 hpi, cells were harvested and stained.
Figure 4
Figure 4
Open-loop lethality exhibits a high genetic barrier to the evolution of resistance (A) Schematic of the continuous-culture experiment. ARPE-19 cells (±FD) were infected, and at 4 dpi, supernatant was collected and was used to infect naive ARPE-19 cells (±FD) until day 60. (B) Continuous-culture titers for CMV (TB40E-IE86-YFP) in the presence of FD86 (red), fomivirsen (blue), or mock treatment (gray). Fomivirsen resistance (positive slope of the titering dynamics) was observed beginning at day 12 (Figure S6A). (C) Continuous culture for HSV-1 (17syn+ IE175-YFP) in the presence of 25 μM FD175 (red) or mock treatment (gray). ACV resistance (positive slope of the titering dynamics) is observed beginning at day 4 (Figure S6D). All plots show mean ± 1 SD, n = 3 biological replicates. See also Figure S6.
Figure S6
Figure S6
Evolution of resistance to existing antivirals; FD duplexes do not induce cell death in uninfected bystander cells, related to Figures 4 and 5 (A) Outgrowth of fomivirsen-resistant virus in continuous culture. Viral titers from rounds 3–5 of continuous cultures ±25 μM fomivirsen (no dose escalation was used). Positive slope in titers in presence of fomivirsen is observed beginning at round 3 of infection. (B) Verification that FD86 decreases CMV titers below detection; subculturing of supernatants from continuous culture. We used the established TCID50 calculation described previously (Reed, 1938). This calculation computes both the TCID50/ml and a single-well detection limit from the initial dilution and titration factor. Because there are multiple replicates (in this case eight replicate wells) and the statistics are Boolean, it is possible to reliably calculate TCID50/ml values below the single-well detection limit for the entire row of eight wells. (C) Fitness recovery assay: analysis of FD86-treated continuous cultures upon removal of FD86. Supernatants from continuous cultures on indicated days were cultured on ARPE-19 cells ± FD86. Titers recover 1.5–2 logs upon removal of FD86. (D) HSV-1 resistance to acyclovir (ACV). Viral titers of ARPE-19 cells infected with HSV-1 (strain 17syn+ IE175-YFP; MOI = 1) ±100μM ACV (no dose escalation used) and supernatant transferred every 2 days over three consecutive rounds of infection. Virus titers were assayed by TCID-50 every 2 days post transfer; a positive slope in the titers (i.e., outgrowth of ACV-resistant virus) is evident despite 100 μM ACV. (E and F) Continuous cultures of AD169 either without FD86, with 25 μM FD86, or with FD86 dose escalation. (G and H) Continuous cultures of Δcrs AD169 either without FD86, with 25 μM FD86, or with FD86 dose escalation. (I) No evidence of escape through increasing expression of UL38 or vMIA. qRT-PCR of UL38 and vMIA (normalized to beta-actin) from the AD169 continuous cultures with FD86 dose escalation. Significance tests were carried out using a one-way ANOVA with Dunnet’s test for multiple comparisons. (J) The AD169 strain sustains greater fitness than the Δcrs AD169 strain does over multiple weeks of FD86 treatment in continuous culture. Data points from day 8 to 36 in (E) and (G) were compared. Significance was determined by Student’s t test, ∗∗ < 0.01. (K) UL38 overexpression does not rescue CMV from FD-induced open-loop lethality. MRC5 cells were nucleofected with a UL38 expression vector (and either mock/FDScram/FD86), then 24 h later, infected with CMV and titered at 4 dpi. (L) Flow cytometry viability analysis of uninfected neighboring “bystander” cells. ARPE-19 cells were nucleofected with 25 μM FD86, and 24 h post-nucleofection, cells were infected with CMV TB40E-IE86-YFP (MOI = 0.5). At 2 hpi, cells were washed twice in PBS to remove any attached virus and co-cultured with naive mCherry-expressing ARPE-19 cells (“bystanders”). Cells were analyzed by flow cytometry at 36 hpi (i.e., once FD-mediated cytotoxicity was present but prior to virus release).
Figure S7
Figure S7
FDTRS decoys in the context of SARS-CoV-2 infection, related to Figure 7 (A) qRT-PCR analysis for ORF1a expression fold-change at 8, 12, and 24 hpi; Vero cells were nucleofected with 25 μM FDTRS or FDScram and then infected with SARS-CoV-2 (WA-1 strain, MOI = 0.05). (B) Raw flow cytometry dot plots for apoptosis analysis at 48 hpi by TUNEL assay; Vero cells were nucleofected with 25 μM FDTRS or FDScram and then infected with SARS-CoV-2 (WA-1 strain, MOI = 0.05).
Figure 5
Figure 5
Open-loop lethality does not lead to bystander killing and enables combinatorial therapeutic approaches (A and B) Schematic of bystander cell-death assay and flow cytometry analysis. (C) Virus titer for CMV in the presence of FDScram, GCV (10 μM), FD86, or FD86 with GCV in HFF cells at 4 dpi. (D) Virus titer for HSV-1 in the presence of FDScram, ACV (10 μM), FD175, or FD175 with ACV in Vero cells at 2 dpi. (E) Multiplexed feedback disruption can inhibit CMV and HSV-1 replication. Inset: schematic of the mixed-infection experiment. Main panel: qPCR analysis of CMV and HSV-1 viral genomes in a mixed-infection experiment at 4 dpi. All error bars show mean ± 1 SD, n = 3 biological replicates. See also Figure S6.
Figure 6
Figure 6
In vivo antiviral efficacy of open-loop lethality (A) Schematic of the HSV-1 corneal infection model in mice. Mice undergo corneal debridement followed by infection with HSV-1 (17syn+ IE175-YFP). At 6 hpi, FD175, FDScram, or PBS was topically applied to the cornea. Corneas were harvested at 2 dpi for analysis. (B) YFP fluorescence images of corneas after harvesting (nuclei stained with DAPI). Scale bars, 100 μm. (C) Quantification of HSV-1 YFP expressing cells in corneas. Five corneas imaged per sample. (D) HSV-1 viral titers from infected corneas 2 days post-treatment with PBS, FDScram, or FD175. Each data point represents a pooling of corneas (i.e., nine corneas per treatment). (E) HSV-1 viral genomic DNA quantification by qPCR 2 days post-treatment. Each data point represents a pooling of corneas (i.e., nine corneas per treatment). (F) Schematic of the mCMV systemic infection model in mice. Mice were infected with 105 PFU mCMV and injected intraperitoneally with FD88 (n = 5) on gold nanoparticles or a vehicle control (n = 5) at 3 h pre- and 18 h post infection. At 5 dpi, liver and spleen were harvested for analysis. (G) Quantification of viral IE88 and GpB mRNA by qRT-PCR in FD88-treated or vehicle control-treated samples. (H) qPCR quantification of mCMV replication by DNA genome copy number in FD88 or vehicle-treated samples. (I) Infectious virus titer quantified by TCID-50 from animals treated with FD88 or vehicle control. p values derived from Student’s t test: <0.05, ∗∗<0.01, ∗∗∗<0.001.
Figure 7
Figure 7
Open-loop lethality generates an antiviral effect against SARS-CoV-2 (A) Schematic of the putative SARS-CoV-2 transcriptional negative-feedback circuit. Nsp15 proteins, which are transcribed from a sub-genomic RNA, cleave genomic RNAs (gRNAs) at the transcriptional regulatory sequences (TRS), thereby suppressing genomic and sub-genomic RNA levels. Feedback can be disrupted by supplying excess TRS encoding RNAs (FDTRS) as decoys to titrate nsp15, thereby leading to the accumulation of genomic RNAs and increased synthesis of non-structural, structural, and accessory proteins, including cytotoxic viral proteins above cytotoxic levels. (B) Vero cells were nucleofected with 25 μM FDTRS or FDScram, followed by infection with SARS-CoV-2 (WA-1 strain, MOI = 0.05) and quantification of nsp15, ORF1a, and Spike RNA by qRT-PCR within the first round of replication (i.e., 8 hpi). (C) Apoptosis analysis at 12 hpi by qRT-PCR for annexin V. (D) Apoptosis analysis at 48 hpi by TUNEL assay. (E) Virus titer for SARS-CoV-2 after treatment with either FDTRS or FDScram. p values derived from Student’s t test: <0.05, ∗∗<0.01, ∗∗∗<0.001. See also Figure S7.
None

Comment in

Similar articles

Cited by

References

    1. Adams D., Gonzalez-Duarte A., O’Riordan W.D., Yang C.-C., Ueda M., Kristen A.V., Tournev I., Schmidt H.H., Coelho T., Berk J.L., et al. Patisiran, an RNAi Therapeutic, for Hereditary Transthyretin Amyloidosis. N Engl J Med. 2018;379:11–21. doi: 10.1056/NEJMoa1716153. - DOI - PubMed
    1. Alon U. Chapman & Hall/CRC; 2007. An introduction to systems biology: Design principles of biological circuits.
    1. Alon U., Surette M.G., Barkai N., Leibler S. Robustness in bacterial chemotaxis. Nature. 1999;397:168–171. - PubMed
    1. Aoki S.K., Lillacci G., Gupta A., Baumschlager A., Schweingruber D., Khammash M. A universal biomolecular integral feedback controller for robust perfect adaptation. Nature. 2019;570:533–537. - PubMed
    1. Arago, M. (1840). History of the steam engine, with a reply to the Criticisms to which the first publication of the article gave rise. Blasco de garay 1615, Solomon de Caus 1629. Sir Samuel Morland. Branca 1663. The Marquis of Worcester 1683. Denis Papin 1698, A.A. Lieut, and U.S.N. Harwood, translators 120 years B. C. Hiero of Alexandria 1543, p. 1690 and 1695. Captain Savery. (1705). Newcomen, Cawley, and Savery. Journal of the Franklin Institute, of the State of Pennsylvania, for the Promotion of the Mechanic Arts; Devoted to Mechanical and Physical Science, Civil Engineering, the Arts and Manufactures, and the Recording of American and Other Patent Inventions (1828-1851) 25, 3.

Publication types

Substances