. 2022 May 13;13(1):2559.
doi: 10.1038/s41467-022-30257-z.

MYC drives aggressive prostate cancer by disrupting transcriptional pause release at androgen receptor targets

Affiliations

MYC drives aggressive prostate cancer by disrupting transcriptional pause release at androgen receptor targets

Xintao Qiu et al. Nat Commun. .

Abstract

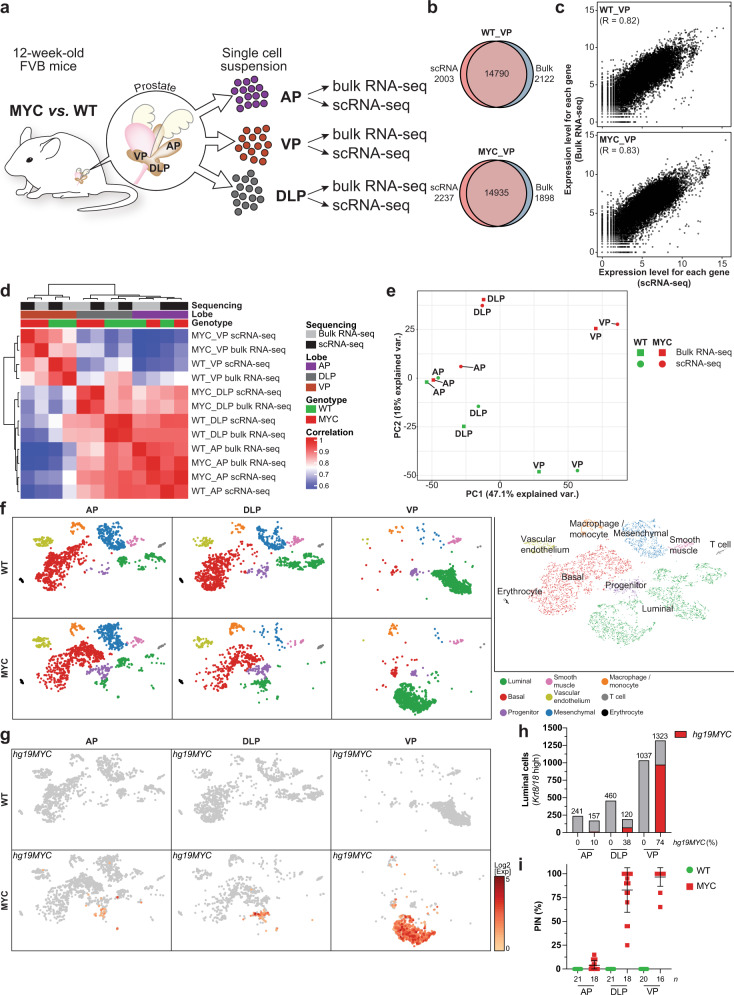
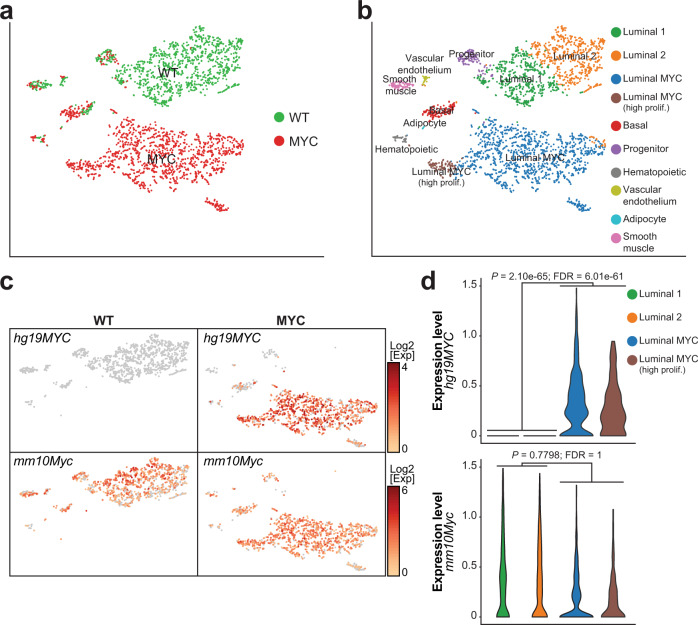
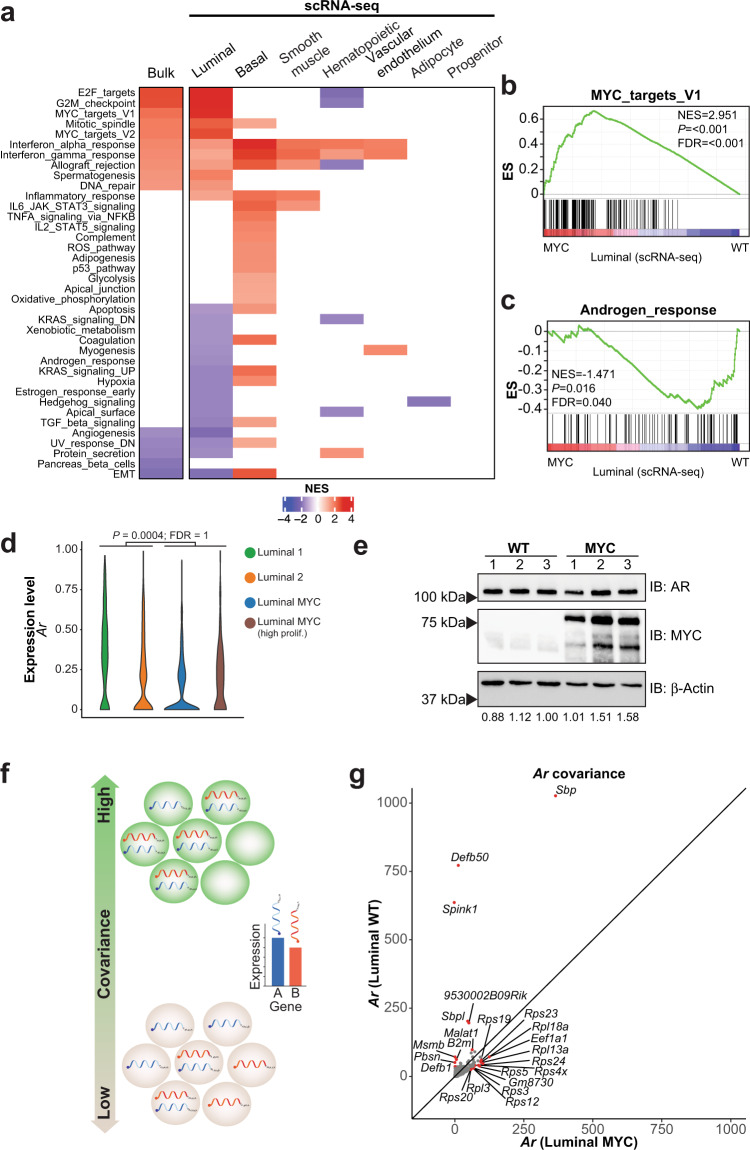
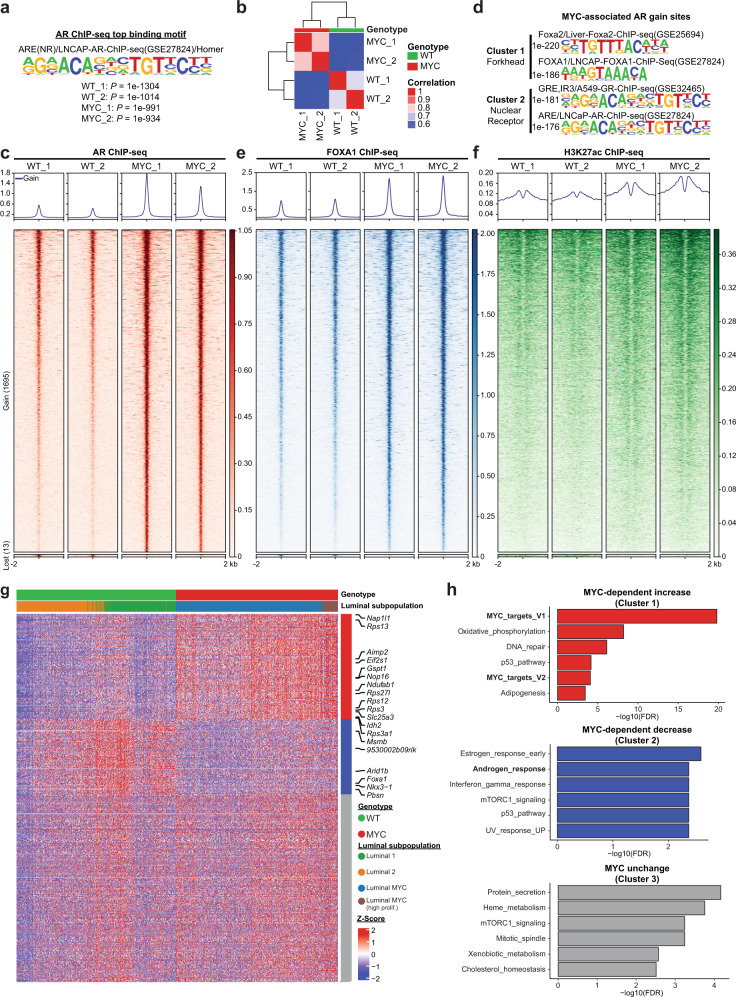
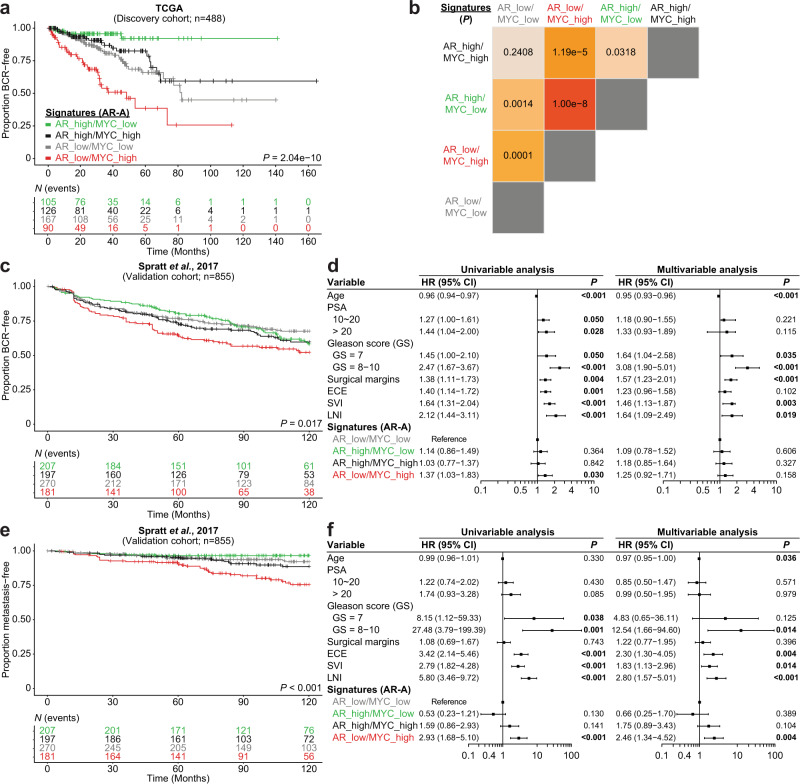
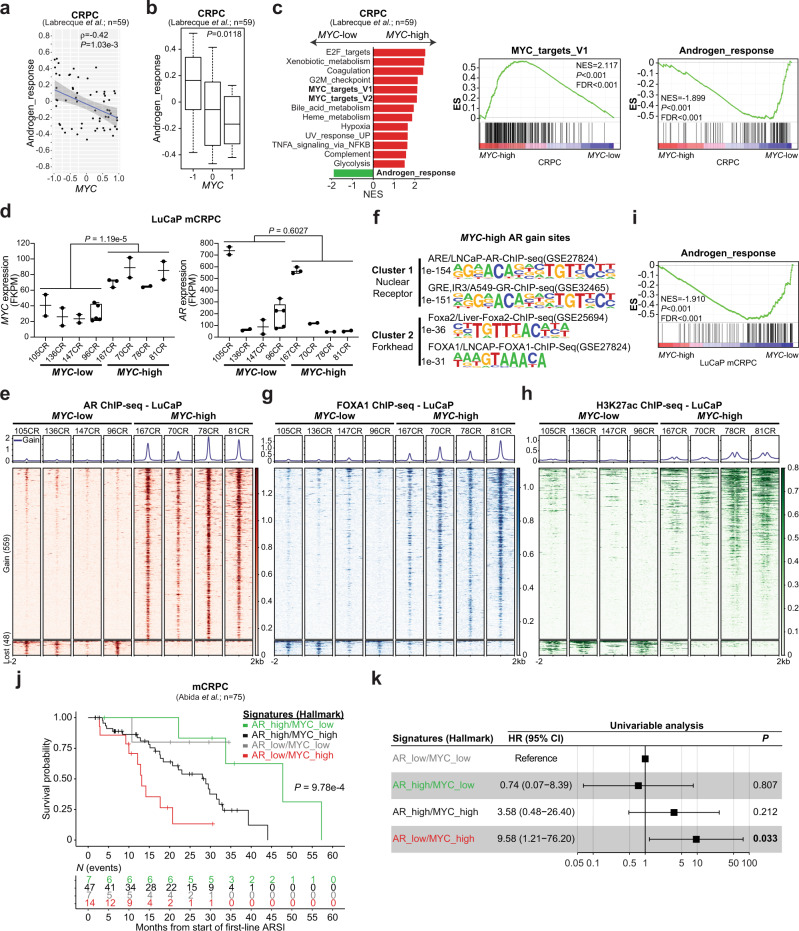
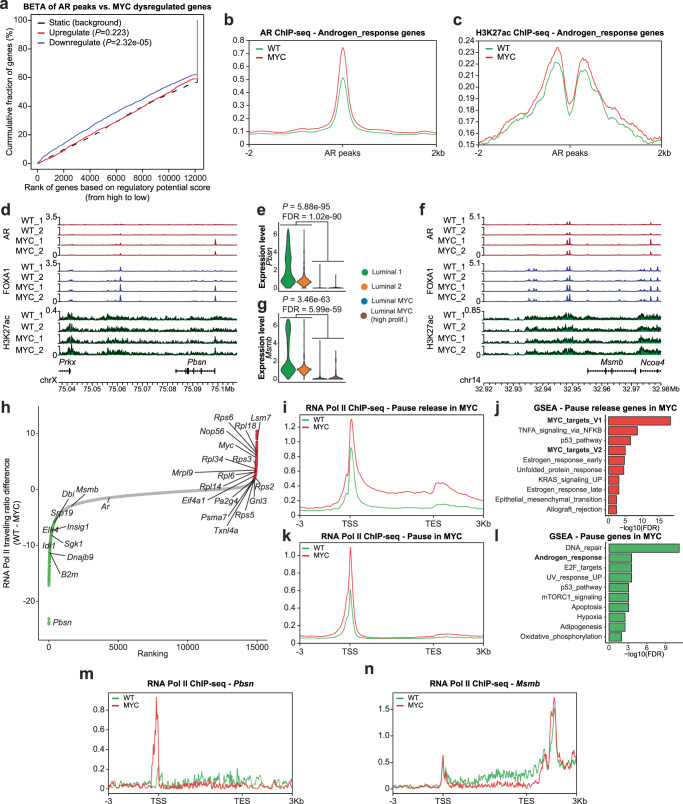
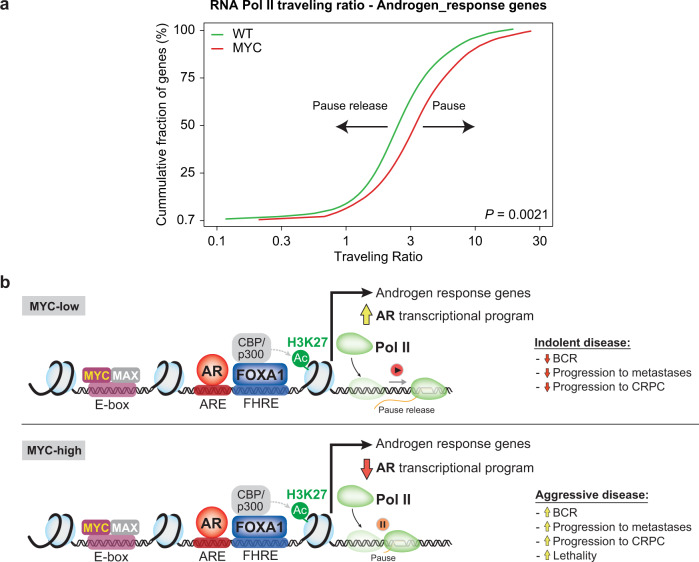
c-MYC (MYC) is a major driver of prostate cancer tumorigenesis and progression. Although MYC is overexpressed in both early and metastatic disease and associated with poor survival, its impact on prostate transcriptional reprogramming remains elusive. We demonstrate that MYC overexpression significantly diminishes the androgen receptor (AR) transcriptional program (the set of genes directly targeted by the AR protein) in luminal prostate cells without altering AR expression. Analyses of clinical specimens reveal that concurrent low AR and high MYC transcriptional programs accelerate prostate cancer progression toward a metastatic, castration-resistant disease. Data integration of single-cell transcriptomics together with ChIP-seq uncover an increase in RNA polymerase II (Pol II) promoter-proximal pausing at AR-dependent genes following MYC overexpression without an accompanying deactivation of AR-bound enhancers. Altogether, our findings suggest that MYC overexpression antagonizes the canonical AR transcriptional program and contributes to prostate tumor initiation and progression by disrupting transcriptional pause release at AR-regulated genes.


Conflict of interest statement

R.J.K. receive royalties from GenomeDx (now Veracyte) for Decipher testing. S.W. receives research funding from PreludeDX. K.W.W. serves on the scientific advisory board of T-Scan Therapeutics, SQZ Biotech, Nextechinvest and receives sponsored research funding from Novartis. He is a co-founder of Immunitas, a biotech company. These activities are not related to the research reported in this publication. D.E.S. receives personal fees from Janssen, AstraZeneca, and Blue Earth and funding from Janssen. E.C. received research funding under institutional SRA from Janssen Research and Development, Bayer Pharmaceuticals, KronosBio, Forma Pharmaceutics, Foghorn, Gilead, Sanofi, AbbVie, MacroGenics, and GSK. M.L.F. reports other support from Nuscan Diagnostics outside the submitted work. X.S.L. conducted the work while being a faculty at the Dana-Farber Cancer Institute and is currently a board member and CEO of GV20. M.B. and H.W.L. receives sponsored research support from Novartis. M.B. is a consultant to Aleta Biotherapeutics and H3 Biomedicine and serves on the SAB of Kronos Bio. The remaining authors declare no competing interests.

Figures

Fig. 1
Fig. 1. MYC induces a profound transcriptional reprogramming in murine prostate lobes.
a Graphical summary of the experimental design. b, c Transcriptional profiling of WT and MYC-transformed VP reveal high concordance for the total number of genes detected (b) and their expression levels (c) between bulk and single-cell RNA-seq (VP; matched bulk and single-cell RNA-seq; n = 1 per genotype). d, e Sample-sample correlation (d) and principal component analysis (e) between bulk and matched single-cell transcriptome identifies distinct transcriptional profiles across murine prostate lobes (AP, DLP, VP; matched bulk and single-cell RNA-seq; n = 1 per genotype). f Single-cell census of WT and MYC-transformed AP, DLP and VP. tSNE of scRNA-seq profiles colored using known markers identified nine major subpopulations across prostate lobes (AP, DLP, VP; n = 1 per genotype). gi The human MYC transgene (hg19MYC) expression is largely restricted to the luminal compartment (g AP, DLP, VP; n = 1 per genotype) and predominantly expressed in the VP (h Source data are provided as a Source Data file), in accordance with the penetrance of prostatic intraepithelial neoplasia (i PIN; n = biologically independent animals; mean ± SD; Source data are provided as a Source Data file). WT: wild-type; VP: ventral prostate; DLP: dorsolateral prostate; AP: anterior prostate.
Fig. 2
Fig. 2. Single-cell transcriptome reveals distinct luminal cell subpopulations.
a, b Single cell census of the WT and MYC-transformed VP (a) followed by unsupervised clustering revealed four luminal subsets (b VP; n = 1 per genotype). c, d Human MYC transcript (hg19MYC) is only observed in MYC-transformed VP and mostly restricted to the luminal subsets while murine Myc transcript (mm10Myc) is expressed across cellular populations and genotypes (c VP; n = 1 per genotype) and is not correlated with hg19MYC expression in luminal cells (d VP; n = 1 per genotype; edgeR: two-sided quasi-likelihood F-test).
Fig. 3
Fig. 3. MYC-driven luminal cells transformation dampens the AR transcriptional program.
a Gene Set Enrichment Analysis (GSEA, Hallmark, P < 0.05 and FDR < 0.1) revealed that the bulk RNA-seq transcriptional program associated with MYC overexpression is mostly driven by the luminal subset (VP; matched bulk and single-cell RNA-seq; n = 1 per genotype; Source data are provided as a Source Data file). b, c MYC overexpression is associated with an enriched MYC transcriptional program (b P < 0.001 and FDR < 0.001) and a depleted AR response (c P < 0.016 and FDR < 0.040) in the luminal subset (GSEA; VP; n = 1 per genotype). d, e MYC overexpression does not alter AR transcript expression in the luminal compartment (d VP; n = 1 per genotype; edgeR: two-sided quasi-likelihood F-test) and protein levels in the VP (e VP; n = 3 per genotype; numbers at the bottom represent AR levels relative to β-Actin; Source data are provided as a Source Data file). f Schematic representation of covariance analysis to determine co-expression (i.e. positive covariance) or mutually exclusive expression (i.e. negative covariance) between two genes at a single cell level. g Covariance analysis in the luminal subset reveals a shift from canonical AR target genes in the transcripts co-expressed with Ar upon MYC overexpression (VP; n = 1 per genotype). NES: normalized enrichment score; ES: enrichment score.
Fig. 4
Fig. 4. MYC overexpression alters the AR cistrome.
a AR ChIP-seq identifies an androgen response element (ARE) as the top AR binding motif in WT and MYC-transformed VP (VP; n = 2 pools of biological replicates (n = 8–13) per genotype). b Unsupervised pairwise correlation of the murine AR cistrome from all specimens (VP; n = 2 pools of biological replicates (n = 8–13) per genotype). c MYC overexpression expands the AR cistrome as demonstrated by the heatmaps indicating AR binding intensity across 4 kb intervals (VP; n = 2 pools of biological replicates (n = 8–13) per genotype). d Motif analysis of MYC-associated AR gained sites reveal forkhead response element (FHRE) and androgen response element (ARE; VP; n = 2 pools of biological replicates (n = 8–13) per genotype). e, f AR gained sites are characterized by increased FOXA1 binding (e) and H3K27ac mark (f) in MYC-transformed VP (VP; n = 2 pools of biological replicates (n = 8–13) per genotype). g Integration of the 1695 AR bindings sites gained in MYC tumors with luminal single cell transcriptome grouped by k-means clustering (n = 3 clusters). h GSEA analysis (Hallmark) revealed an enforced MYC transcriptional program (Cluster 1) and a diminished androgen response (Cluster 2) associated to MYC-dependent AR gained binding sites (Source data are provided as a Source Data file).
Fig. 5
Fig. 5. Divergent MYC and AR transcriptional programs dictate disease progression.
a, b Kaplan–Meier curves (a) and log-rank tests (b) reveal that patients bearing a primary tumor characterized by low AR-activity (AR-A) and concurrent high MYC transcriptional signature (Hallmark) have a shorter time to biochemical recurrence (BCR) within the discovery cohort (TCGA). c, d Kaplan–Meier curves (c), univariable and multivariable analysis (d Cox proportional hazards model) confirms that tumors with concurrent low AR-A and high MYC transcriptional signatures develop BCR after radical prostatectomy more rapidly than low AR-A tumors without an active MYC transcriptional program in the validation cohort (Spratt et al., 2017; n = 855; HR ± 95% CI). e, f Kaplan–Meier curves (e), univariable and multivariable analyses (f Cox proportional hazards model) reveal that tumors with concurrent low AR-A and high MYC transcriptional signatures are more likely to develop a metastatic disease (n = 855; HR ± 95% CI). PSA: prostate-specific antigen; HR: hazard ratio; CI: confidence interval; GS: Gleason score; ECE: extracapsular extension; SVI: seminal vesicles invasion; LNI: lymph node involvement.
Fig. 6
Fig. 6. High MYC expression is associated with a dampened AR transcriptional program and resistance to AR signaling inhibitors in castration-resistant tumors.
a, b AR activity is inversely correlated with MYC expression in CRPC clinical samples (a Pearson correlation coefficient (ρ) and P value; linear regression ± 95% CI; Source data are provided as a Source Data file) and significantly lower in MYC-high tumors (b Two-way ANNOVA followed by a Tukey–Kramer test; median; box boundaries: 25th and 75th percentiles; whiskers: ± lowest/smallest value no further than 1.5 interquartile range; n = 59; Source data are provided as a Source Data file). c Gene Set Enrichment Analysis (GSEA, Hallmark, P < 0.05 and FDR < 0.1) revealed an enriched MYC transcriptional program (P < 0.001 and FDR < 0.001) and a depleted AR response (P < 0.001 and FDR < 0.001) in MYC-high CRPC (Source data are provided as a Source Data file). d, e MYC-high mCRPC LuCaP patient-derived xenografts (PDXs) have similar levels of AR (d Wilcoxon rank-sum test; n = 8 biologically independent animals; median, whiskers ± min to max; Source data are provided as a Source Data file) but are associated with an expanded AR cistrome as demonstrated by the increased binding intensity across 4 kb intervals at AR gained sites (e). f Motif analysis of MYC-associated AR gained sites reveal ARE and FHRE. g, h AR gained sites are characterized by increased FOXA1 binding (g) and H3K27ac mark (h) in MYC-high mCRPC LuCaP. i AR cistrome in MYC-high mCRPC LuCaP PDXs is associated with a diminished androgen response (GSEA; P < 0.001 and FDR < 0.001). j, k Kaplan-Meier curves (j) and univariable analysis (k Cox proportional hazards model) revealed that patients with mCRPC tumors harboring an AR_low/MYC_high signature are more likely to resist ARSI treatment and die of their disease (n = 75; HR ± 95% CI). HR: hazard ratio; CI: confidence interval; NES: normalized enrichment score; ES: enrichment score.
Fig. 7
Fig. 7. MYC overexpression disrupts the AR transcriptional program by pausing AR regulated genes.
a BETA analysis revealed that AR binding sites are associated with gene downregulation following MYC overexpression. b, c Despite a dampened AR transcriptional program, higher levels of the AR binding (b) and H3K27ac mark (c) are observed nearby AR response genes (VP; n = 2 pools of biological replicates (n = 8–13) per genotype). d, e AR, FOXA1 and H3K27ac tracks at Pbsn locus, an AR-dependent gene, reveal unchanged or heightened AR and FOXA1 binding (d VP; n = 2 pools of biological replicates (n = 8–13) per genotype) albeit decreased transcript level (e VP; n = 1 per genotype; edgeR: two-sided quasi-likelihood F-test) following MYC overexpression. f, g Unchanged AR and FOXA1 binding and H3K27ac mark at Mmsb locus (f VP; n = 2 pools of biological replicates (n = 8–13) per genotype), an AR-dependent gene downregulated by MYC overexpression (g VP; n = 1 per genotype; edgeR: two-sided quasi-likelihood F-test). h RNA Pol II traveling ratio differences following MYC overexpression in murine VP (VP; n = 2 pools of biological replicates (n = 8–13) per genotype). i, j Pause release genes following MYC overexpression are characterized by greater RNA Pol II occupancy at gene body (i VP; n = 2 pools of biological replicates (n = 8–13) per genotype) and are enriched for MYC transcriptional signatures (j GSEA, Hallmark, P < 0.05 and FDR < 0.1; Source data are provided as a Source Data file). k, l Pause genes following MYC overexpression are characterized by greater promoter-proximal RNA Pol II occupancy (k VP; n = 2 pools of biological replicates (n = 8–13) per genotype) and are enriched for AR transcriptional signature (l GSEA, Hallmark, P < 0.05 and FDR < 0.1; Source data are provided as a Source Data file). m, n Increased RNA Pol II occupancy at the promoter of Pbsn (m) and decreased occupancy at the gene body of Msmb (n) following MYC overexpression (VP; n = 2 pools of biological replicates (n = 8–13) per genotype). TSS: transcription start site; TES: transcription end site.
Fig. 8
Fig. 8. MYC disrupts transcriptional pause release at androgen receptor targets.
a RNA Pol II traveling ratio reveals greater promoter-proximal pausing at Androgen_response genes (two-tailed t-test). b Graphical summary. TSS: transcription start site; TES: transcription end site; BCR: biochemical recurrence; CRPC: castration resistant prostate cancer; FHRE: forkhead response elements; ARE: androgen response elements.

References

    1. Siegel RL, Miller KD, Jemal A. Cancer statistics, 2019. CA Cancer J. Clin. 2019;69:7–34. - PubMed
    1. White JW., II The present position of the surgery of the hypertrophied prostate. Ann. Surg. 1893;18:152–188. doi: 10.1097/00000658-189307000-00020. - DOI - PMC - PubMed
    1. White JWI. The results of double castration in hypertrophy of the prostate. Ann. Surg. 1895;22:1–80. doi: 10.1097/00000658-189507000-00001. - DOI - PMC - PubMed
    1. Huggins C, Hodges CV. Studies on prostatic cancer - I The effect of castration, of estrogen and of androgen injection on serum phosphatases in metastatic carcinoma of the prostate. Cancer Res. 1941;1:293–297. - PubMed
    1. Huggins C, Stevens RE, Hodges CV. Studies on prostate cancer II The effects of castration on advanced carcinoma of the prostate gland. Arch. Surg.-Chic. 1941;43:209–223. doi: 10.1001/archsurg.1941.01210140043004. - DOI

Publication types