. 2022 May 13;12(1):7976.
doi: 10.1038/s41598-022-11534-9.

Direct RNA targeted in situ sequencing for transcriptomic profiling in tissue

Affiliations

Direct RNA targeted in situ sequencing for transcriptomic profiling in tissue

Hower Lee et al. Sci Rep. .

Erratum in

Abstract

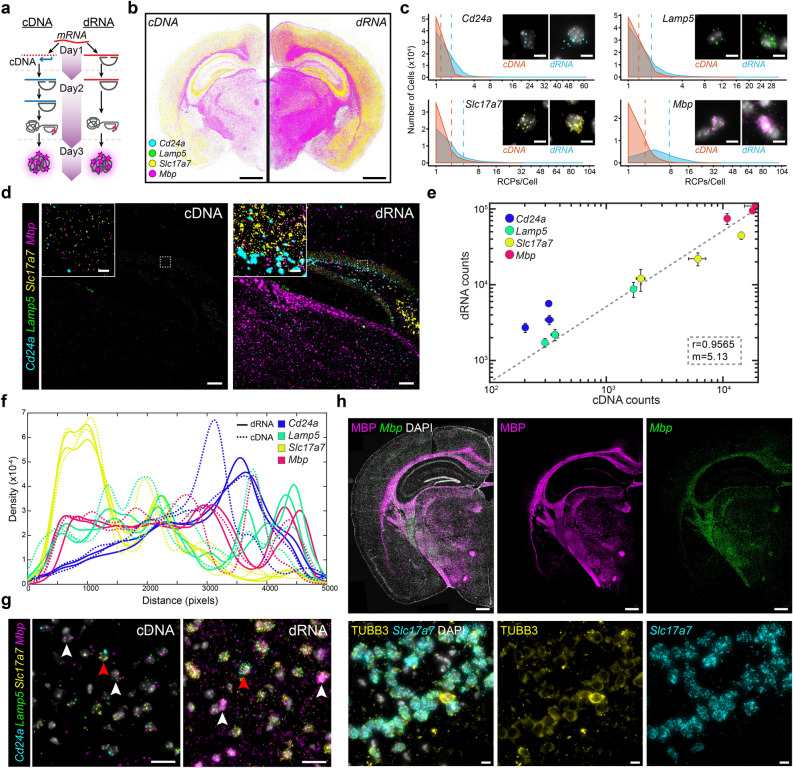
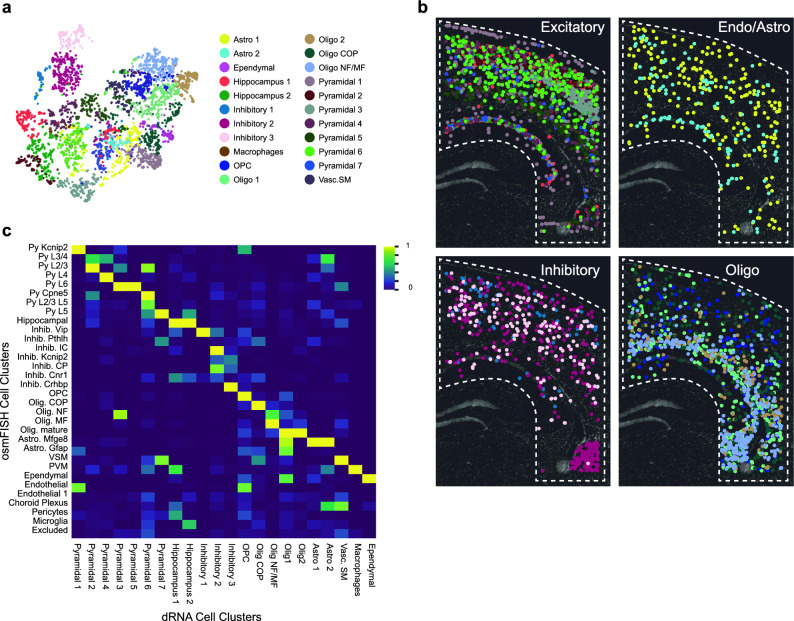
Highly multiplexed spatial mapping of transcripts within tissues allows for investigation of the transcriptomic and cellular diversity of mammalian organs previously unseen. Here we explore a direct RNA (dRNA) detection approach incorporating the use of padlock probes and rolling circle amplification in combination with hybridization-based in situ sequencing chemistry. We benchmark a High Sensitivity Library Preparation Kit from CARTANA that circumvents the reverse transcription needed for cDNA-based in situ sequencing (ISS) via direct RNA detection. We found a fivefold increase in transcript detection efficiency when compared to cDNA-based ISS and also validated its multiplexing capability by targeting a curated panel of 50 genes from previous publications on mouse brain sections, leading to additional data interpretation such as de novo cell clustering. With this increased efficiency, we also found to maintain specificity, multiplexing capabilities and ease of implementation. Overall, the dRNA chemistry shows significant improvements in target detection efficiency, closing the gap to other fluorescent in situ hybridization-based technologies and opens up possibilities to explore new biological questions previously not possible with cDNA-based ISS.


Conflict of interest statement

MN is co-founder of CARTANA AB from which reagent kits were obtained for this study. After the initiation of this study, CARTANA AB has been acquired by 10xGenomics. MN holds a scientific advisory position at 10xGenomics. The study presented here was a completely independent evaluation of the High Sensitivity (HS) Library Preparation kit from CARTANA AB. All reagents used from CARTANA are listed in the Methods section. DG is currently employed by 10xGenomics. All other authors declare no potential conflict of interest.

Figures

Figure 1
Figure 1
dRNA-HybISS targeting in situ using a 4-plex gene panel. (a) Schematic of benchmarking experiment to compare cDNA- and dRNA-based HybISS. (b) Expression distribution of 4-plex gene panel (Cd24a/Lamp5/Slc17a7/Mbp) across sequential half coronal mouse brain section. Displayed as output from MATLAB analysis pipeline. Scale bar, 1 mm. (c) RCP counts per cell of half coronal section and their frequency for each gene in the 4-plex panel. Representative raw images of single cells. Dashed lines represent the mean RCPs/Cell count for the respective chemistries. Scale bar, 5 µm. (d) Representative raw image of 4-plex from one of three ROIs (Supplementary Fig. 1e,f). Experiments run in parallel and same post processing intensity level adjustments. ROIs include regions of cortex, hippocampus, and lateral ventricle. Scale bar, 100 µm, inset 10 µm. e, Correlation plot of total RCP counts of dRNA against cDNA in three ROIs. X-axis represents cDNA and y-axis dRNA. Each spot of same color represents the 3 ROIs and deviation calculated from consecutive sections. (f) Spatial distribution of 4-plex genes across mouse cortex ROI between cDNA and dRNA. (g) Multiplexed distribution of 4-plex genes in cortical region. Cd24a + cells indicated by red arrowheads, Mbp + cells indicated by white arrowheads. Scale bar, 20 µm. (h) Colocalization of fluorescent immunohistochemistry with dRNA HybISS. Top panels show MBP protein detection with Mbp dRNA-HybISS. Bottom panels show pan-neuronal marker TUBB3 with excitatory neuron marker Slc17a7. Scale bar, top 500 µm, bottom 10 µm.
Figure 2
Figure 2
De novo clustering of 50 gene expression in mouse brain coronal section. (a) Expression matrix of 50 targeted genes across annotated cell clusters in segmented cells of the imaged region. (b) Uniform Manifold Approximation and Projection (UMAP) with de novo cell clustering based on the expression profile of the 50-plex gene panel. Three genes highlighted for their expression to mark pan-excitatory neurons (Slc17a7), inhibitory neurons (Slc32a1), and oligodendrocytes (Plp1). (c) Cell-type map across mouse coronal section, highlighting some classes in right panels. (d) Raw image comparison of 20X and 10X objective imaging. 200 pixel scale bar, 20X = 64.2 µm, 10X = 128.4 µm. (e) 20X objective spot-based detection converted to density-based detection compared to 10X objective density-base detection for Slc17a7. (f) Correlation comparison of 20X spot- and density-based detection to 10X-density based detection.
Figure 3
Figure 3
De novo clustering of somatosensory cortex region and comparison to osmFISH cell type clustering. (a) UMAP of cell clusters using 33-gene panel within outline ROI. (b) Cell-type map of most cell clusters superimposed on DAPI nuclear image. All cell clusters mapped in Supplementary Fig. 8c. (c) Similarity map of osmFISH cell clusters compared to dRNA-HybISS de novo clusters obtained by integrating both datasets using Spatial Gene Enrichment (SpaGE). Color bar corresponds to normalized similarity between clusters detected in both datasets.

References

    1. Asp M, Bergenstråhle J, Lundeberg J. Spatially resolved transcriptomes-next generation tools for tissue exploration. BioEssays. 2020;1900221:e1900221. doi: 10.1002/bies.201900221. - DOI - PubMed
    1. Lein E, Borm LE, Linnarsson S. The promise of spatial transcriptomics for neuroscience in the era of molecular cell typing. Science (80-. ) 2017;358:64–69. doi: 10.1126/science.aan6827. - DOI - PubMed
    1. Strell C, et al. Placing RNA in context and space - methods for spatially resolved transcriptomics. FEBS J. 2019;286:1468–1481. doi: 10.1111/febs.14435. - DOI - PubMed
    1. Eng C-HL, et al. Transcriptome-scale super-resolved imaging in tissues by RNA seqFISH+ Nature. 2019;568:235–239. doi: 10.1038/s41586-019-1049-y. - DOI - PMC - PubMed
    1. Chen KH, Boettiger AN, Moffitt JR, Wang S, Zhuang X. Spatially resolved, highly multiplexed RNA profiling in single cells. Science (80-. ) 2015;348:1360–1363. doi: 10.1126/science.aaa6090. - DOI - PMC - PubMed

Publication types

LinkOut - more resources