

BeCaked: An Explainable Artificial Intelligence Model for COVID-19 Forecasting
- PMID: 35562369
- PMCID: PMC9105619
- DOI: 10.1038/s41598-022-11693-9
BeCaked: An Explainable Artificial Intelligence Model for COVID-19 Forecasting
Abstract
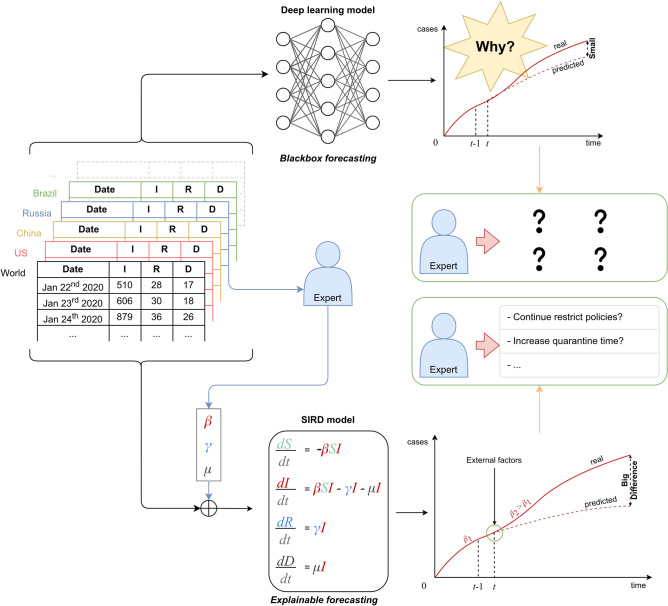
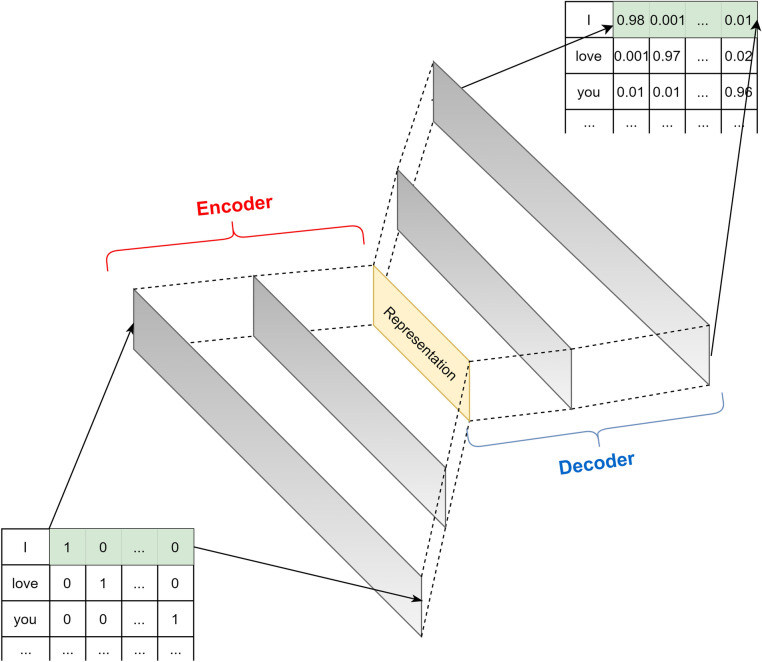
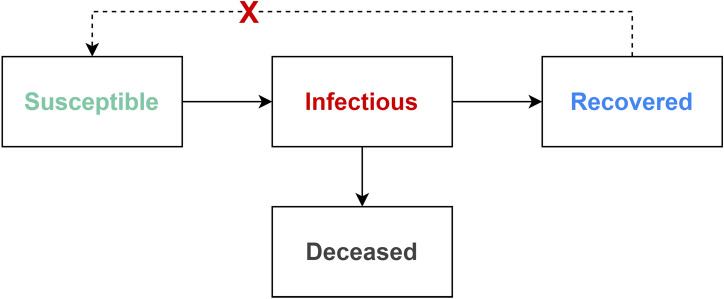
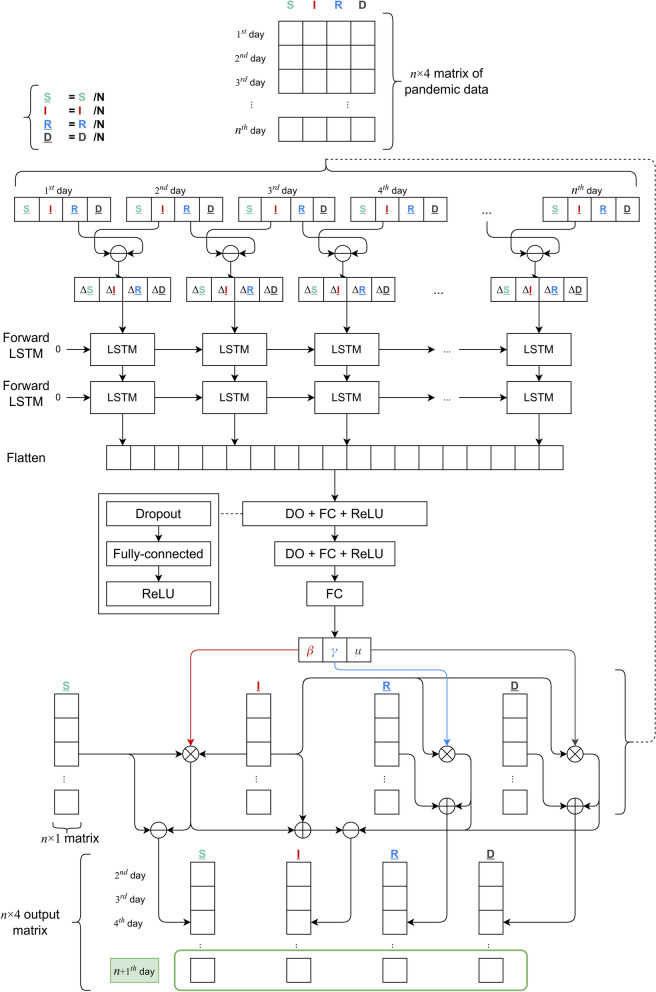
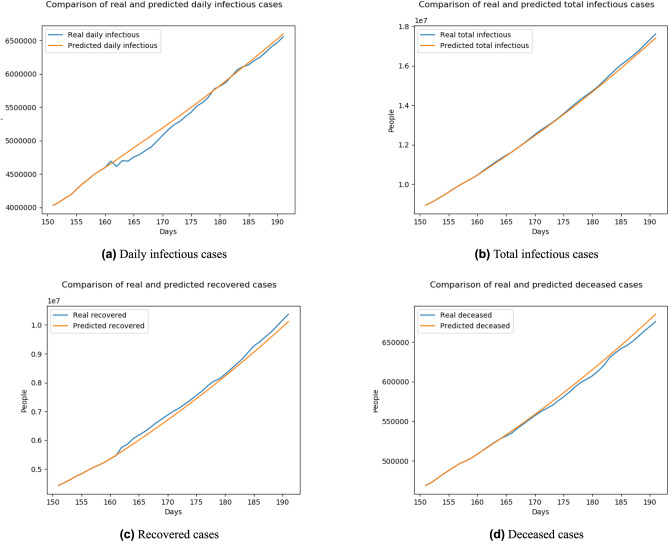
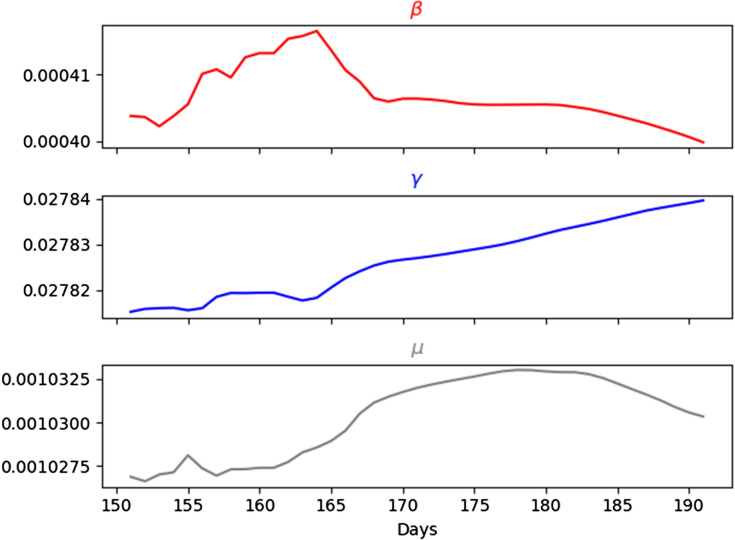
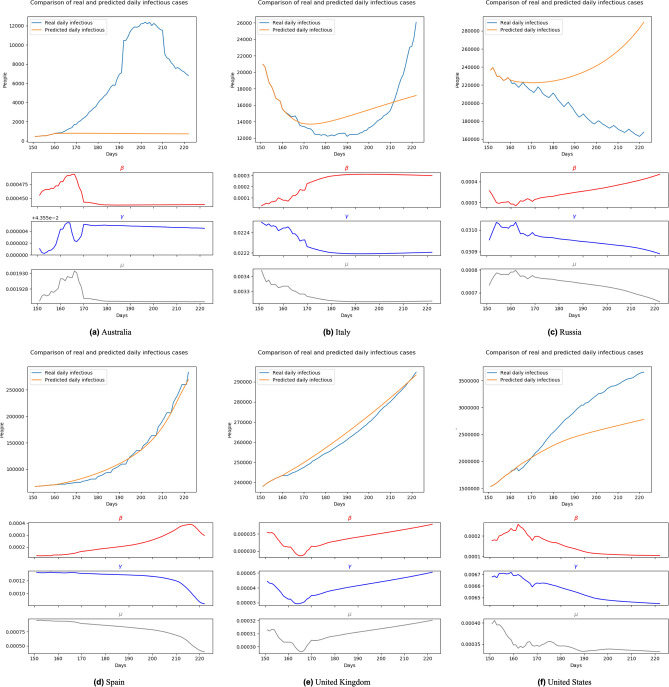
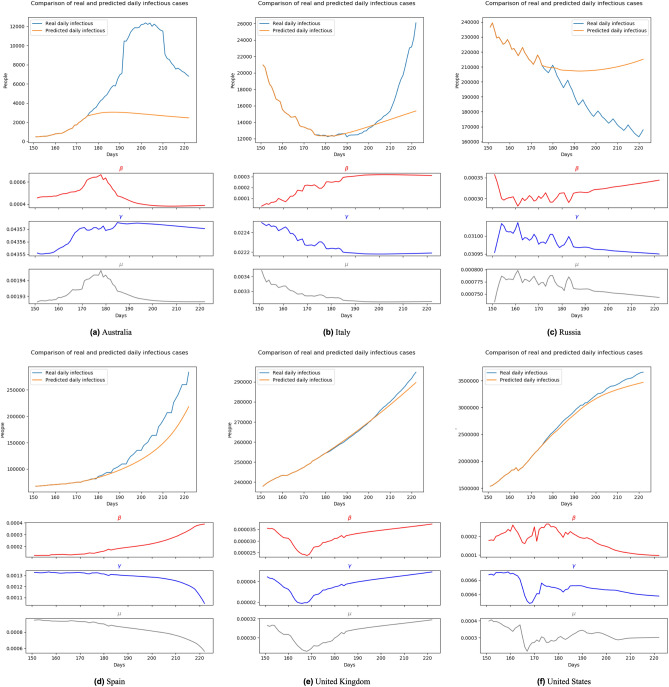
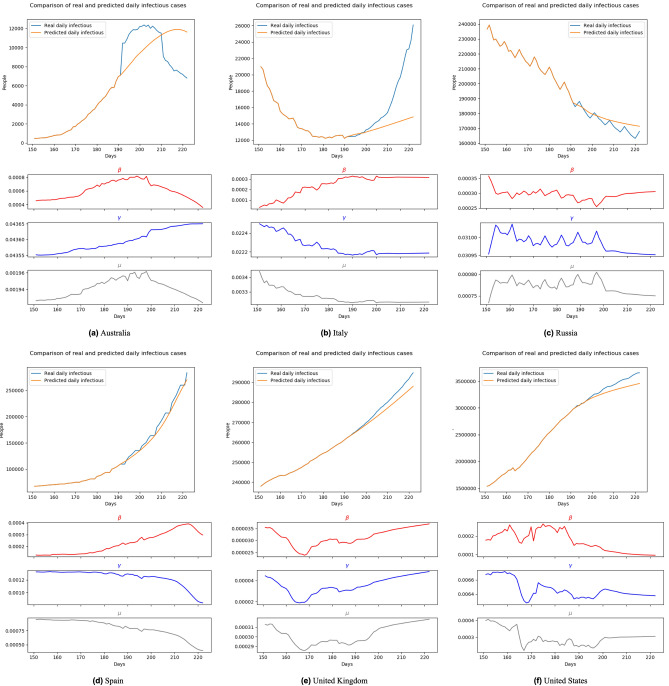
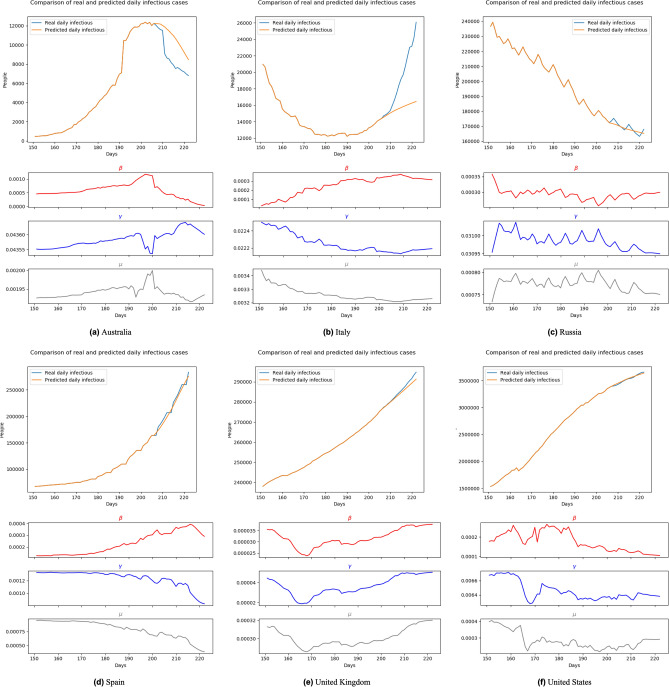
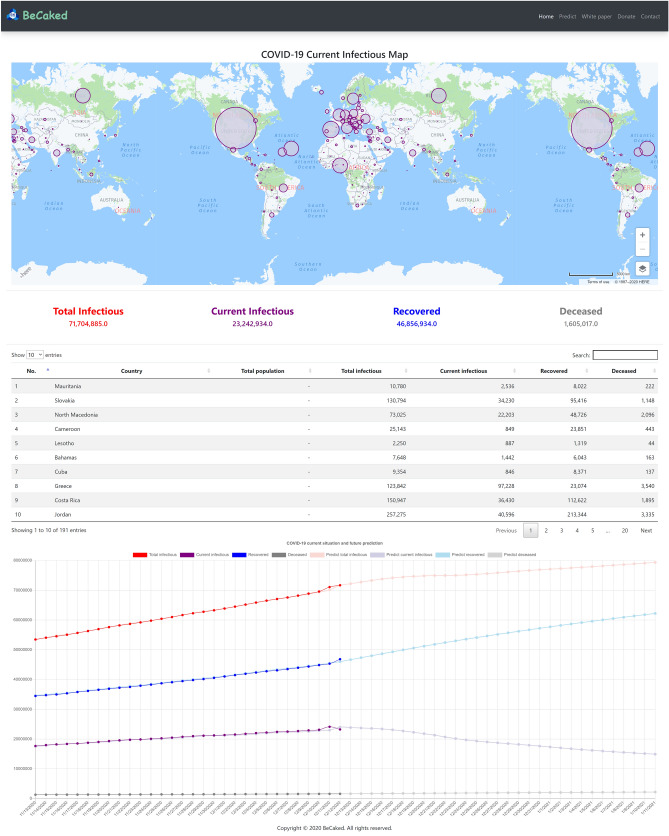
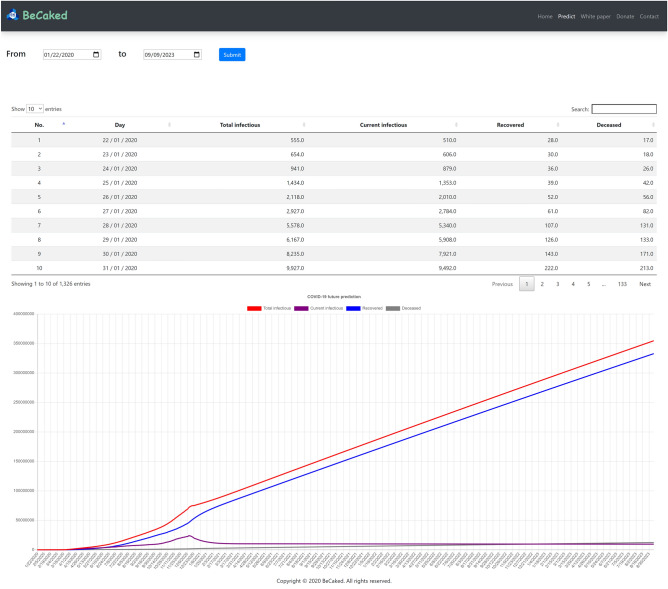
From the end of 2019, one of the most serious and largest spread pandemics occurred in Wuhan (China) named Coronavirus (COVID-19). As reported by the World Health Organization, there are currently more than 100 million infectious cases with an average mortality rate of about five percent all over the world. To avoid serious consequences on people's lives and the economy, policies and actions need to be suitably made in time. To do that, the authorities need to know the future trend in the development process of this pandemic. This is the reason why forecasting models play an important role in controlling the pandemic situation. However, the behavior of this pandemic is extremely complicated and difficult to be analyzed, so that an effective model is not only considered on accurate forecasting results but also the explainable capability for human experts to take action pro-actively. With the recent advancement of Artificial Intelligence (AI) techniques, the emerging Deep Learning (DL) models have been proving highly effective when forecasting this pandemic future from the huge historical data. However, the main weakness of DL models is lacking the explanation capabilities. To overcome this limitation, we introduce a novel combination of the Susceptible-Infectious-Recovered-Deceased (SIRD) compartmental model and Variational Autoencoder (VAE) neural network known as BeCaked. With pandemic data provided by the Johns Hopkins University Center for Systems Science and Engineering, our model achieves 0.98 [Formula: see text] and 0.012 MAPE at world level with 31-step forecast and up to 0.99 [Formula: see text] and 0.0026 MAPE at country level with 15-step forecast on predicting daily infectious cases. Not only enjoying high accuracy, but BeCaked also offers useful justifications for its results based on the parameters of the SIRD model. Therefore, BeCaked can be used as a reference for authorities or medical experts to make on time right decisions.
© 2022. The Author(s).
Conflict of interest statement
The authors declare no competing interests.
Figures
References
-
- WHO. Coronavirus. https://www.who.int/health-topics/coronavirus (2021).
-
- Rumelhart D, Hinton G, Williams R. Learning representations by back-propagating errors. Nature. 1986;323:533–536. doi: 10.1038/323533a0. - DOI
Publication types
MeSH terms
LinkOut - more resources
Full Text Sources
Medical
Research Materials
