

Immunogenicity and safety of an intradermal ChAdOx1 nCoV-19 boost in a healthy population
- PMID: 35562372
- PMCID: PMC9106663
- DOI: 10.1038/s41541-022-00475-z
Immunogenicity and safety of an intradermal ChAdOx1 nCoV-19 boost in a healthy population
Erratum in
-
Author Correction: Immunogenicity and safety of an intradermal ChAdOx1 nCoV-19 boost in a healthy population.NPJ Vaccines. 2022 Sep 6;7(1):107. doi: 10.1038/s41541-022-00529-2. NPJ Vaccines. 2022. PMID: 36068243 Free PMC article. No abstract available.
Abstract
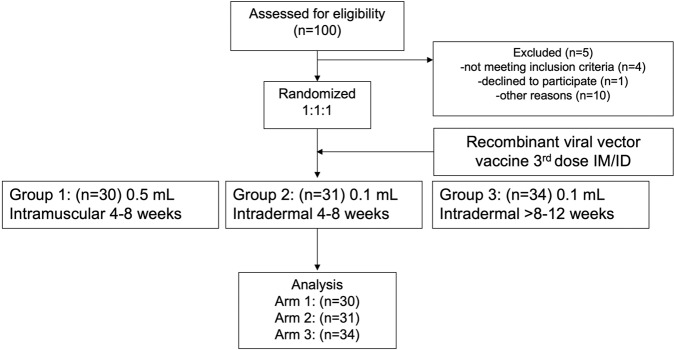
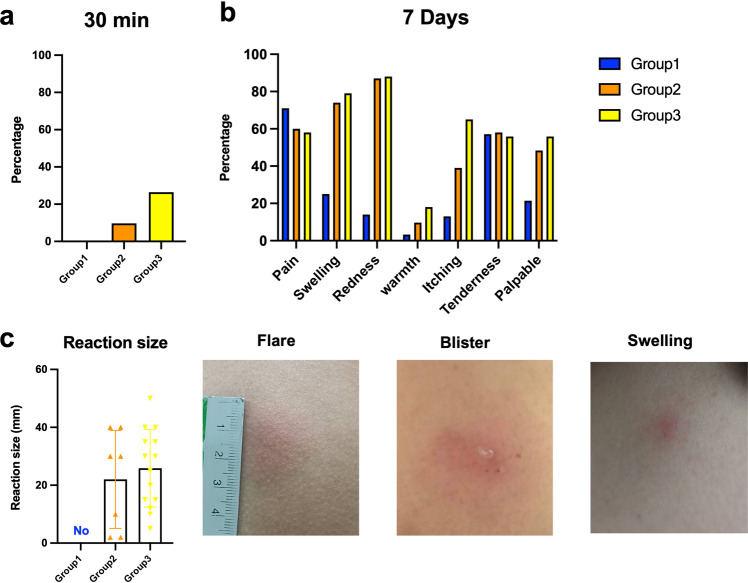
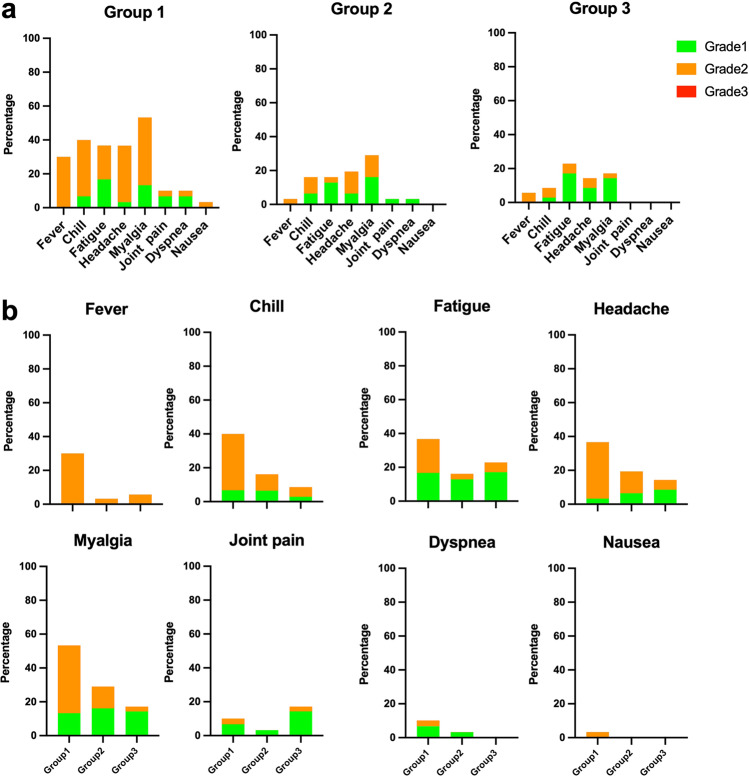
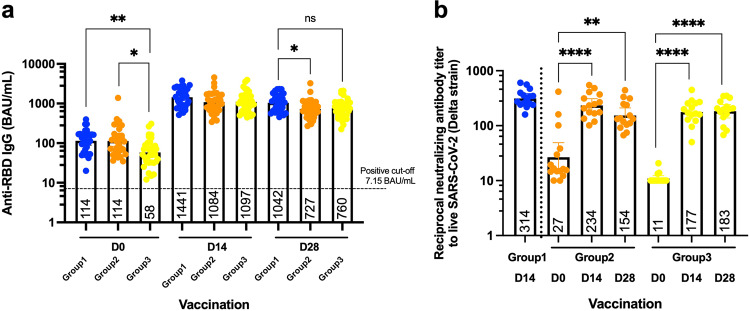
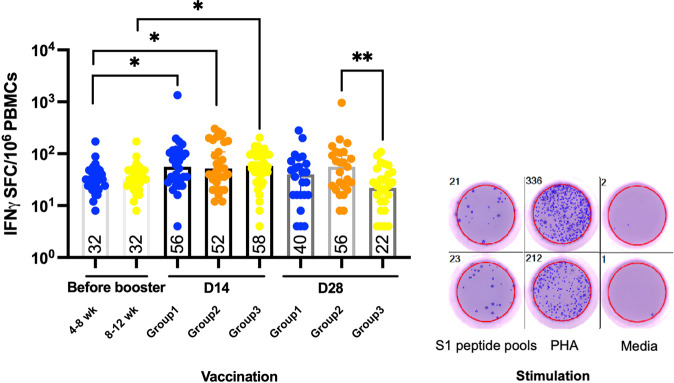
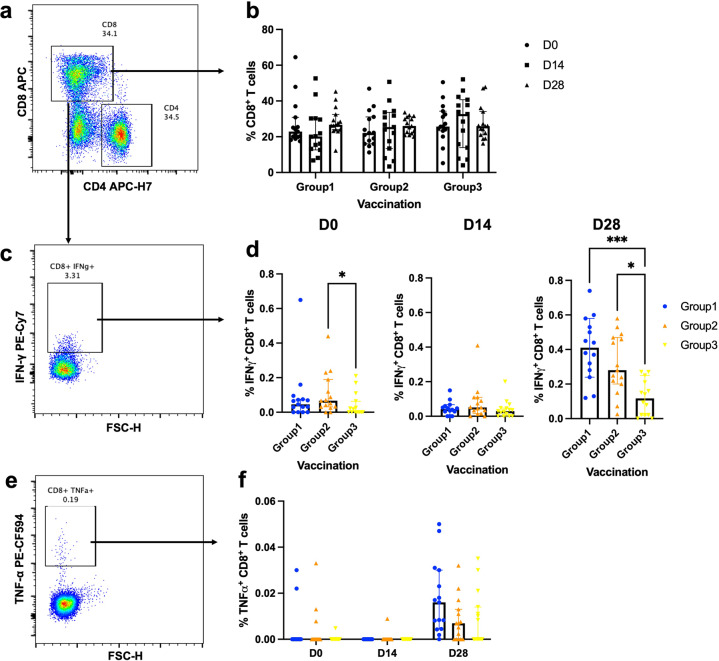
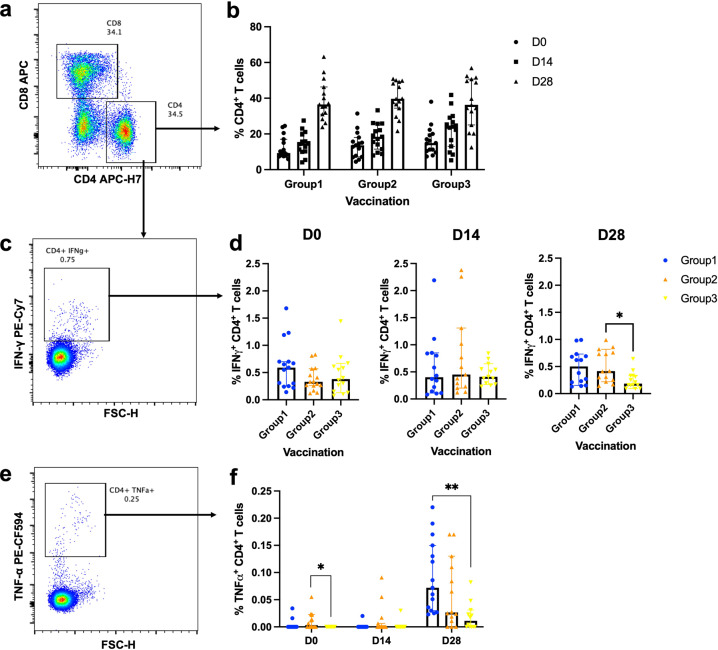
Severe acute respiratory syndrome coronavirus 2 (SARS-CoV-2) has caused a global pandemic. Two doses of an inactivated SARS-CoV-2 vaccine (CoronaVac) have been shown to be insufficient to protect against variants of concern (VOCs), while viral vector vaccines remain protective against the infection. Herein, we conducted a preliminary study to evaluate the safety and immunity in an adult population who received the conventional 2 dosage-regimen of inactivated SARS-CoV-2 vaccine; with an additional intradermal ChAdOx1 nCoV-19 reciprocal dosage (1:5). An Intramuscular ChAdOx1 nCoV-19 booster was also included as a control. Immediate and delayed local reactions were frequently observed in the fractional intradermal boost, but systemic side effects were significantly decreased compared to the conventional intramuscular boost. The anti-RBD-IgG levels, the neutralising function against delta variants, and T cell responses were significantly increased after boosting via both routes. Interestingly, the shorter interval elicited higher immunogenicity compared to the extended interval. Taken together, a reciprocal dosage of intradermal ChAdOx1 nCoV-19 booster reduces systemic adverse reactions and enhances non inferiority humoral and cellular immune responses compared to a full dose of intramuscular boosting. These findings provide for an effective vaccine management during the shortages of vaccine supply.
© 2022. The Author(s).
Conflict of interest statement
The authors declare no competing interests.
Figures
Similar articles
-
Evaluation of the Safety and Immunogenicity of Fractional Intradermal COVID-19 Vaccines as a Booster: A Pilot Study.Vaccines (Basel). 2022 Sep 8;10(9):1497. doi: 10.3390/vaccines10091497. Vaccines (Basel). 2022. PMID: 36146575 Free PMC article.
-
Immunogenicity and Safety of an Intradermal BNT162b2 mRNA Vaccine Booster after Two Doses of Inactivated SARS-CoV-2 Vaccine in Healthy Population.Vaccines (Basel). 2021 Nov 23;9(12):1375. doi: 10.3390/vaccines9121375. Vaccines (Basel). 2021. PMID: 34960122 Free PMC article.
-
Monitoring of adaptive immune responses in healthcare workers who received a Coronavirus disease 2019 vaccine booster dose.Health Sci Rep. 2024 Jul 16;7(7):e2250. doi: 10.1002/hsr2.2250. eCollection 2024 Jul. Health Sci Rep. 2024. PMID: 39015422 Free PMC article.
-
Immunogenicity and safety of an intradermal fractional third dose of ChAdOx1 nCoV-19/AZD1222 vaccine compared with those of a standard intramuscular third dose in volunteers who previously received two doses of CoronaVac: A randomized controlled trial.Vaccine. 2022 Mar 15;40(12):1761-1767. doi: 10.1016/j.vaccine.2022.02.019. Epub 2022 Feb 21. Vaccine. 2022. PMID: 35210118 Free PMC article. Clinical Trial.
-
The Pilot Study of Immunogenicity and Adverse Events of a COVID-19 Vaccine Regimen: Priming with Inactivated Whole SARS-CoV-2 Vaccine (CoronaVac) and Boosting with the Adenoviral Vector (ChAdOx1 nCoV-19) Vaccine.Vaccines (Basel). 2022 Mar 30;10(4):536. doi: 10.3390/vaccines10040536. Vaccines (Basel). 2022. PMID: 35455285 Free PMC article.
Cited by
-
Immunogenicity of Intradermal Versus Intramuscular BNT162b2 COVID-19 Booster Vaccine in Patients with Immune-Mediated Dermatologic Diseases: A Non-Inferiority Randomized Controlled Trial.Vaccines (Basel). 2024 Jan 11;12(1):73. doi: 10.3390/vaccines12010073. Vaccines (Basel). 2024. PMID: 38250886 Free PMC article.
-
T-Cell Responses Induced by an Intradermal BNT162b2 mRNA Vaccine Booster Following Primary Vaccination with Inactivated SARS-CoV-2 Vaccine.Vaccines (Basel). 2022 Sep 7;10(9):1494. doi: 10.3390/vaccines10091494. Vaccines (Basel). 2022. PMID: 36146571 Free PMC article.
-
Evaluation of the Safety and Immunogenicity of Fractional Intradermal COVID-19 Vaccines as a Booster: A Pilot Study.Vaccines (Basel). 2022 Sep 8;10(9):1497. doi: 10.3390/vaccines10091497. Vaccines (Basel). 2022. PMID: 36146575 Free PMC article.
-
The Transformative Potential of Lipid Nanoparticle-Protein Corona for Next-Generation Vaccines and Therapeutics.Mol Pharm. 2023 Nov 6;20(11):5247-5253. doi: 10.1021/acs.molpharmaceut.3c00479. Epub 2023 Oct 2. Mol Pharm. 2023. PMID: 37782816 Free PMC article. Review.
-
A gold nanoparticle/peptide vaccine designed to induce SARS-CoV-2-specific CD8 T cells: a double-blind, randomized, phase 1 study in Switzerland.BMC Infect Dis. 2025 Apr 7;25(1):472. doi: 10.1186/s12879-025-10844-3. BMC Infect Dis. 2025. PMID: 40197245 Free PMC article. Clinical Trial.
References
-
- Control, E. C. f. D. P. A. Threat assessment brief: emergence of SARS CoV 2 B. 1.617 variants in India and situation in the EU/EEA (2021).
Grants and funding
- REC.64-368-4-1/Faculty of Medicine, Prince of Songkla University (Faculty of Medicine, PSU)
- REC.64-368-4-1/Faculty of Medicine, Prince of Songkla University (Faculty of Medicine, PSU)
- REC.64-368-4-1/Faculty of Medicine, Prince of Songkla University (Faculty of Medicine, PSU)
- REC.64-368-4-1/Faculty of Medicine, Prince of Songkla University (Faculty of Medicine, PSU)
LinkOut - more resources
Full Text Sources
Miscellaneous
