. 2022 May 13;13(1):2665.
doi: 10.1038/s41467-022-30392-7.

Rapid acceleration of KRAS-mutant pancreatic carcinogenesis via remodeling of tumor immune microenvironment by PPARδ

Affiliations

Rapid acceleration of KRAS-mutant pancreatic carcinogenesis via remodeling of tumor immune microenvironment by PPARδ

Yi Liu et al. Nat Commun. .

Abstract

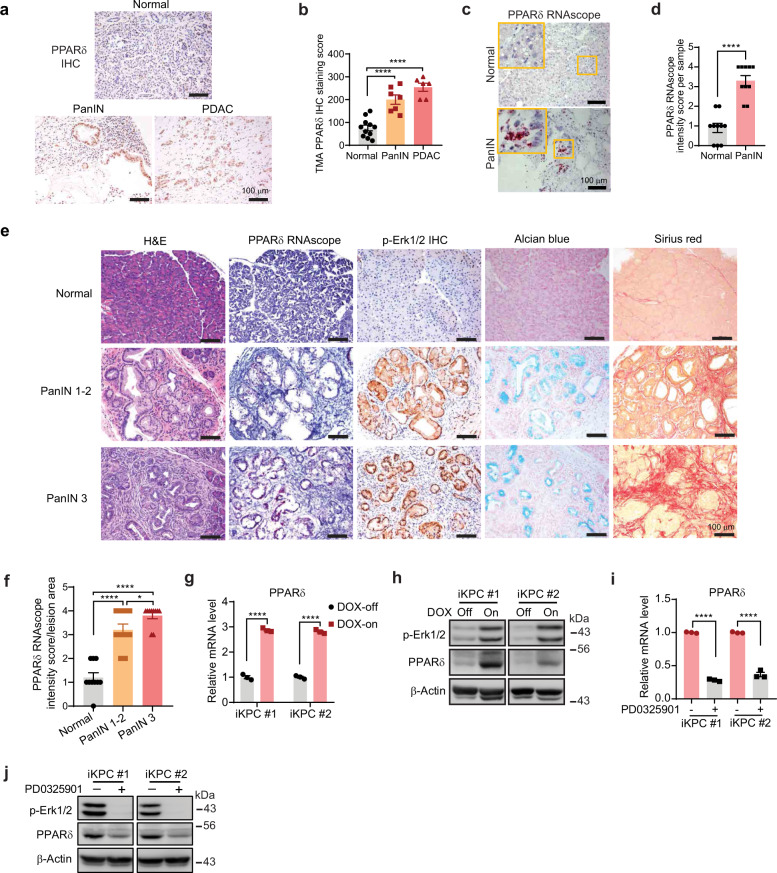
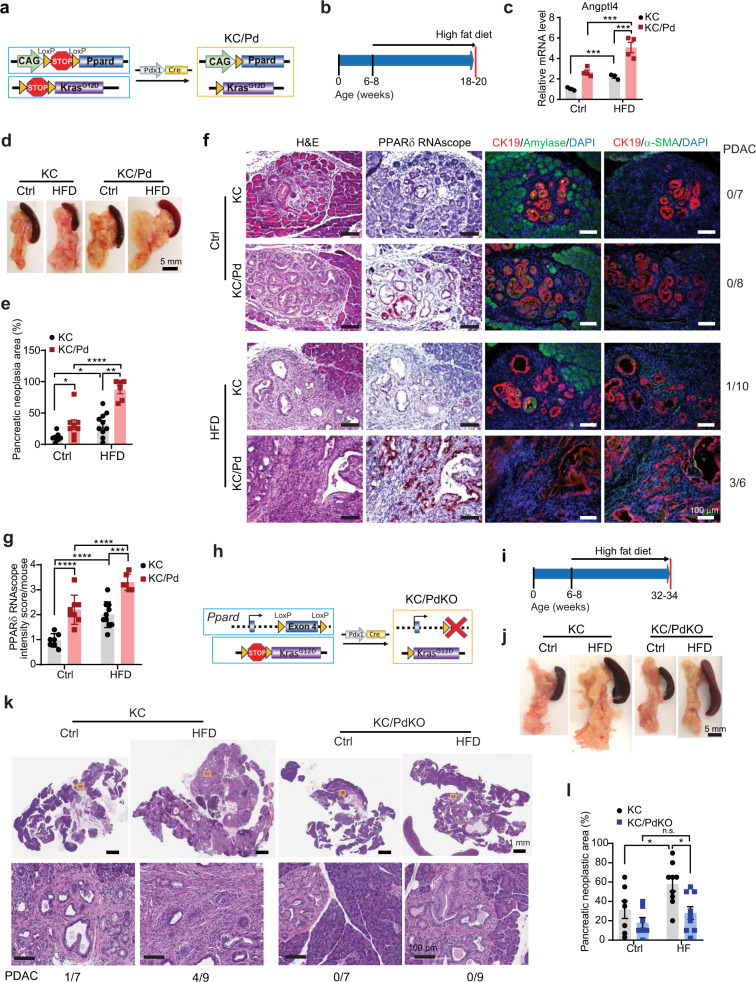
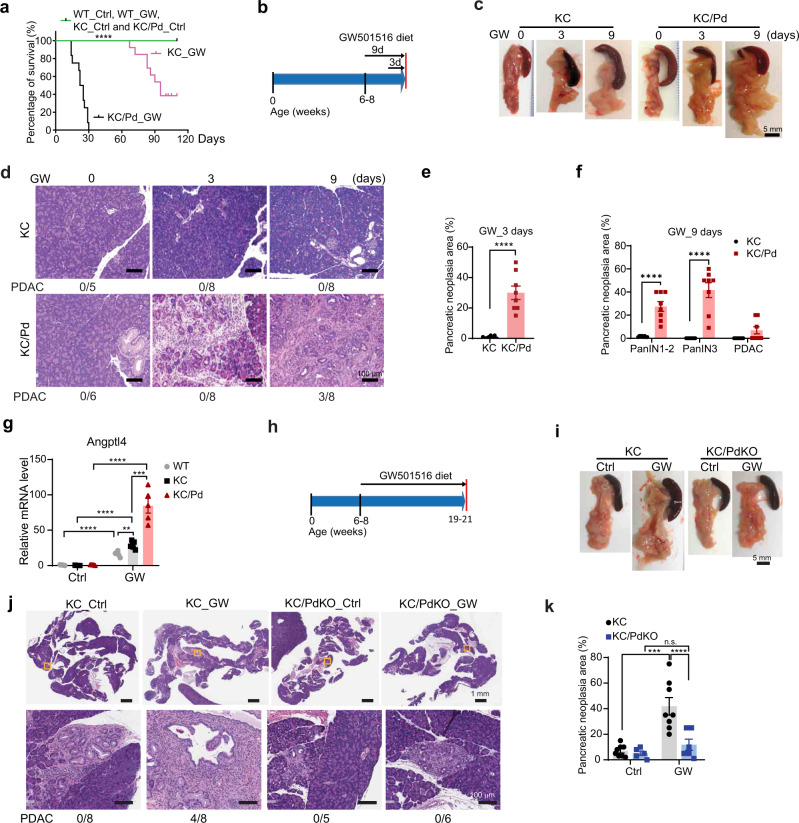
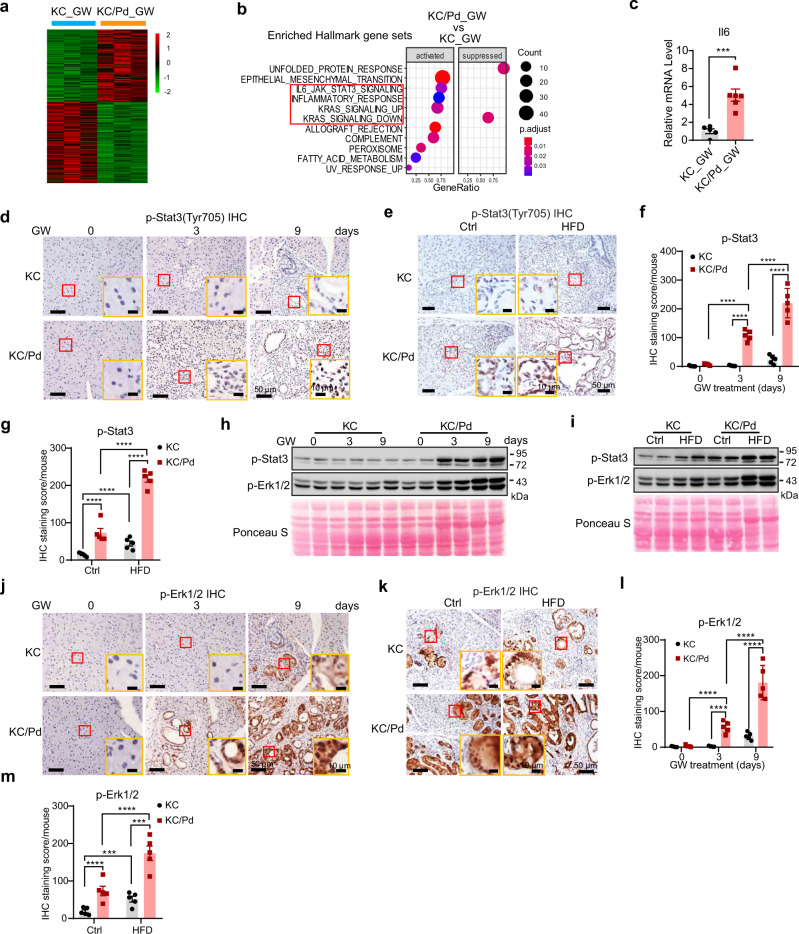
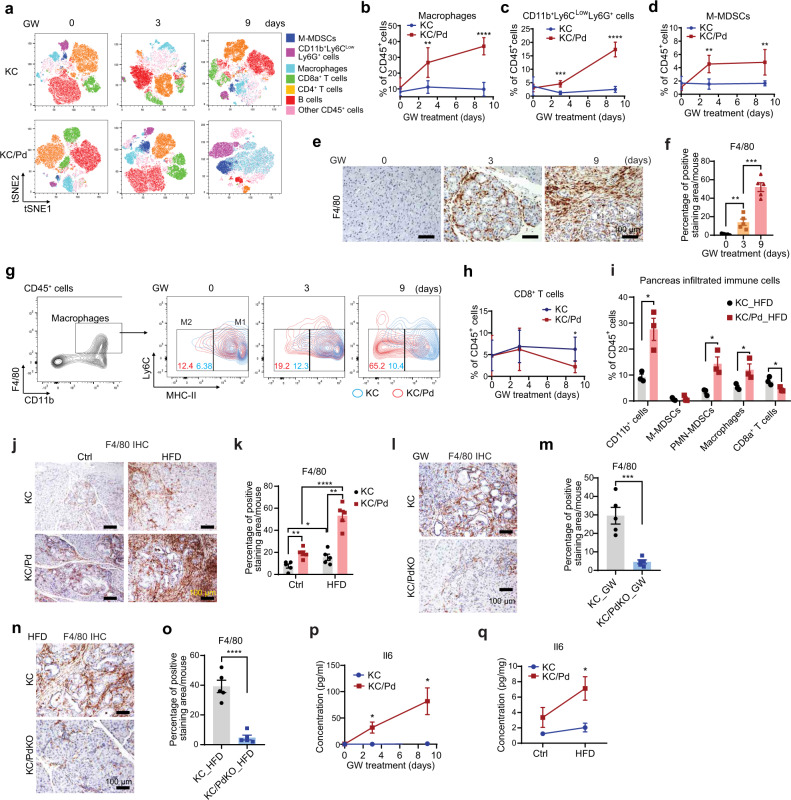
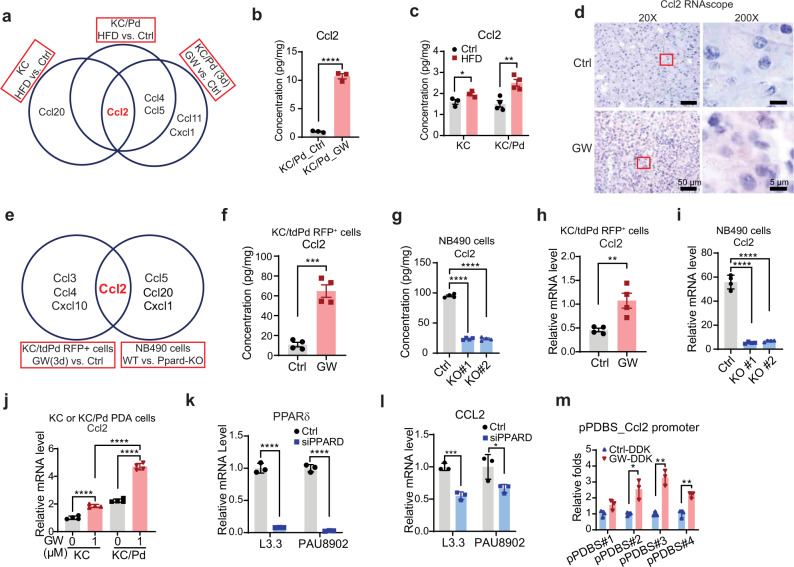
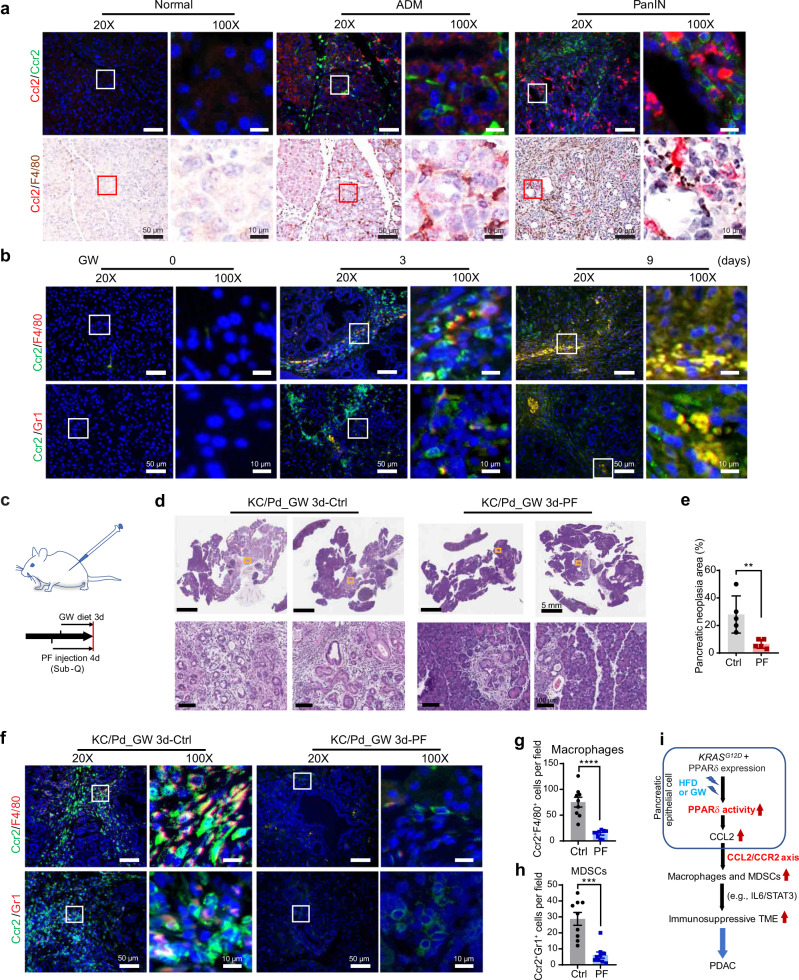
Pancreatic intraepithelial neoplasia (PanIN) is a precursor of pancreatic ductal adenocarcinoma (PDAC), which commonly occurs in the general populations with aging. Although most PanIN lesions (PanINs) harbor oncogenic KRAS mutations that initiate pancreatic tumorigenesis; PanINs rarely progress to PDAC. Critical factors that promote this progression, especially targetable ones, remain poorly defined. We show that peroxisome proliferator-activated receptor-delta (PPARδ), a lipid nuclear receptor, is upregulated in PanINs in humans and mice. Furthermore, PPARδ ligand activation by a high-fat diet or GW501516 (a highly selective, synthetic PPARδ ligand) in mutant KRASG12D (KRASmu) pancreatic epithelial cells strongly accelerates PanIN progression to PDAC. This PPARδ activation induces KRASmu pancreatic epithelial cells to secrete CCL2, which recruits immunosuppressive macrophages and myeloid-derived suppressor cells into pancreas via the CCL2/CCR2 axis to orchestrate an immunosuppressive tumor microenvironment and subsequently drive PanIN progression to PDAC. Our data identify PPARδ signaling as a potential molecular target to prevent PDAC development in subjects harboring PanINs.


Conflict of interest statement

The authors declare no competing interests.

Figures

Fig. 1
Fig. 1. PPARδ expression is upregulated in human and mouse PanINs and regulated by KRASmu activity.
a, b PPARδ protein expression in human normal, PanIN 1-2, and PDAC pancreatic tissues in a tissue microarray (TMA), measured by immunohistochemistry (IHC). a Representative images of PPARδ IHC staining of the indicated groups of human pancreatic tissue samples. b PPARδ IHC scores of normal (n = 11), PanIN 1-2 (n = 7), and PDAC (n = 6) pancreatic tissues obtained from TMA. c, d PPARδ mRNA expression levels in human normal and paired PanIN 1-2 (n = 10), measured by RNAscope in situ hybridization. c Representative images of PPARδ RNAscope in situ hybridization staining of the slides. Positive PPARδ mRNA staining is shown in red dots. d Quantitative results of PPARδ intensity scores. e Representative images of hematoxylin and eosin (H&E) staining, PPARδ RNAscope in situ hybridization, phospho-Erk1/2 (p-Erk1/2) IHC staining, Alcian blue staining, and Sirius red staining of normal, PanIN 1-2, and PanIN 3 pancreatic tissues in KC mice. f Quantitative data of PPARδ mRNA intensity scores of normal, PanIN 1-2, and PanIN 3 pancreatic tissues in KC mice as described in panel e (n = 10 biologically independent samples). g, h Two independent iKPC cell lines were treated with 1 µg/ml doxycycline (DOX-on) or control solvent (DOX-off) for 72 h, and then PPARδ mRNA expression from three independent experiments was measured by qRT-PCR (g), and PPARδ and p-Erk1/2 protein levels were measured by Western blot (h). i, j Two iKPC mouse PDAC cell lines cultured with 1 µg/ml DOX were treated with 1 µM MEK inhibitor PD0325901 for 24 h, and then PPARδ mRNA expression from three independent experiments was measured by qRT-PCR (i), and PPARδ and p-Erk1/2 protein levels were measured by Western blot (j). Data are mean ± SEM. For (b, f), one-way ANOVA with Bonferroni correction, and for (d), (g, i), unpaired two-tailed Student’s t-test. *P < .05 and ****P < .0001. Source data are provided in a Source Data file.
Fig. 2
Fig. 2. PPARδ promotes KRASmu-initiated pancreatic tumorigenesis specially when augmented by a high-fat diet (HFD).
a Schematic diagram of the generation of KC/Pd mice. bg KC and KC/Pd mice at 6-8 weeks old, fed either the (high fat diet) HFD or the control diet (Ctrl) for 12 weeks, were euthanized, and pancreata were photographed, weighed, and harvested for gross and histologic characterization. b Schematic diagram for timeline of the HFD treatment. cf mRNA relative expression of PPARδ target Angptl4 (c, n = 3-4 biologically independent samples); representative photos of pancreata (d); percentage of pancreatic neoplastic area per mouse (e, n = 6–10 per group); representative images of H&E staining, PPARδ RNAscope in situ hybridization, and co-immunofluorescence staining of CK19 with amylase or with α-SMA for the pancreata. PDAC incidence rates for each group are shown at the left side of each panel (f); quantitative results for PPARδ RNAscope in situ hybridization (g, n = 6–10 biologically independent samples) for the KC and KC/Pd mice on the HFD or Ctrl. h Schematic diagram of the generation of KC/PdKO mice. il KC and KC/PdKO mice at 6-8 weeks were fed either the HFD or Ctrl for 26 weeks. i Timeline for the HFD feeding of mice. Representative photos of pancreata (j); representative images of H&E staining of pancreata and PDAC incidence rates (bottom) (k); and the percentage of pancreatic neoplastic area per mouse (l, n = 7–9 per group) for KC and KC/PdKO mice on the HFD or Ctrl. Data are mean ± SEM. For (c), (e), (g), and (l), two-way ANOVA with Bonferroni correction. *P < .05, **P < .01, ***P < .001, and ****P < .0001. n.s.: no significance. Source data are provided in a Source Data file.
Fig. 3
Fig. 3. Specific PPARδ activation by GW501516 strongly promotes KRASmu-initiated pancreatic tumorigenesis.
a Survival of WT, KC, and KC/Pd mice on a GW501516 (GW) diet. WT, KC, or KC/Pd mice at age 6–8 weeks were fed a diet containing GW (50 mg/kg) or the same diet except without GW as a control (Ctrl) diet (n = 12–15 per group). The survival time was calculated by the Kaplan–Meier method and compared between groups using the log-rank test. ****P < .0001. bf KC or KC/Pd mice at 6-8 weeks were fed the GW diet (50 mg/kg) for 0, 3, or 9 days and then euthanized (n = 5–8 per group). b Schematic diagram for timeline of GW diet feeding. c, d Representative photos of pancreata (c); and representative images of H&E staining of pancreata and incidence rates of PDAC/group (d) for KC and KC/Pd mice on the GW diet for 0, 3 and 9 days. e Percentage of pancreatic neoplastic area per mouse for KC and KC/Pd mice fed with the GW diet for 3 days (n = 8 per group). f Percentage of pancreatic neoplastic area per mouse for PanIN 1-2, PanIN 3, and PDAC for KC or KC/Pd mice on the GW diet for 9 days (n = 8 per group). g Angptl4 mRNA relative expression for WT, KC and KC/Pd mice on the GW or Ctrl diet for 9 days (n = 5 biologically independent samples). hk KC and KC/PdKO mice at 6–8 weeks were fed either the GW (50 mg/kg) or the Ctrl diet for 13 weeks. h Timeline for the mice with the GW diet treatment. ik Representative photos of pancreata (i); representative images of H&E staining of pancreata and incidence rates of PDAC (bottom) (j); and percentage of pancreatic neoplastic area per mouse (k, n = 5–8 per group) for KC and KC/PdKO on the GW or Ctrl diet. Data are mean ± SEM. For (a), log-rank test, for (e), unpaired two-tailed Student’s t test, for (f), multiple t tests, and for (g, k), two-way ANOVA with Bonferroni correction. *P < .05, **P < .01, ***P < .001, and ****P < .0001. n.s.: no significance. Source data are provided as a Source Data file.
Fig. 4
Fig. 4. PPARδ promotes inflammation-related signaling pathways and KRASmu activation during pancreatic tumorigenesis.
a, b KC and KC/Pd mice at 6−8 weeks of age were fed the GW diet (50 mg/kg) for 3 days. The total RNA of pancreata from these mice was extracted for RNA-sequencing transcriptome profile analyses (n = 3−4 per group). a Heatmap of differentially expressed genes with P(Adj)<0.05 between the GW diet–treated KC (KC_GW) and KC/Pd (KC/Pd_GW) mouse groups. b Pathway enrichment results for KC/Pd_GW vs. KC_GW mice obtained by gene set enrichment analyses using R package “ClusterProfiler”, a cutoff of P(Adj)=0.05, and gene sets=MSigDB category “Hallmark gene sets”. The inflammation-related and KRAS signaling pathways are marked in a red square. c Il6 mRNA levels measured by qRT-PCR of pancreata from the KC and KC/Pd mice at 6–8 weeks of age fed the GW diet for 3 days, (n = 5–6 biologically independent samples). dm Representative images of IHC staining for p-Stat3 (Tyr705) (d, e) and their quantitative results (f, g, n = 5 biologically independent samples), Western blot for p-Stat3 and p-Erk1/2 (h, i), and IHC staining for p-Erk1/2 (j, k) and their quantitative results (l, m, n = 5 biologically independent samples) for KC and KC/Pd mice on the GW diet for 0, 3, and 9 days as described in Fig. 3b (d, f, h, j, l) or on the HFD or Ctrl for 12 weeks as described in Fig. 2b (e, g, i, k, and m). Data are mean ± SEM. For (c), unpaired two-tailed Student’s t test, and for (f), (g), (l, m), two-way ANOVA with Bonferroni correction. ***P < .001, and ****P < .0001. Source data are provided as a Source Data file.
Fig. 5
Fig. 5. PPARδ activation by GW or HFD recruits macrophages and MDSCs into the pancreata to remodel pancreatic TME.
a Representative immune cell profiling by FlowJo-tSNE (t-distributed stochastic neighbor embedding) of pancreas-infiltrating CD45+ cells, including M-MDSCs (CD11b+Ly6ChiLy6G), CD11b+Ly6ClowLy6G+ [polymorphonuclear (PMN)-MDSCs and neutrophil cells]), macrophages (CD11b+F4/80+), CD3+CD4+ cells, CD3+CD8+ T cells, and B cells in KC and KC/Pd mice fed the GW diet (50 mg/kg). bd Quantitative results for macrophages (b), CD11b+Ly6ClowLy6G+ cells (c), and M-MDSCs (d) for the indicated mouse groups (n = 5–6). e, f Representative IHC staining images of macrophages (F4/80+) (e) and their quantitative results (f) for KC/Pd mice on the GW diet (n = 5). g Representative flow cytometry images and quantitative results of the pancreas-infiltrating Ly6Clow inflammatory macrophages with low MHC-II expression (M2-TAMs). h Quantitative results of CD8+ T cells (n = 5–6). ik Quantitative results of the indicated immune cells in pancreas-infiltrating CD45+ cells (i, n = 3), and representative IHC staining images of macrophages (F4/80+) (j) and their quantitative results (k) in pancreata for KC and KC/Pd mice fed the HFD or Ctrl for 12 weeks (n = 5). l, m Representative IHC staining images of macrophages (F4/80+) (l) and their quantitative results (m) in pancreata for KC and KC/PdKO mice fed the GW for 13 weeks (n = 5). n, o Representative IHC staining images of macrophages (F4/80+) (n) and their quantitative results (o) in pancreata for KC and KC/PdKO mice fed HFD for 26 weeks (n = 5). p, q Il6 protein expression levels in the pancreata of KC and KC/Pd on the GW diet for 0, 3, or 9 days (p, n = 3–4) or on the HFD or Ctrl for 12 weeks (q, n = 3-4). For (bd), (h), data are mean ± SD, and for (f), (I), (k), (m), (oq), data are mean ± SEM. For (bd), (h), (I), (p), (q), multiple t-tests, for (f), one-way ANOVA with Bonferroni correction, for (k), two-way ANOVA with Bonferroni correction, and for (m, o), unpaired two-tailed Student’s t test. *P < .05, **P < .01, ***P < .001, and ****P < .0001, compared to KC mice with the same diet treatment for (bd), (h), (p, q). Source data are provided as a Source Data file.
Fig. 6
Fig. 6. PPARδ alteration directly modulates chemokine CCL2 expression in mouse and human pancreatic epithelial cells.
ac Pancreatic tissues from KC or KC/Pd mice fed the HFD or Ctrl diet; and KC/Pd mice fed the GW or Ctrl diet for 3 days (n = 3–4 biologically independent samples). Venn diagram of differentially expressed chemokines (a). Quantitative results of Ccl2 protein levels for KC/Pd mice on the GW diet (b) and KC or KC/Pd mice on the HFD (c). d Representative images of Ccl2 RNAscope in situ hybridization for normal pancreatic tissues of KC/Pd mice fed the GW or Ctrl diet for 3 days (n = 3 biologically independent samples). e Venn diagram of differentially expressed chemokines for mouse tdTomato RFP–sorted pancreatic epithelial cells of KC/tdPd mice on GW or control diet for 3 days and for the cell culture media from mouse NB490 KPC cells with WT or Ppard KO. f, g Quantitative results of Ccl2 protein levels for tdTomato-RFP+ cells (f, n = 4 biologically independent samples) and for the cell culture media from mouse NB490 KPC cells from 4 independent experiments (g). h, i Ccl2 mRNA expression levels in tdTomato-RFP+ pancreatic epithelial cells (h, n = 4 biologically independent samples) and in mouse NB490 KPC cells from 4 independent experiments (i). j Ccl2 mRNA expression levels in mouse KC and KC/Pd PDAC cells with or without GW treatment from 4 independent experiments. k, l PPARδ (k) and CCL2 (l) mRNA expression levels in human PDAC cells transfected with PPARδ siRNAs (siPPARD) or control siRNA (Ctrl) from 3 independent experiments. m The PPARδ binding to the four predicted PPARδ binding sites (pPDBS) in the mCcl2 promoter in mouse KC PDAC cells stably transduced with mouse DDK-tagged PPARδ expressing lentivirus and treated with 1 µM GW or solvent (DMSO) from 3 independent experiments. Data are mean ± SEM. For (b), (f), (h), unpaired two-tailed Student’s t test, for (c), (km), multiple t-tests, for (g), (i), one-way ANOVA with Bonferroni correction, and for (j), two-way ANOVA with Bonferroni correction. *P < .05, **P < .01, ***P < .001, and ****P < .0001. Source data are provided as a Source Data file.
Fig. 7
Fig. 7. Pharmacological inhibition of Ccr2 suppresses pancreatic tumorigenesis promoted by PPARδ-Ccl2/Ccr2-TAMs/MDSCs.
a Representative image of co-staining for Ccl2 RNAscope in situ hybridization with Ccr2 IF (top) or with F4/80 IHC (bottom) in pancreatic normal, acinar-to-ductal metaplasia (ADM), and PanIN tissues in the KC/Pd mice fed the GW diet for 3 days (n = 5 per group). b KC/Pd mice at 6–8 weeks on the GW diet (50 mg/kg) for 0, 3, or 9 days were euthanized, and then pancreatic tissues were harvested for further analyses (n = 4–6 per group). Representative images of co-IF staining of Ccr2 with F4/80 (TAMs) (top) or with Gr1 (MDSCs) (bottom). ch Ccr2 inhibitor PF4136309 (PF) or control solvent (corn oil) was administered via subcutaneous injection at 80 mg/kg twice daily to the KC/Pd mice for 4 days (n = 5 mice per group), and the mice were fed the GW diet (50 mg/kg) for the last 3 days, and then pancreatic tissues were harvested for further analyses. c Timeline for the mice with PF4136309 and GW diet treatment. d, e Representative images of H&E staining of pancreata (d) and percentage of pancreatic neoplastic area per mouse (e) for GW-fed KC/Pd mice treated with PF4136309 or Ctrl. fh Representative images of co-IF staining of Ccr2 with F4/80 (TAMs) (f, top) or with Gr1 (MDSCs) (f, bottom), and quantitative co-IF staining results of double-positive cells per 40× field for Ccr2+/F4/80+ cells (g) and Ccr2+/Gr1+ cells (h) for the indicated mice. i Schematic flow showing PPARδ hyperactivation by either the HFD or the GW diet upregulates CCL2, which chemoattracts macrophages and MDSCs into pancreata via the CCL2/CCR2 axis, leading to an inflammatory and immunosuppressive TME (e.g., IL6/STAT3) and subsequent progression of KRASmu-initiated pancreatic tumorigenesis to PDAC, while PPARD-genetic KO and a CCR2 inhibitor (PF4136309) suppress those tumorigenic effects. Data are mean ± SEM. Unpaired two-tailed Student’s t test. **P < .01, ***P < .001, and ****P < .0001. Source data are provided as a Source Data file.

References

    1. Kamisawa T, Wood LD, Itoi T, Takaori K. Pancreatic cancer. Lancet. 2016;388:73–85. doi: 10.1016/S0140-6736(16)00141-0. - DOI - PubMed
    1. Hruban RH, et al. Pancreatic intraepithelial neoplasia: a new nomenclature and classification system for pancreatic duct lesions. Am. J. Surg. Pathol. 2001;25:579–586. doi: 10.1097/00000478-200105000-00003. - DOI - PubMed
    1. Matsuda, Y. et al. The prevalence and clinicopathological characteristics of high-grade pancreatic intraepithelial neoplasia: autopsy study evaluating the entire pancreatic parenchyma. Pancreas46, 658–664 (2017). - PubMed
    1. Andea A, Sarkar F, Adsay VN. Clinicopathological correlates of pancreatic intraepithelial neoplasia: a comparative analysis of 82 cases with and 152 cases without pancreatic ductal adenocarcinoma. Mod. Pathol. 2003;16:996–1006. doi: 10.1097/01.MP.0000087422.24733.62. - DOI - PubMed
    1. Singhi AD, Wood LD. Early detection of pancreatic cancer using DNA-based molecular approaches. Nat. Rev. Gastroenterol. Hepatol. 2021;18:457–468. doi: 10.1038/s41575-021-00470-0. - DOI - PubMed

Publication types