. 2022 May 13;12(1):7937.
doi: 10.1038/s41598-022-11480-6.

SARS-CoV-2 RNA and antibody dynamics in a Dutch household study with dense sampling frame

Collaborators, Affiliations

SARS-CoV-2 RNA and antibody dynamics in a Dutch household study with dense sampling frame

Wanda G H Han et al. Sci Rep. .

Abstract

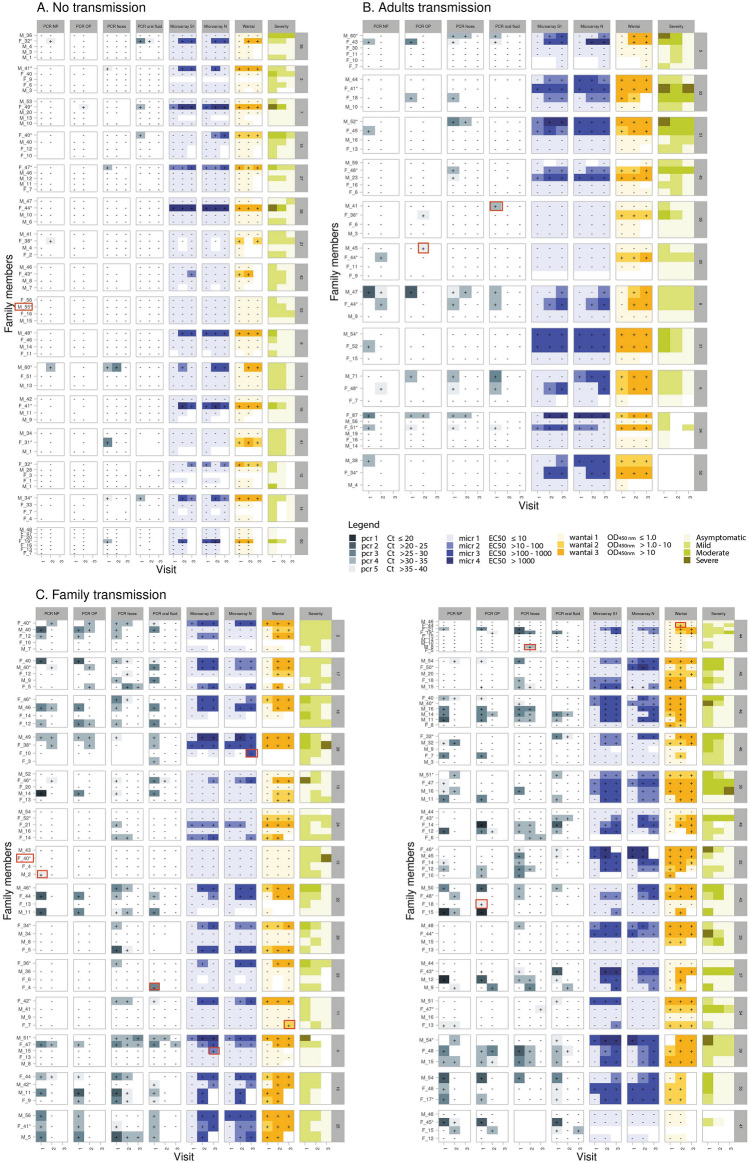
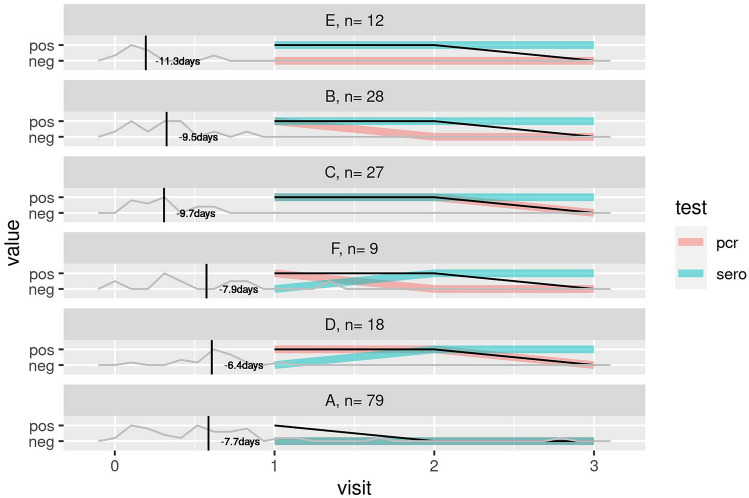
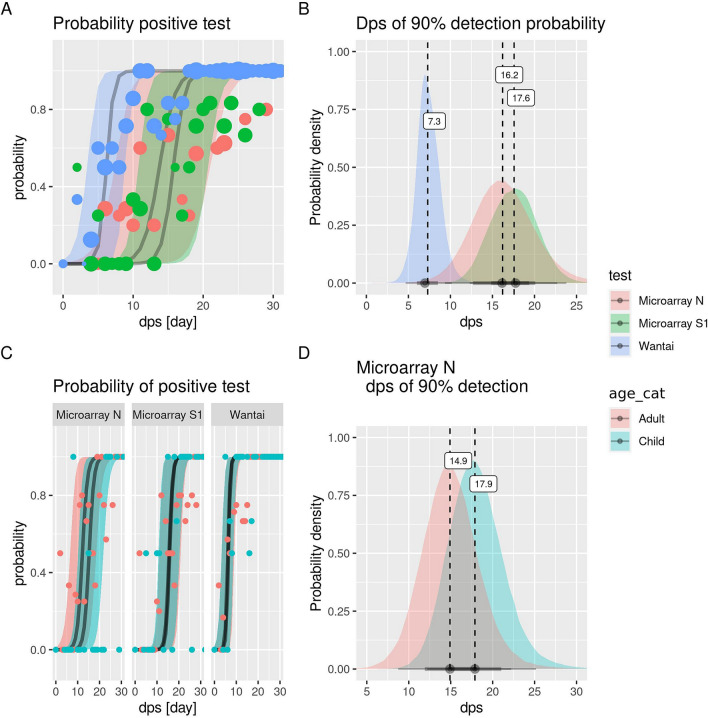
This study investigated the dynamics of SARS-CoV-2 infection and diagnostics in 242 household members of different ages and with different symptom severity after SARS-CoV-2 exposure early in the pandemic (March-April 2020). Households with a SARS-CoV-2 confirmed positive case and at least one child in the Netherlands were followed for 6 weeks. Naso (NP)- and oropharyngeal (OP) swabs, oral fluid and feces specimens were analyzed for SARS-CoV-2 RNA and serum for SARS-CoV-2-specific antibodies. The dynamics of the presence of viral RNA and the serological response was modeled to determine the sampling time-frame and sample type with the highest sensitivity to confirm or reject a SARS-CoV-2 diagnosis. In children higher viral loads compared to adults were detected at symptom onset. Early in infection, higher viral loads were detected in NP and OP specimens, while RNA in especially feces were longer detectable. SARS-CoV-2-specific antibodies have 90% probability of detection from 7 days (total Ig) and 18 days (IgG) since symptom onset. For highest probability of detection in SARS-CoV-2 diagnostics early in infection, RT-PCR on NP and OP specimens are more sensitive than on oral fluid and feces. For SARS-CoV-2 diagnostics late after infection, RT-PCR on feces specimens and serology are more valuable.


Conflict of interest statement

The authors declare no competing interests.

Figures

Figure 1
Figure 1
Various transmission patterns of SARS-CoV-2 infection based on different assays and specimen types collected at visits 1, 2 and 3 in households visualized in heatmaps. (A) households with no transmission. (B) household with only transmission in adults. (C) heatmaps of household with transmission in children and possibly also adults. Symptoms can be unrelated to a SARS-CoV-2 infection. On the left side, Male (M) or female (F) and age of the participant is indicated. * Index case. Blanks = not available/tested. Red rectangle: individual with only one test positive on one timepoint. On the right side the Household ID (number) is indicated.
Figure 2
Figure 2
Symptom severity of COVID-19 index cases in the households. The GLM (generalized linear model) revealed that there were less individuals in the "Severe" category than in the "Mild" category (p = 0.1), and that households in "Family transmission" category was overrepresented in the "Severe" category (p = 0.03). There were no asymptomatic index cases. Maximum severity score of index is used.
Figure 3
Figure 3
(A) Overview of the (combination of) various positive SARS-CoV-2 infection diagnosis in the 242 participants of the study cohort for all various diagnostic assays or specimens. All available RT-PCR and serology outcomes (Table 1) were incuded in these analyses.The black dots indicate a positive test at any (or multiple) moment(s) during the study, except for ‘Inclusion PCR NP + OP’ which was performed in index cases just before start of the study. The number of individuals with a particular combination of positive tests are indicated in the top of the figure. The numbers at the right after each test indicates the overall number of positive tests. (B) The number of individuals with a positive or negative tests or missing data for serological and molecular (PCR) diagnostics combined. In brackets the number of symptomatic or severe symptomatic individuals, respectively, are indicated. Color intensity is related to the frequency.
Figure 4
Figure 4
Common SARS-CoV-2 infection dynamics patterns, based on the presence or absence of a positive or negative RT-PCR or serological assay at visit 1, 2 and 3. Common patterns were named A–F based on frequency, with the number of individuals (n) displaying the pattern indicated. The median timing of onset of symptoms relative to visit 1 is indicated on the left. The black line indicates whether on average symptoms were reported at visit 1, 2 or 3.
Figure 5
Figure 5
Dynamics SARS-CoV-2 infection diagnosis by RT-PCR in various specimens since symptoms onset (dps). All available RT-PCR outcomes (Table 1) were incuded in these analyses. (A) Predicted viral load (Ct values RT-PCR) in relation to dps and specimen type. The shadow indicates the 95% Bayesian confidence interval and the dotted lines indicate the prediction interval (variation over individuals). (B) and (C) Ct-value distribution at day symptom onset (intercept) and increase of Ct-value per day (slope) in relation to age category (B) and different specimens (C). (D) Average dps until when different specimens have at least 90% detection probability.
Figure 6
Figure 6
Dynamics of SARS-CoV-2 infection diagnosis by different serological assays. All available serology outcomes (Table 1) were incuded in these analyses. Probability of SARS-CoV-2-specific antibody detection (A) and average dps from when the Wantai (Spike-specific IgM and IgG), microarray S1 (Spike-specific IgG) and microarray N (Nucleoprotein-specific IgG) assays have at least 90% detection probability (B) for all ages. (C) Probability of SARS-CoV-2-specific antibody detection by Wantai, microarray S1 and microarray N in adults and children (D) Average dps from when microarray N has at least 90% detection probability for adults and children. The shadows in (C) and (D) indicate the 95% Bayesian confidence interval.

References

    1. World Health Organization (WHO). Timeline of WHO's response to COVID-19. https://www.who.int/news/item/29-06-2020-covidtimeline.
    1. Minister Bruno Bruins MIvE, Minister Arie Slob, Minister Tamara van Ark. Kamerbrief met nieuwe aanvullende maatregelen om de COVID 19 uitbraak te bestrijden. Medische Zorg en Sport OCeW, Basis- en Voortgezet Onderwijs en Media, Sociale Zaken en Werkgelegenheid. Den Haag, 15 March 2020.
    1. Reukers, D. F. M., van Boven, M., Meijer, A., Rots, N., Reusken, C., Roof, I. et al. High infection secondary attack rates of SARS-CoV-2 in Dutch households revealed by dense sampling. Clin. Infect. Dis. (2021). - PMC - PubMed
    1. WHO. Clinical management of COVID-19 (2020).
    1. Corman VM, Landt O, Kaiser M, Molenkamp R, Meijer A, Chu DK, et al. Detection of 2019 novel coronavirus (2019-nCoV) by real-time RT-PCR. Euro Surveill. 2019;2020:25. - PMC - PubMed

Publication types

LinkOut - more resources