Observational Study
. 2022 May 13;12(1):7917.
doi: 10.1038/s41598-022-11939-6.

Improving the design stage of air pollution studies based on wind patterns

Affiliations
Observational Study

Improving the design stage of air pollution studies based on wind patterns

Léo Zabrocki et al. Sci Rep. .

Abstract

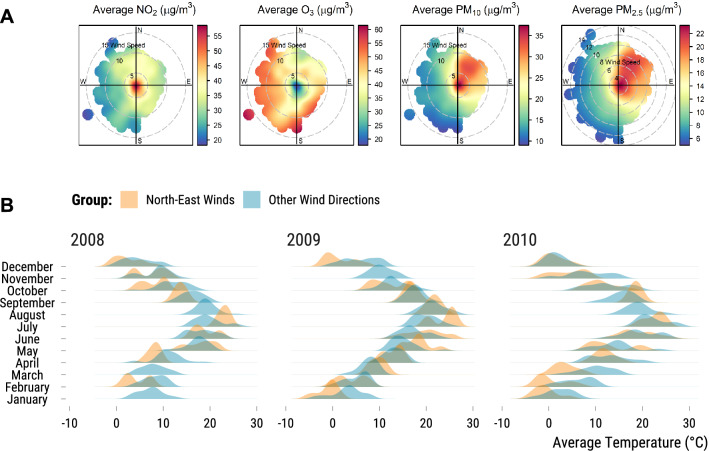
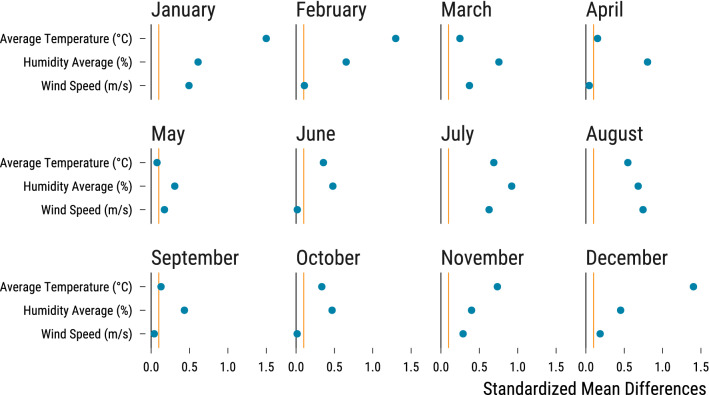
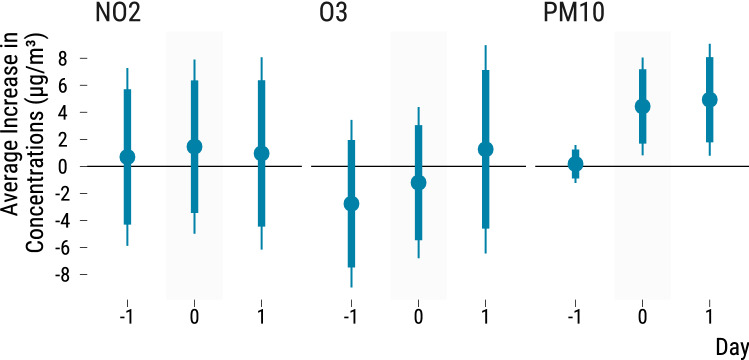
A growing literature in economics and epidemiology has exploited changes in wind patterns as a source of exogenous variation to better measure the acute health effects of air pollution. Since the distribution of wind components is not randomly distributed over time and related to other weather parameters, multivariate regression models are used to adjust for these confounding factors. However, this type of analysis relies on its ability to correctly adjust for all confounding factors and extrapolate to units without empirical counterfactuals. As an alternative to current practices and to gauge the extent of these issues, we propose to implement a causal inference pipeline to embed this type of observational study within an hypothetical randomized experiment. We illustrate this approach using daily data from Paris, France, over the 2008-2018 period. Using the Neyman-Rubin potential outcomes framework, we first define the treatment of interest as the effect of North-East winds on particulate matter concentrations compared to the effects of other wind directions. We then implement a matching algorithm to approximate a pairwise randomized experiment. It adjusts nonparametrically for observed confounders while avoiding model extrapolation by discarding treated days without similar control days. We find that the effective sample size for which treated and control units are comparable is surprisingly small. It is however reassuring that results on the matched sample are consistent with a standard regression analysis of the initial data. We finally carry out a quantitative bias analysis to check whether our results could be altered by an unmeasured confounder: estimated effects seem robust to a relatively large hidden bias. Our causal inference pipeline is a principled approach to improve the design of air pollution studies based on wind patterns.


Conflict of interest statement

The authors declare no competing interests.

Figures

Figure 1
Figure 1
Polar plots of air pollutant concentrations predicted by wind components and average temperature imbalance of wind directions by year and month. In panel (A), each plot represents the concentrations (in μg/m3) of an air pollutant that were predicted using a generalized additive model based on a smooth isotropic function of the two wind components u and v. The direction from which the wind blows is described on a 360 compass rose and wind speed (in m/s) is represented by a series of increasing circles starting from the intersection of the two cardinal directions axes where wind speed is null: the farther the circle is away from the intersection, the faster the wind speed is. In panel (B), the density distribution of the average temperature (in C) is drawn for North-East winds (orange colour) and other wind directions (blue colour). The figure is divided into subplots by month and year (2008–2010).
Figure 2
Figure 2
Map of road network and location of air pollution measuring stations in Paris, France . Grey lines represent the road network. The orange line is the orbital ring surrounding Paris. Blue crosses are the locations of air pollution measuring stations. NO2 concentrations are measured at stations PA07, PA12, PA13, PA18; O3 concentrations at PA13, PA18; PM10 at PA18; PM2.5 at PA01H and PA04C. The map was created with the R programming language (version 4.1.0), data were provided by OpenStreetMap and retrieved with the osmdata package.
Figure 3
Figure 3
Evidence of imbalance for weather covariates . For each month, we compute the absolute standardized differences for continuous weather covariates between treated and control groups. These differences are represented as blue points. The vertical orange line is the 0.1 threshold which is used in the matching literature to spot covariates imbalance. The vertical black line is at 0.
Figure 4
Figure 4
Overall balance improvement in continuous and categorical covariates . In Panel (A), we plot, before and after matching, the absolute standardized differences in continuous covariates between treated and control groups. Each blue dot represents an absolute mean difference for a given covariate. In panel (B), we plot, before and after matching, the absolute difference in percentage points for categorical covariates.
Figure 5
Figure 5
Effects of North-East winds on air pollutant concentrations . In each panel, we plot the estimated effects of North-East winds on air pollutant concentrations for the previous, current and following days. Point estimates are depicted by blue points; blue thick lines are 95% confidence intervals and thin lines are 99% confidence intervals. The 95% and 99% confidence intervals associated with the estimated average difference in PM10 in the first lag are smaller than other intervals for the following days since we added a constraint in the matching procedure for this lag of the air pollutant.

Similar articles

Cited by

References

    1. Schlenker W, Walker WR. Airports, air pollution, and contemporaneous health. Rev. Econ. Stud. 2016;83(2):768–809. doi: 10.1093/restud/rdv043. - DOI
    1. Arceo E, Hanna R, Oliva P. Does the effect of pollution on infant mortality differ between developing and developed countries? Evidence from Mexico City. Econ. J. 2016;126(591):257–280. doi: 10.1111/ecoj.12273. - DOI
    1. Schwartz J, Bind M-A, Koutrakis P. Estimating causal effects of local air pollution on daily deaths: Effect of low levels. Environ. Health Perspect. 2017;125(1):23–29. doi: 10.1289/EHP232. - DOI - PMC - PubMed
    1. Schwartz J, Fong K, Zanobetti A. A national multicity analysis of the causal effect of local pollution, no 2, and pm 2.5 on mortality. Environ. Health Perspect. 2018;126(8):087004. doi: 10.1289/EHP2732. - DOI - PMC - PubMed
    1. Halliday TJ, Lynham J, de Paula A. Vog: Using volcanic eruptions to estimate the health costs of particulates. Econ. J. 2019;129(620):1782–1816. doi: 10.1111/ecoj.12609. - DOI

Publication types