Clinical Trial
. 2022 May 13;10(1):77.
doi: 10.1186/s40168-022-01248-5.

Elucidating the role of the gut microbiota in the physiological effects of dietary fiber

Affiliations
Clinical Trial

Elucidating the role of the gut microbiota in the physiological effects of dietary fiber

Edward C Deehan et al. Microbiome. .

Abstract

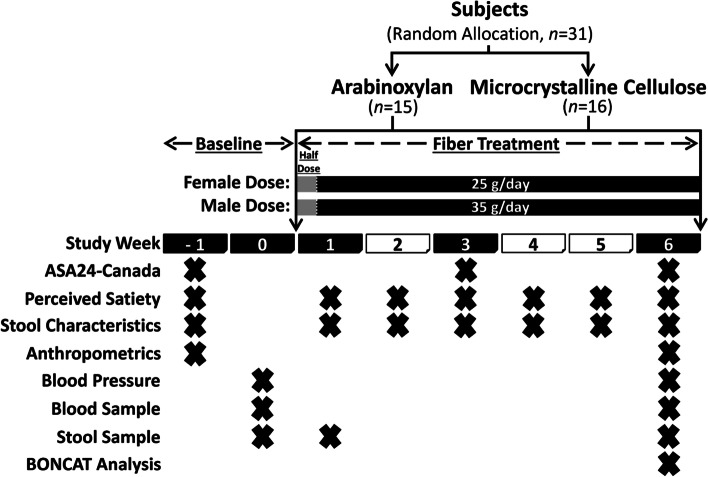
Background: Dietary fiber is an integral part of a healthy diet, but questions remain about the mechanisms that underlie effects and the causal contributions of the gut microbiota. Here, we performed a 6-week exploratory trial in adults with excess weight (BMI: 25-35 kg/m2) to compare the effects of a high-dose (females: 25 g/day; males: 35 g/day) supplement of fermentable corn bran arabinoxylan (AX; n = 15) with that of microbiota-non-accessible microcrystalline cellulose (MCC; n = 16). Obesity-related surrogate endpoints and biomarkers of host-microbiome interactions implicated in the pathophysiology of obesity (trimethylamine N-oxide, gut hormones, cytokines, and measures of intestinal barrier integrity) were assessed. We then determined whether clinical outcomes could be predicted by fecal microbiota features or mechanistic biomarkers.

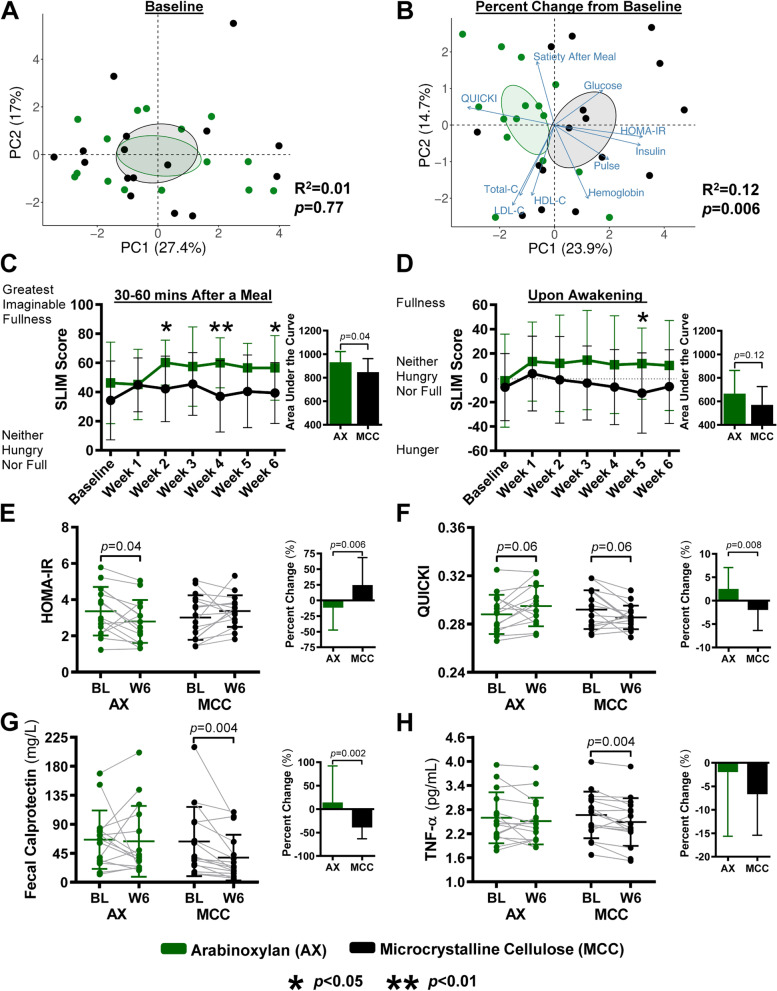
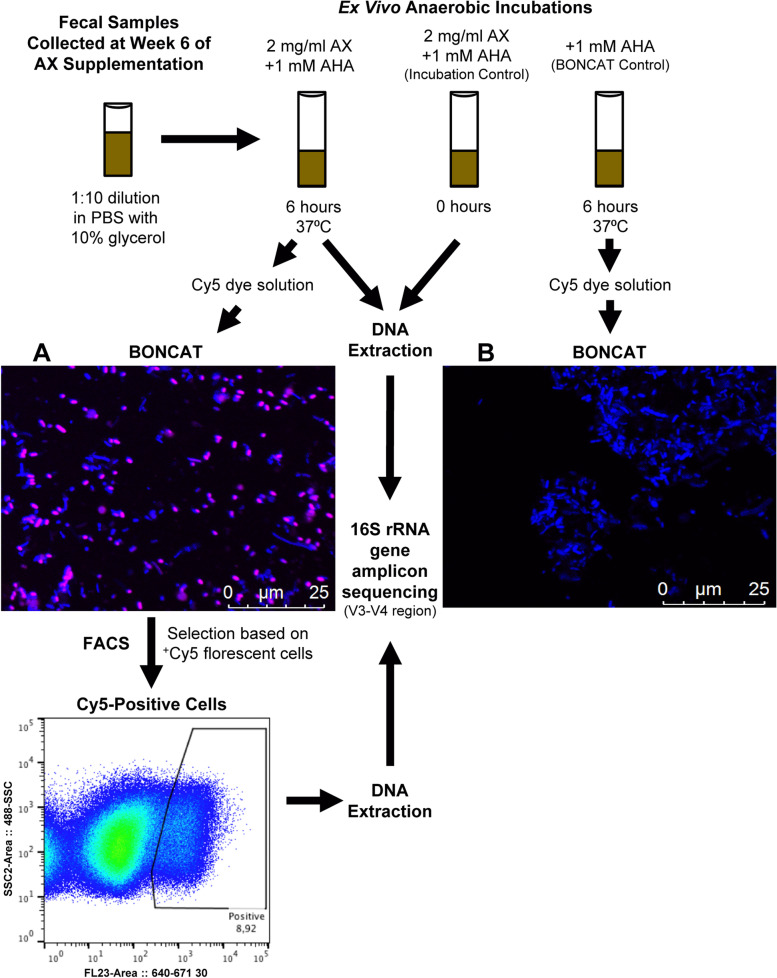
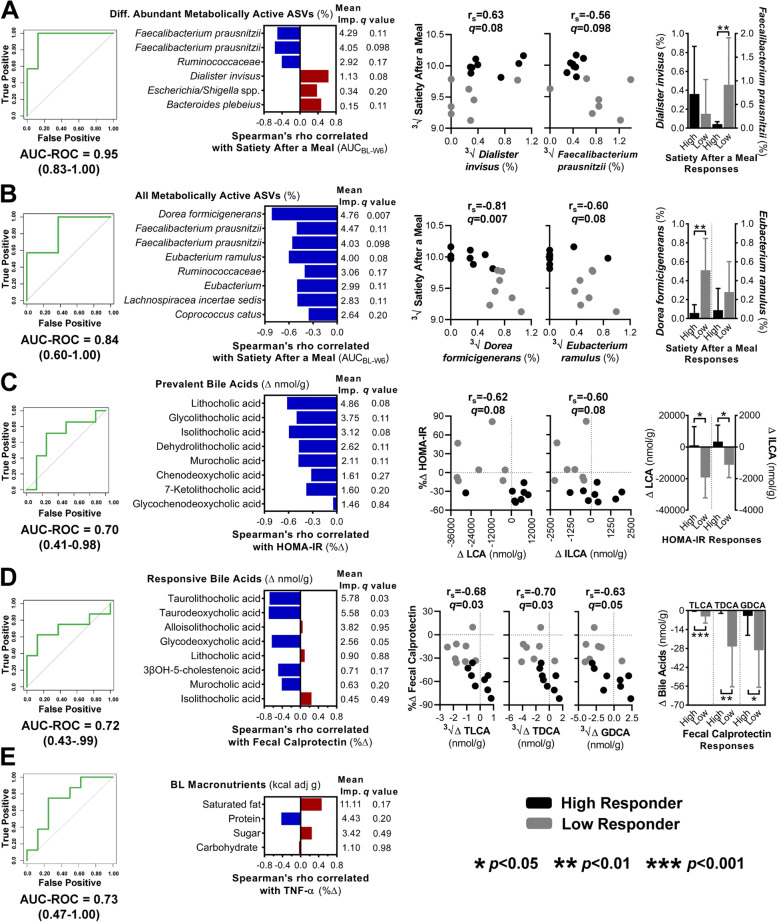
Results: AX enhanced satiety after a meal and decreased homeostatic model assessment of insulin resistance (HOMA-IR), while MCC reduced tumor necrosis factor-α and fecal calprotectin. Machine learning models determined that effects on satiety could be predicted by fecal bacterial taxa that utilized AX, as identified by bioorthogonal non-canonical amino acid tagging. Reductions in HOMA-IR and calprotectin were associated with shifts in fecal bile acids, but correlations were negative, suggesting that the benefits of fiber may not be mediated by their effects on bile acid pools. Biomarkers of host-microbiome interactions often linked to bacterial metabolites derived from fiber fermentation (short-chain fatty acids) were not affected by AX supplementation when compared to non-accessible MCC.

Conclusion: This study demonstrates the efficacy of purified dietary fibers when used as supplements and suggests that satietogenic effects of AX may be linked to bacterial taxa that ferment the fiber or utilize breakdown products. Other effects are likely microbiome independent. The findings provide a basis for fiber-type specific therapeutic applications and their personalization.

Trial registration: Clinicaltrials.gov, NCT02322112 , registered on July 3, 2015. Video Abstract.

Keywords: Adults; Dietary fiber; Gut microbiota; Inflammation; Insulin resistance; Obesity; Satiety.


Conflict of interest statement

Since January 2021, ECD has been an employee of AgriFiber Solutions LLC, although all statistical analyses and manuscript preparations were completed before employment. JW has received research funding and consulting fees from industry sources involved in the manufacture and marketing of dietary fibers, including AgriFiber Solutions LLC. JW is further a co-owner of Synbiotics Health, a developer of synbiotic products. These interests did not influence his judgement or presentation of study findings. All other authors declare no competing interests.

Figures

Fig. 1
Fig. 1
Study design of the randomized controlled trial. ASA24-Canada, Canadian version of the web-based Automated Self-Administered 24-hour Dietary Assessment Tool; stool characteristics, self-reported stool consistency and bowel movement frequency
Fig. 2
Fig. 2
Effects of AX and MCC supplementation on satiety and surrogate endpoints. Principal component analysis plots show A perceived satiety and surrogate endpoints at baseline and B their percentage change from baseline per AX and MCC groups. Line graphs show weekly SLIM scale ratings C 30–60 min after consuming a meal with AX or MCC and D upon awakening. Bars (insets) represent the area under the SLIM score curve (AUCBL–W6). Scatter plots show E HOMA-IR, F QUICKI, G fecal calprotectin, and H TNF-α at baseline and week 6 of AX or MCC supplementation, respectively. Bars (insets) represent the percent change from baseline values per group. To assess within-group changes relative to baseline, data were analyzed for C and D using repeated measures one-way ANOVA with permutations and for E to H using paired permutational t-tests. To assess between-group differences, data were analyzed for A and B using permutational multivariate analysis of variance based on Manhattan distance and for C to H using unpaired permutational t-tests. Statistical significance was set for A to D at p < 0.05 and for E to H at p < 0.01. Data for C to H presented as mean ± SD; for E to H symbols represent individual samples. AX, arabinoxylan; HOMA-IR, homeostatic model assessment of insulin resistance; MCC, microcrystalline cellulose; QUICKI, quantitative insulin sensitivity check index; SLIM, Satiety Labeled Intensity Magnitude; TNF-α, tumor necrosis factor-α
Fig. 3
Fig. 3
Schematic representation of the ex vivo detection assay based on BONCAT. Stool samples stored frozen were thawed, filtered, and washed in PBS and then incubated in the presence of AX and the cellular activity marker L-azidohomoalanine (AHA) to detect AX-stimulated bacterial cells. A no-amendment control, containing only AHA, was incubated to detect possible basal activity in the absence of AX. Microscopic inspection showed no BONCAT signal for all controls; thus, no basal activity was detected. AX-incubated samples were then fixed in ethanol and active cells were stained using a Cu(I)-catalyzed click reaction using a Cy5 dye solution. A and B A representative picture of fecal microbiota incubated for 6 h A with AX and B without AX (BONCAT control). Stimulated cells, shown in pink as a Cy5-positive BONCAT signal, were sorted by FACS, with all microbial cells shown in blue (DAPI stained). DNA was extracted from both sorted cells and samples at 0-h and 6-h anaerobic incubations. The 16S rRNA gene was amplified by PCR and amplicons were sequenced using the Illumina Miseq platform. AX, arabinoxylan; BONCAT, bioorthogonal non-canonical amino acid tagging; FACS, fluorescence-activated cell sorting
Fig. 4
Fig. 4
Identification of gut microbiota compositional features and biomarkers of host-microbiome interactions that predict satiety and surrogate endpoint responses by machine learning. (left) AUC-ROC curves show the performance accuracy of random forest classifiers trained to predict high-vs-low responders for: A and B perceived satiety after a meal with AX using the relative abundance of bacterial taxa activated during ex vivo incubation with AX; C HOMA-IR and D fecal calprotectin for AX and MCC, respectively, using fecal bile acid shifts; and E TNF-α for MCC using baseline intakes of calorie-adjusted macronutrients. (center) Horizontal bars represent Spearman’s correlation coefficients between endpoints and and metabolically active ASVs, C and D fecal bile acids, or E macronutrients shown to be important for predicting responses. Mean importance values were determined by random forest, which identifies factors that contribute the most to the model. (right) Scatter plots show the association between endpoints and the most discriminative microbiota-related factors that correlate with AX-induced A and B satiety after a meal and C HOMA-IR attenuation, and D MCC-induced fecal calprotectin attenuation. Vertical bar graphs show the most discriminative microbiota-related factors grouped by high- and low-responders. High-responders (black) and low-responders (gray) were defined according to the study cohort median. Statistical significance was set at p < 0.05 and FDR adjusted q values < 0.05. ∆, absolute change from baseline to week 6; %∆, percent change from baseline to week 6; 3√, cube root transformed before analysis; All ASVs, amplicon sequence variants with average relative abundances ≥ 0.15%; AX, arabinoxylan; AUC-ROC, area under the receiver operating characteristic curve; BL, baseline; Diff. Abundant ASVs, differentially abundant amplicon sequence variants among the bacterial consortia recovered by fluorescence-activated cell sorting; GDCA, glycodeoxycholic acid; HOMA-IR, homeostatic model assessment of insulin resistance; ILCA, isolithocholic acid; LCA, lithocholic acid; MCC, microcrystalline cellulose; TLCA, taurolithocholic acid; TNF-α, tumor necrosis factor-α

References

    1. Ng M, Fleming T, Robinson M, Thomson B, Graetz N, Margono C, Mullany EC, Biryukov S, Abbafati C, Abera SF, et al. Global, regional, and national prevalence of overweight and obesity in children and adults during 1980–2013: a systematic analysis for the Global Burden of Disease Study 2013. Lancet. 2014;384:766–781. doi: 10.1016/S0140-6736(14)60460-8. - DOI - PMC - PubMed
    1. Reynolds A, Mann J, Cummings J, Winter N, Mete E, Te Morenga L. Carbohydrate quality and human health: a series of systematic reviews and meta-analyses. Lancet. 2019;393:434–445. doi: 10.1016/S0140-6736(18)31809-9. - DOI - PubMed
    1. AlEssa HB, Bhupathiraju SN, Malik VS, Wedick NM, Campos H, Rosner B, Willett WC, Hu FB. Carbohydrate quality and quantity and risk of type 2 diabetes in US women. Am J Clin Nutr. 2015;102:1543–1553. doi: 10.3945/ajcn.115.116558. - DOI - PMC - PubMed
    1. Kaczmarczyk MM, Miller MJ, Freund GG. The health benefits of dietary fiber: beyond the usual suspects of type 2 diabetes mellitus, cardiovascular disease and colon cancer. Metabolism. 2012;61:1058–1066. doi: 10.1016/j.metabol.2012.01.017. - DOI - PMC - PubMed
    1. Deehan EC, Duar RM, Armet AM, Perez-Muñoz ME, Jin M, Walter J. Modulation of the gastrointestinal microbiome with nondigestible fermentable carbohydrates to improve human health. Microbiol Spectr. 2017;5:1–24. doi: 10.1128/microbiolspec.BAD-0019-2017. - DOI - PMC - PubMed

Publication types

Associated data