

DNA methylation may affect beef tenderness through signal transduction in Bos indicus
- PMID: 35562812
- PMCID: PMC9107245
- DOI: 10.1186/s13072-022-00449-4
DNA methylation may affect beef tenderness through signal transduction in Bos indicus
Abstract
Background: Beef tenderness is a complex trait of economic importance for the beef industry. Understanding the epigenetic mechanisms underlying this trait may help improve the accuracy of breeding programs. However, little is known about epigenetic effects on Bos taurus muscle and their implications in tenderness, and no studies have been conducted in Bos indicus.
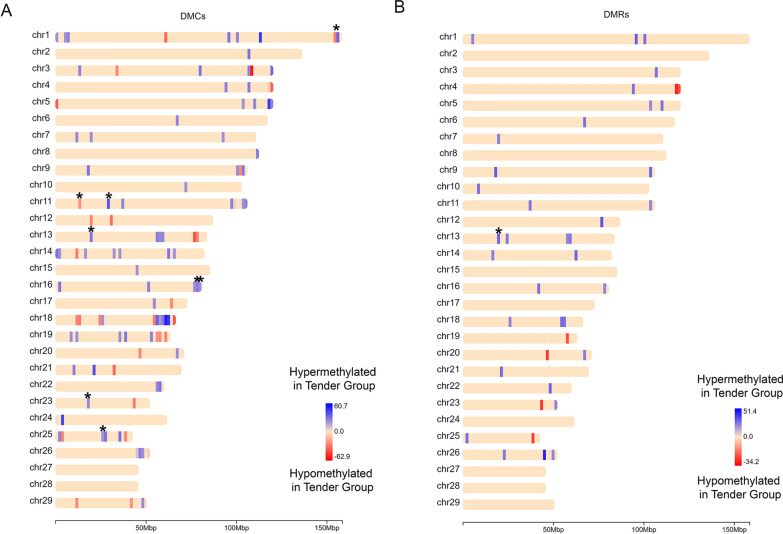
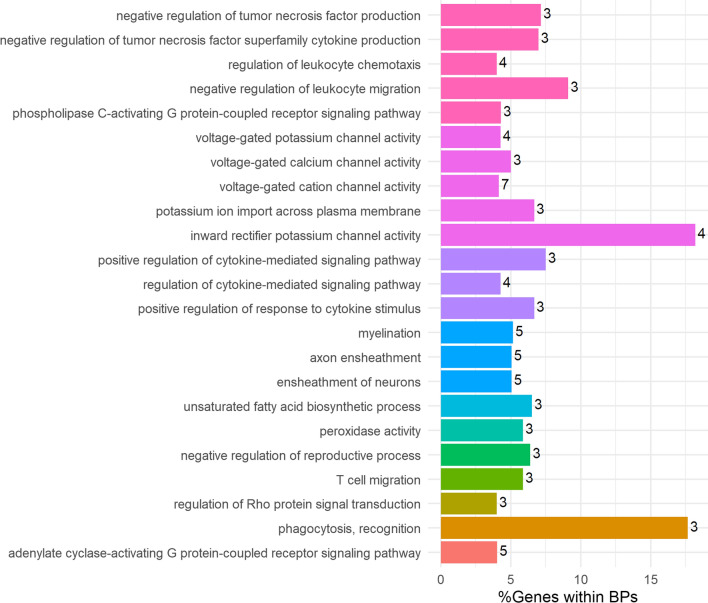
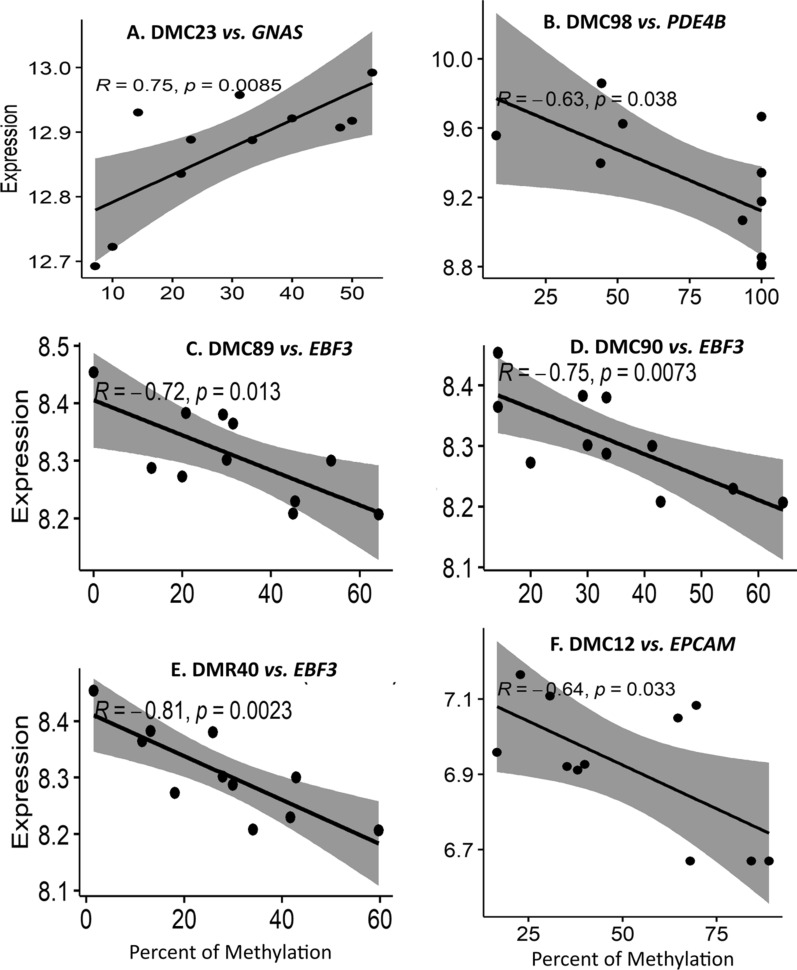
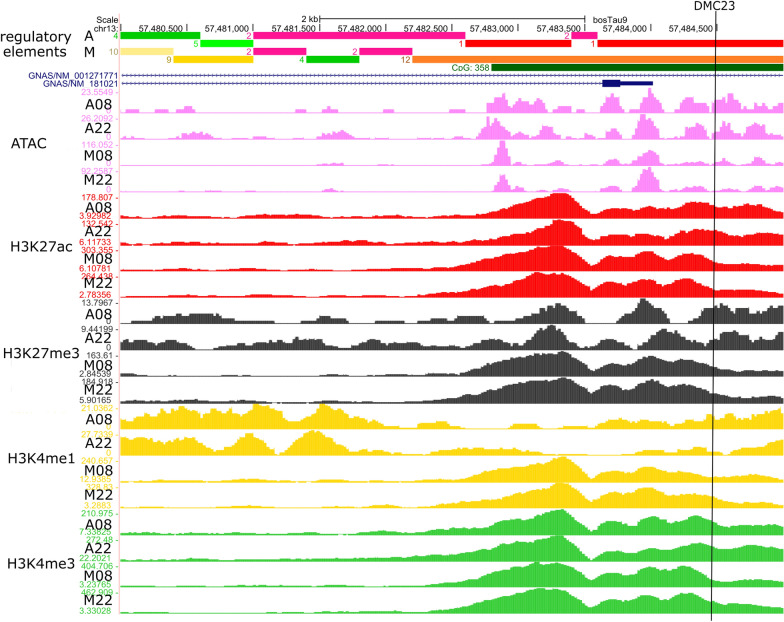
Results: Comparing methylation profile of Bos indicus skeletal muscle with contrasting beef tenderness at 14 days after slaughter, we identified differentially methylated cytosines and regions associated with this trait. Interestingly, muscle that became tender beef had higher levels of hypermethylation compared to the tough group. Enrichment analysis of predicted target genes suggested that differences in methylation between tender and tough beef may affect signal transduction pathways, among which G protein signaling was a key pathway. In addition, different methylation levels were found associated with expression levels of GNAS, PDE4B, EPCAM and EBF3 genes. The differentially methylated elements correlated with EBF3 and GNAS genes overlapped CpG islands and regulatory elements. GNAS, a complex imprinted gene, has a key role on G protein signaling pathways. Moreover, both G protein signaling pathway and the EBF3 gene regulate muscle homeostasis, relaxation, and muscle cell-specificity.
Conclusions: We present differentially methylated loci that may be of interest to decipher the epigenetic mechanisms affecting tenderness. Supported by the previous knowledge about regulatory elements and gene function, the methylation data suggests EBF3 and GNAS as potential candidate genes and G protein signaling as potential candidate pathway associated with beef tenderness via methylation.
Keywords: Cattle; EBF3; Epigenome; GNAS; Methylation; Muscle; Nelore; RRBS; Shear force.
© 2022. The Author(s).
Conflict of interest statement
The authors declare that they have no competing interests.
Figures
Similar articles
-
Genetic effects on beef tenderness in Bos indicus composite and Bos taurus cattle.J Anim Sci. 1997 Jul;75(7):1822-30. doi: 10.2527/1997.7571822x. J Anim Sci. 1997. PMID: 9222838
-
Heat shock and structural proteins associated with meat tenderness in Nellore beef cattle, a Bos indicus breed.Meat Sci. 2014 Mar;96(3):1318-24. doi: 10.1016/j.meatsci.2013.11.014. Epub 2013 Nov 22. Meat Sci. 2014. PMID: 24342181
-
Effect of marbling degree on beef palatability in Bos taurus and Bos indicus cattle.J Anim Sci. 1994 Dec;72(12):3145-51. doi: 10.2527/1994.72123145x. J Anim Sci. 1994. PMID: 7759364
-
Challenges and opportunities of using Bos indicus cattle to meet consumers' demand for quality beef.Meat Sci. 2024 Jan;207:109375. doi: 10.1016/j.meatsci.2023.109375. Epub 2023 Oct 29. Meat Sci. 2024. PMID: 37924645 Review.
-
Connecting Heat Tolerance and Tenderness in Bos indicus Influenced Cattle.Animals (Basel). 2022 Jan 18;12(3):220. doi: 10.3390/ani12030220. Animals (Basel). 2022. PMID: 35158544 Free PMC article. Review.
Cited by
-
Comparative epigenome analysis using Infinium DNA methylation BeadChips.Brief Bioinform. 2023 Jan 19;24(1):bbac617. doi: 10.1093/bib/bbac617. Brief Bioinform. 2023. PMID: 36617464 Free PMC article.
-
Long non-coding RNA (LncRNA) and epigenetic factors: their role in regulating the adipocytes in bovine.Front Genet. 2024 Oct 3;15:1405588. doi: 10.3389/fgene.2024.1405588. eCollection 2024. Front Genet. 2024. PMID: 39421300 Free PMC article. Review.
-
Differential Allele-Specific Expression Revealed Functional Variants and Candidate Genes Related to Meat Quality Traits in B. indicus Muscle.Genes (Basel). 2022 Dec 11;13(12):2336. doi: 10.3390/genes13122336. Genes (Basel). 2022. PMID: 36553605 Free PMC article.
-
Genome-Wide DNA Methylation Differences between Bos indicus and Bos taurus.Animals (Basel). 2023 Jan 5;13(2):203. doi: 10.3390/ani13020203. Animals (Basel). 2023. PMID: 36670743 Free PMC article.
References
-
- Judge MM, Conroy S, Hegarty PJ, Cromie AR, Fanning R, Kelly D, et al. Eating quality of the longissimus thoracis muscle in beef cattle – Contributing factors to the underlying variability and associations with performance traits. Meat Sci. 2021;172:108371. doi: 10.1016/j.meatsci.2020.108371. - DOI - PubMed
-
- USDA USD of A. Livestock and Poultry: World Markets and Trade. 2021. https://apps.fas.usda.gov/psdonline/circulars/livestock_poultry.pdf
Publication types
MeSH terms
LinkOut - more resources
Full Text Sources
Molecular Biology Databases
Miscellaneous
