. 2022 Jul;52(7):1171-1189.
doi: 10.1002/eji.202149480. Epub 2022 May 29.

Follicular helper T cell signature of replicative exhaustion, apoptosis, and senescence in common variable immunodeficiency

Affiliations

Follicular helper T cell signature of replicative exhaustion, apoptosis, and senescence in common variable immunodeficiency

Giulia Milardi et al. Eur J Immunol. 2022 Jul.

Erratum in

  • Correction.
    [No authors listed] [No authors listed] Eur J Immunol. 2023 Aug;53(8):e2370085. doi: 10.1002/eji.202370085. Eur J Immunol. 2023. PMID: 37565433 Free PMC article. No abstract available.

Abstract

Common variable immunodeficiency (CVID) is the most frequent primary antibody deficiency whereby follicular helper T (Tfh) cells fail to establish productive responses with B cells in germinal centers. Here, we analyzed the frequency, phenotype, transcriptome, and function of circulating Tfh (cTfh) cells in CVID patients displaying autoimmunity as an additional phenotype. A group of patients showed a high frequency of cTfh1 cells and a prominent expression of PD-1 and ICOS as well as a cTfh mRNA signature consistent with highly activated, but exhausted, senescent, and apoptotic cells. Plasmatic CXCL13 levels were elevated in this group and positively correlated with cTfh1 cell frequency and PD-1 levels. Monoallelic variants in RTEL1, a telomere length- and DNA repair-related gene, were identified in four patients belonging to this group. Their blood lymphocytes showed shortened telomeres, while their cTfh were more prone to apoptosis. These data point toward a novel pathogenetic mechanism in CVID, whereby alterations in DNA repair and telomere elongation might predispose to antibody deficiency. A Th1, highly activated but exhausted and apoptotic cTfh phenotype was associated with this form of CVID.

Keywords: B cells; Common variable immunodeficiency; Immune aging; T follicular helper cells; T-cell exhaustion.


Conflict of interest statement

The authors declare no commercial or financial conflict of interest.

Figures

Figure 1
Figure 1
Flow chart showing the different studies performed in peripheral blood of a cohort of 27 patients (16 adults and 11 pediatrics) with CVID.
Figure 2
Figure 2
Flow cytometry analysis of circulating follicular helper T (cTfh) cells and their subsets in peripheral blood samples from common variable immunodeficiency and autoimmunity (CVID) patients with respect to controls (HC). (A) Representative flow cytometry plots for Tfh (CXCR5+CD4+), follicular Treg (FoxP3+CXCR5), and conventional Treg (CXCR5CD4+), gated on singlets lymphocytes, CD3+CD14CD8CD19. Percentages of cTfh (B), cTfr (C), cTfh:cTfr ratio (D), and cTfh subsets in peripheral blood of CVID patients compared to age‐matched HC. From left to right: (E) frequencies of cTfh1 subset (CXCR3+ CCR6), (F) cTfh17 (CXCR3 CCR6+), (G) cTfh2 (CXCR3 CCR6). Data are pooled from more than 10 independent experiments (CVID n = 27, HD n = 106). In all graphs, dots represent individual donors and asterisks indicate statistical significance as calculated by Mann–Whitney test. Black bars: median with interquartile range. *p < 0.05; **p < 0.005; ***p < 0.001; ****p < 0.0001.
Figure 3
Figure 3
Programmed death (PD)‐1 Inducible co‐stimulator (ICOS) expression analysis on circulating Tfh cells in CVID patients compared to HC. Same donors as in Fig. 2 were analyzed. (A) Representative flow cytometry plots show PD‐1 frequency on CVID patients and pediatric HC. (B,C) Percentages of PD‐1 and ICOS on total cTfh. (D) Frequencies of Highly Functional cTfh (CXCR3 PD‐1+ CXCR5+ CD4+) cells. (E) CXCL13 levels (pg/mL) measured by ELISA assay in plasma of CVID patients compared to HC. Dots represent individual donors and asterisks indicate statistical significance as calculated by Mann–Whitney test. Black bars: median with interquartile range. *p < 0.05; **p < 0.005; ***p < 0.001; ****p < 0.0001. (F–H) Correlation analysis between CXCL13 plasma levels and frequencies of cTfh1, cTfh17, PD‐1+ on cTfh in CVID patients. Frequencies were analyzed by flow cytometry. Lines represent linear regression and SD. *p < 0.05; **p < 0.005; ***p < 0.001; ****p < 0.0001.
Figure 4
Figure 4
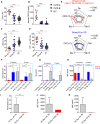
Two major categories of CVID patients based on Tfh‐related markers. (A–D) Percentages of cTfh1, CXCL13, cTfh17, and PD‐1 divide CVID patients in two groups: Group A cTfh1hiTfh17loPD‐1hiCXCL13hi vs. Group B cTfh1/Tfh17/PD‐1/CXCL13normal. (E) Radar charts represent the percentage of cTfh, cTfh1, cTfh17, PD‐1, and CXCL13 in CVID Group A vs. CVID Group B. (F) Frequency of plasmablasts (CD38hi CD20 CD19+) after 1‐week co‐culture of autologous B memory (BM) and B naïve (BN) cells with autologous cTfh cells in CVID patients (donors per group A n = 6, and group B n = 6) compared to HC (n = 6). Data are pooled for five independent experiments. (G,H) IgG and IgM measured in ng/mL by ELISA assay in the supernatant of co‐cultures after 1 week. (I) Percentages of plasmablasts (CD38hi CD20 CD19+) after 1 week co‐culture of autologous Tfh with heterologous BN cells in CVID patients of Group A (n = 4) and Group B (n = 6) compared to HC (n = 14). (J,K) IgG and IgM production analyzed in ng/mL by ELISA assay in the supernatant of co‐culture between autologous Tfh with heterologous BN cells in Group A patient (n = 1) compared to HC (n = 16). Data are pooled from more than 10 independent experiments. Percentages were analyzed by flow cytometry. In all graphs, red dots and red bars represent individual donors of Group A, and blue dots and blue bars individual donors of Group B. Asterisks indicate statistical significance as calculated by Mann–Whitney test. Comparisons among > 2 groups were performed using the ANOVA test. Black bars: median with interquartile range. *p < 0.05; **p < 0.005; ***p < 0.001; ****p < 0.0001.
Figure 5
Figure 5
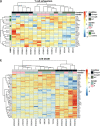
Transcriptomic landscape of sorted CD4+CXCR5+CD25 cTfh cells in CVID Group A (n = 6) vs. Group B (n = 5) patients vs. HC (n = 4) and their apoptotic profile. (A) Vulcano plots representing the gene expression profile of Group A (n = 6) vs Group B (n = 5) and Group A vs HC (n = 4). (B) Hierarchical grouping analysis based on Tfh‐related genes divides patients into Tfh‐highly active (Group A, n = 6) and normal (Group B, n = 5). Hierarchical grouping analysis representing the expression of genes involved in (C) T cell activation, (D) T cell exhaustion, and (E) cell death pathways. In the volcano plots and heat maps, red color intensities represent a higher gene expression. Data are pooled from more than three independent experiments.
Figure 5
Figure 5
Transcriptomic landscape of sorted CD4+CXCR5+CD25 cTfh cells in CVID Group A (n = 6) vs. Group B (n = 5) patients vs. HC (n = 4) and their apoptotic profile. (A) Vulcano plots representing the gene expression profile of Group A (n = 6) vs Group B (n = 5) and Group A vs HC (n = 4). (B) Hierarchical grouping analysis based on Tfh‐related genes divides patients into Tfh‐highly active (Group A, n = 6) and normal (Group B, n = 5). Hierarchical grouping analysis representing the expression of genes involved in (C) T cell activation, (D) T cell exhaustion, and (E) cell death pathways. In the volcano plots and heat maps, red color intensities represent a higher gene expression. Data are pooled from more than three independent experiments.
Figure 6
Figure 6
Flow cytometry analysis of apoptotic and senescent cells. (A) Representative gating strategy for live (ANN V PI), early apoptotic (ANN V+ PI), late apoptotic (ANN V+ PI+), and dead cells (ANN V PI+) after singlet selection and debris exclusion. (B) Flow cytometric analysis of live, early and late apoptotic, and dead cTfh, cTconv, and naïve cT cells. Data are shown as fold change from HC of the same experiment [(% CVID − % HC) / % HC]. Two independent experiments were performed with 1–2 HC and CVID donors each. (C–D) C12FDG (C) and p16 (D) indicate the percentage of senescent cells in CVID patients compared to HC. C12FDG and p16 stainings were performed on sorted T naïve, Tconv, and Tfh cells from peripheral blood. Asterisks indicate statistical significance as calculated by Mann–Whitney test. Comparisons among > 2 groups were performed using the ANOVA test. Black bars: median with interquartile range. *p < 0.05; **p < 0.005; ***p < 0.001; ****p < 0.0001.
Figure 7
Figure 7
Telomere length and gene expression analysis in CVID patients. (A) Nomogram of Telomere Length (TL) in lymphocytes from three CVID patients of Group A, with percentile lines as annotated. Black dots represent CVID patients. Red, green, and blue slopes represent expected telomere length for the indicated proportion of HC. (B,C) Hierarchical grouping analysis of genes involved in telomere elongation and DNA damages pathways clusterize patients into Group A and Group B. Red color intensities represent a higher gene expression. (D) RTEL1 expression was assessed in sorted Tfh cells, CBs, and CCs from tonsillar samples (n = 3 donors). The average for technical duplicates was estimated, normalized on HPRT as a housekeeping gene, and represented as dark circles; HPRT expression (set at 1) is represented by the dotted line; mean and SD are also shown. Data are pooled from more than three independent experiments.
Figure 8
Figure 8
Germinal center detection in the patient's spleen. (A) Spleen histopathology of CVID003 patient with RTEL1 mutation. GCs revealed an increased number of Tfh as evidenced by CXCL13 (arrowhead) and PD‐1 staining (dotted grey circle). Original magnification 400×. (B) Percentages of CD19+ B cells and their subsets: memory (CD19+CD27+) B cells, CD21lo B cells, plasma cells (CD38+CD24), transitional B cells (CD38hiCD24hi), IgA+CD27+, IgG+CD27, IgG+CD27+. (C) Frequencies of GC B cells expressing the proliferation markers as Ki67 and Bcl‐6. (D) Percentages of CD4+CXCR5+ Tfh, and Tfh expressing PD‐1, CD57 and Bcl‐6 and Ki67 as proliferation marker in the spleen of CVID003 patient compared to age‐matched HC. Percentages were analyzed by flow cytometry. Dots represent individual donors. Statistical significance was calculated by Mann–Whitney test.

References

    1. Chapel, H. , Lucas, M. , Lee, M. , Bjorkander, J. , Webster, D. , Grimbacher, B. , Fieschi, C. et al., Common variable immunodeficiency disorders: division into distinct clinical phenotypes. Blood. 2008. 112: 277–286. - PubMed
    1. Tam, J. S. and Routes, J. M. Common variable immunodeficiency. Am. J. Rhinol. Allergy. 2013. 27: 260–265. - PMC - PubMed
    1. Fieschi, C. , Malphettes, M. and Galicier, L. Adult‐onset primary hypogammaglobulinemia. Presse. Med. 2006. 35: 887–894. - PubMed
    1. Gathmann, B. , Mahlaoui, N. , Gérard, L. , Oksenhendler, E. , Warnatz, K. , Schulze, I. , Kindle, G. et al., Clinical picture and treatment of 2212 patients with common variable immunodeficiency. J. Allergy. Clin. Immunol. 2014. 134: 117–137. - PubMed
    1. Wood, P. , Stanworth, S. , Burton, J. , Jones, A. , Peckham, D. G. , Green, T. , Hyde, C. et al., Recognition, clinical diagnosis and management of patients with primary antibody deficiencies: A systematic review. Clin. Exp. Immunol. 2007. 149: 410–423. - PMC - PubMed

MeSH terms

Substances

LinkOut - more resources