. 2022 Apr 19;23(9):4479.
doi: 10.3390/ijms23094479.

PCV2 and PRV Coinfection Induces Endoplasmic Reticulum Stress via PERK-eIF2α-ATF4-CHOP and IRE1-XBP1-EDEM Pathways

Affiliations

PCV2 and PRV Coinfection Induces Endoplasmic Reticulum Stress via PERK-eIF2α-ATF4-CHOP and IRE1-XBP1-EDEM Pathways

Si Chen et al. Int J Mol Sci. .

Abstract

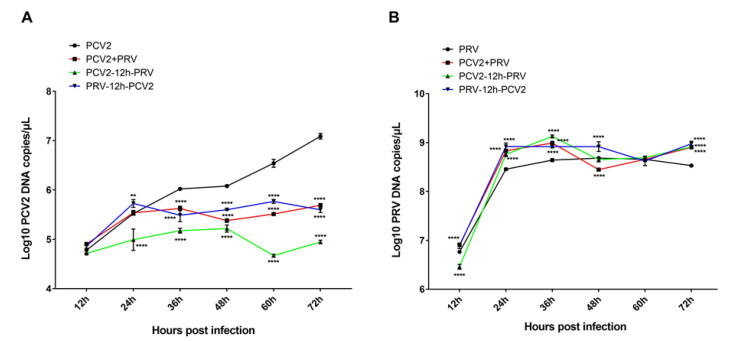
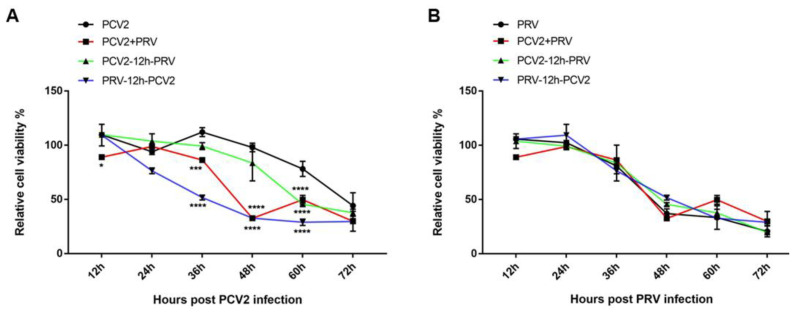
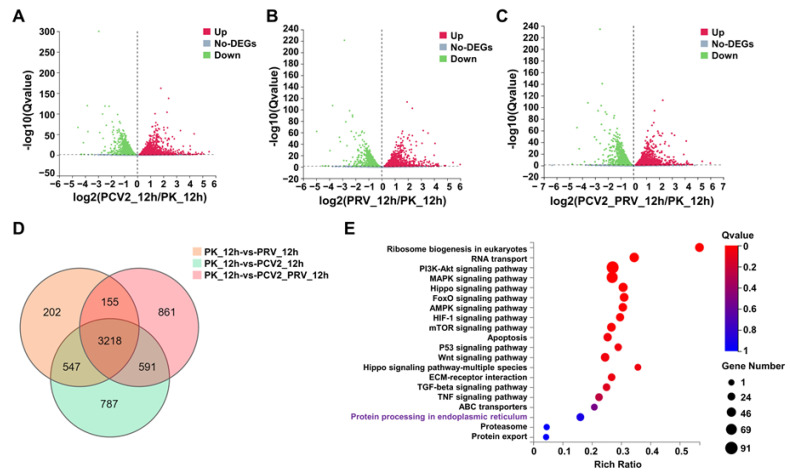
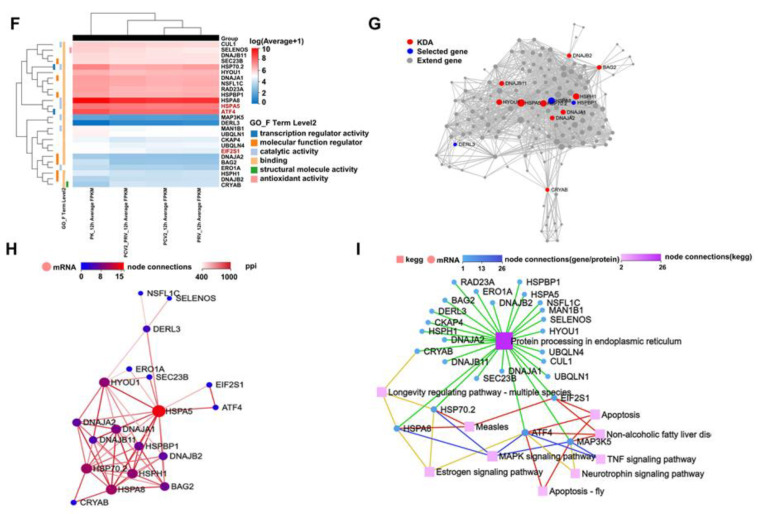
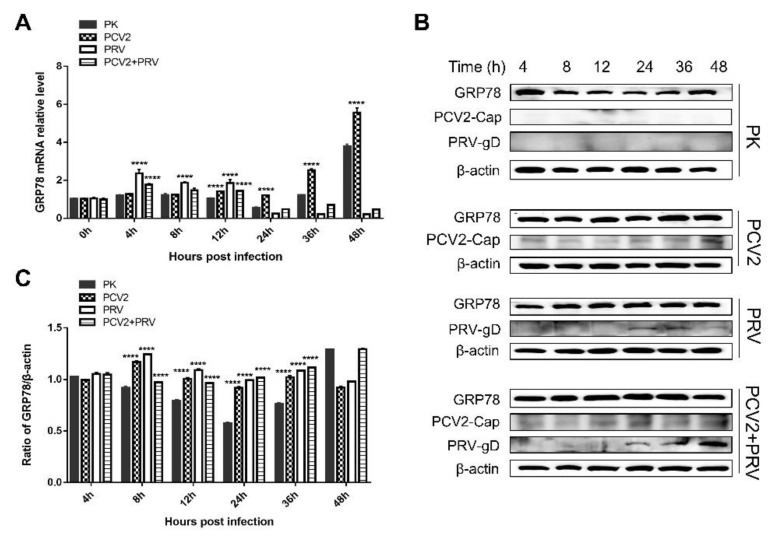
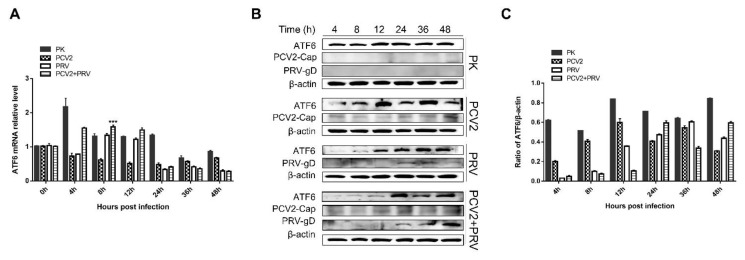
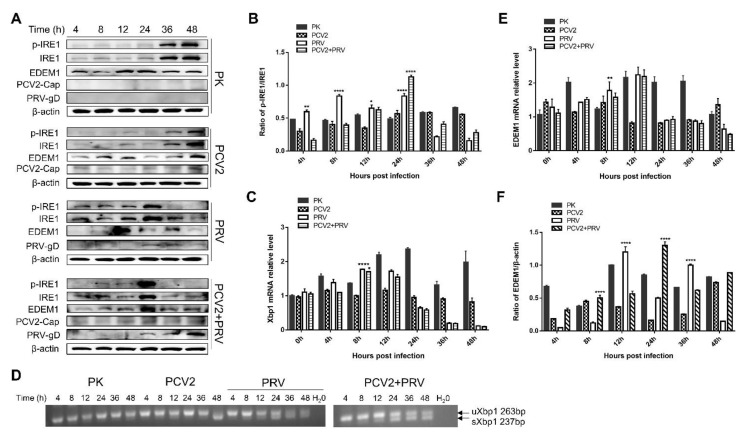
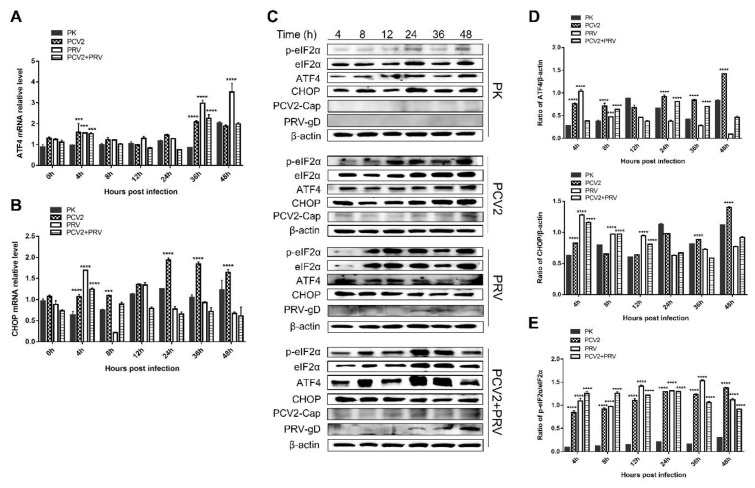
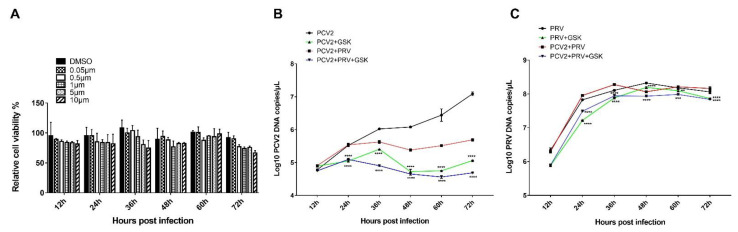
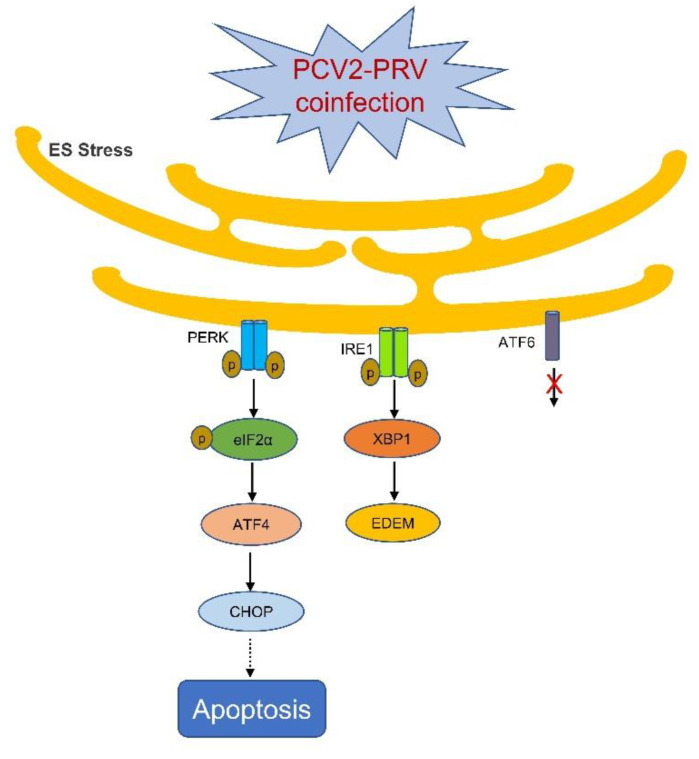
Porcine circovirus 2 (PCV2) and pseudorabies virus (PRV) are two important pathogens in the pig industry. PCV2 or PRV infection can induce endoplasmic reticulum stress (ERS) and unfolded protein response (UPR). However, the effect of PCV2 and PRV coinfection on the ERS and UPR pathways remains unclear. In this study, we found that PRV inhibited the proliferation of PCV2 mainly at 36 to 72 hpi, while PCV2 enhanced the proliferation of PRV in the middle stage of the infection. Notably, PRV is the main factor during coinfection. The results of the transcriptomic analysis showed that coinfection with PCV2 and PRV activated cellular ERS, and upregulated expressions of the ERS pathway-related proteins, including GRP78, eIF2α, and ATF4. Further research indicated that PRV played a dominant role in the sequential infection and coinfection of PCV2 and PRV. PCV2 and PRV coinfection induced the ERS activation via the PERK-eIF2α-ATF4-CHOP axis and IRE1-XBP1-EDEM pathway, and thus may enhance cell apoptosis and exacerbate the diseases.

Keywords: coinfection; endoplasmic reticulum stress (ERS); porcine circovirus type 2; porcine pseudorabies virus; transcriptome sequencing.


Conflict of interest statement

The authors declare no conflict of interest.

Figures

Figure 1
Figure 1
Growth curves of PCV2 (A) and PRV (B) in different infection groups. PK-15 cells were infected with different combinations of PCV2 and/or PRV for 12, 24, 36, 48, 60, and 72 h, followed by evaluation using real-time PCR. **, p-value < 0.01; ****, p-value < 0.0001.
Figure 2
Figure 2
Cell viability of PCV2 (A) and PRV (B) in different infection groups. PK-15 cells were infected with different combinations of PCV2 and/or PRV for 12, 24, 36, 48, 60, and 72 h, and then the cell viability was evaluated by CCK8 at indicated hours after the indicated virus infection. *, p-value < 0.05; ***, p-value < 0.001; ****, p-value < 0.0001.
Figure 3
Figure 3
Results of transcriptome analysis. (AC) Volcano plot of DEGs in PCV2 (A), PRV (B), and PCV2+PRV (C) groups compared with that of the control group (PK-15) at 12 hpi. Significant DEGs were highlighted in green (downregulated DEGs, p < 0.05) and red dots (upregulated DEGs, p < 0.05). (D) Venn diagram of numbers of DEGs between the control group (PK-15 cells) and different infection groups at 12 hpi. (E) KEGG pathway enrichment. Circles indicate the numbers of enriched genes and colors mean the Q value. Q-value < 0.05 was a significant difference. (F) Heatmap and one-dimensional hierarchical clustering of DEGs. (G) Biological networks analysis of DEGs using key driver analysis (KDA). (H) Biological network analysis of DEGs using protein–protein interaction network (PPI network). (I) Biological network analysis of DEGs using KEGG.
Figure 3
Figure 3
Results of transcriptome analysis. (AC) Volcano plot of DEGs in PCV2 (A), PRV (B), and PCV2+PRV (C) groups compared with that of the control group (PK-15) at 12 hpi. Significant DEGs were highlighted in green (downregulated DEGs, p < 0.05) and red dots (upregulated DEGs, p < 0.05). (D) Venn diagram of numbers of DEGs between the control group (PK-15 cells) and different infection groups at 12 hpi. (E) KEGG pathway enrichment. Circles indicate the numbers of enriched genes and colors mean the Q value. Q-value < 0.05 was a significant difference. (F) Heatmap and one-dimensional hierarchical clustering of DEGs. (G) Biological networks analysis of DEGs using key driver analysis (KDA). (H) Biological network analysis of DEGs using protein–protein interaction network (PPI network). (I) Biological network analysis of DEGs using KEGG.
Figure 4
Figure 4
GRP78 is upregulated during PCV2 and/or PRV single- and coinfection. PK-15 cells (PK) were single- or co-infected with PCV2 and/or PRV for 4, 8, 12, 24, 36, and 48 h. The expression levels of GRP78 were assessed by real-time PCR (A) and Western blotting (B,C). ****, p-value < 0.0001. β-actin was used as a control. The relative amount of GRP78 to β-actin was quantified by densitometry analysis using ImageJ software (C). GRP78 (Affinity, Jiangsu, China, 1:2000), PRV-gD (Lvdu, Shandong, China, 1:500), PCV2-cap [31], and β-actin (Proteintech, Wuhan, Hubei, China, 1:10,000) were used as primary antibodies, respectively. Unprocessed original images can be found in Supplementary Figure S1.
Figure 5
Figure 5
ATF6 pathway was inactivated during PCV2 and PRV single- and coinfection. PK-15 cells were single- or co-infected with PCV2 and/or PRV for 4, 8, 12, 24, 36, and 48 h. The expression levels of ATF6 were assessed by real-time PCR (A) and Western blotting (B). β-actin was used as a control. The relative amount of target protein to β-actin was quantified by densitometry analysis using ImageJ software (C). ***, p-value < 0.001. ATF6 (Wanleibio, Shenyang, China, 1:1000), PRV-gD (Lvdu, Shandong, China, 1:500), PCV2-cap [31], and β-actin (Proteintech, Wuhan, Hubei, China, 1:10,000) were used as primary antibodies, respectively. Unprocessed original images can be found in Supplementary Figure S2.
Figure 6
Figure 6
IRE1 pathway was activated in PRV single- and coinfection groups. PK-15 cells were single- or co-infected with PCV2 and/or PRV for 4, 8, 12, 24, 36, and 48 h. *, p-value < 0.05; **, p-value < 0.01; ****, p-value < 0.0001. (A) Western blotting of p-IRE1, IRE1, EDEM1, and viral proteins PCV2 Cap and PRV gD. β-actin was used as a control. (B) The ratio of p-IRE1α and IRE1α. Quantification of the bands corresponding to the p-IRE1α and IRE1α by densitometry was normalized to β-actin. (C) xbp1 mRNA levels quantified by real-time RT-PCR. (D) Splicing of xbp1 mRNA. Spliced xbp1, sxbp1; unspliced xbp1, uxbp1. (E) EDEM1 mRNA levels were quantified by real-time RT-PCR. (F) The relative amount of EDEM1 to β-actin was quantified by densitometry analysis using the ImageJ software. Phospho-IRE1 (Ser724) (Affinity, Jiangsu, China, 1:1000), IRE1 (Affinity, Jiangsu, China, 1:1000), EDEM1 (Affinity, Jiangsu, China, 1:2000), PRV-gD (Lvdu, Shandong, China, 1:500), PCV2-cap [31] and β-actin (Proteintech, Wuhan, Hubei, China, 1:10,000) were used as primary antibody, respectively. Unprocessed original images can be found in Supplementary Figures S3 and S4.
Figure 7
Figure 7
The expression levels of eIF2α, ATF4, and CHOP were upregulated during PCV2 and PRV single- and coinfection. PK-15 cells were single- or co-infected with PCV2 and/or PRV for 4, 8, 12, 24, 36, and 48 h. p-value < 0.01; ***, p-value < 0.001; ****, p-value < 0.0001. (A) ATF4 mRNA levels were quantified by real-time RT-PCR. (B) CHOP mRNA levels quantified by real-time RT-PCR. (C) Western blotting of p-eIF2α, eIF2α, ATF4, and CHOP, and viral proteins PCV2 Cap and PRV gD. β-actin was used as a control. (D) The relative amount of ATF4 and CHOP to β-actin was quantified by densitometry analysis using ImageJ. (E) The ratio of p-eIF2α and eIF2α. Quantification of the bands corresponding to the p-eIF2α and eIF2α by densitometry was normalized to β-actin. Phospho-eIF2 alpha (Ser51) (Affinity, Jiangsu, China, 1:2000), eIF2 alpha (Affinity, Jiangsu, China, 1:2000), ATF4 (Affinity, Jiangsu, China, 1:2000), DDIT3/CHOP (Affinity, Jiangsu, China, 1:2000), PRV-gD (Lvdu, Shandong, China, 1:500), PCV2-cap [31] and β-actin (Proteintech, Wuhan, Hubei, China, 1:10,000) were used as primary antibody, respectively. Unprocessed original images can be found in Supplementary Figure S5.
Figure 8
Figure 8
PCV2 and PRV coinfection caused PERK-mediated ERS and thus enhanced viral replication. (A) Effect of PERK inhibitor GSK2656157 on cell viability. PK-15 cells were treated with PERK inhibitor GSK2656157 (0.05, 0.5, 1, 5, and 10 μM) for 12, 24, 36, 48, and 72 h, followed by evaluating the cell viability via CCK8 assay. (B,C) Growth curves of PCV2 (B) and PRV (C) in PERK inhibitor-treated cells. PK-15 cells were treated with 1 μM GSK2656157, followed by single- or coinfection with PCV2 and/or PRV for 12, 24, 36, 48, 60, and 72 h. The copies of viral genes were assessed by real-time PCR. **, p-value < 0.01; ***, p-value < 0.001; ****, p-value < 0.0001.
Figure 9
Figure 9
Schematic diagram of PCV2 and PRV coinfection on the activation of ERS. Arrow, confirmed; dashed arrow, needs to be clarified; ×, unactivated pathway.

References

    1. Ouyang T., Zhang X., Liu X., Ren L. Co-Infection of Swine with Porcine Circovirus Type 2 and Other Swine Viruses. Viruses. 2019;11:185. doi: 10.3390/v11020185. - DOI - PMC - PubMed
    1. Ren L., Chen X., Ouyang H. Interactions of porcine circovirus 2 with its hosts. Virus Genes. 2016;52:437–444. doi: 10.1007/s11262-016-1326-x. - DOI - PubMed
    1. Saade G., Deblanc C., Bougon J., Marois-Crehan C., Fablet C., Auray G., Belloc C., Leblanc-Maridor M., Gagnon C.A., Zhu J., et al. Coinfections and their molecular consequences in the porcine respiratory tract. Vet. Res. 2020;51:80. doi: 10.1186/s13567-020-00807-8. - DOI - PMC - PubMed
    1. Wang Q., Zhou H., Fan H., Wang X. Coinfection with Porcine Circovirus Type 2 (PCV2) and Streptococcus suis Serotype 2 (SS2) Enhances the Survival of SS2 in Swine Tracheal Epithelial Cells by Decreasing Reactive Oxygen Species Production. Infect. Immun. 2020;88:e00537-20. doi: 10.1128/IAI.00537-20. - DOI - PMC - PubMed
    1. Zhai S.L., Chen S.N., Wei Z.Z., Zhang J.W., Huang L., Lin T., Yue C., Ran D.L., Yuan S.S., Wei W.K., et al. Co-existence of multiple strains of porcine circovirus type 2 in the same pig from China. Virol. J. 2011;8:517. doi: 10.1186/1743-422X-8-517. - DOI - PMC - PubMed

Substances