

Comparative Study of Starch Phosphorylase Genes and Encoded Proteins in Various Monocots and Dicots with Emphasis on Maize
- PMID: 35562912
- PMCID: PMC9104829
- DOI: 10.3390/ijms23094518
Comparative Study of Starch Phosphorylase Genes and Encoded Proteins in Various Monocots and Dicots with Emphasis on Maize
Abstract
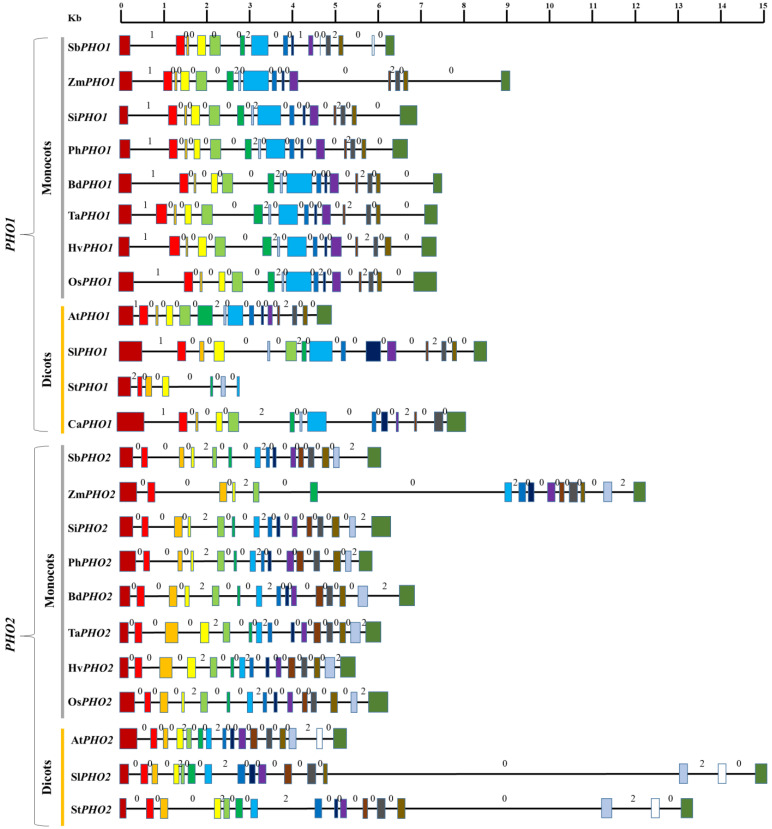
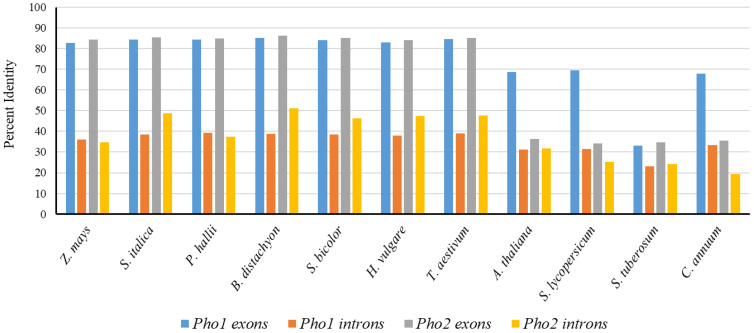
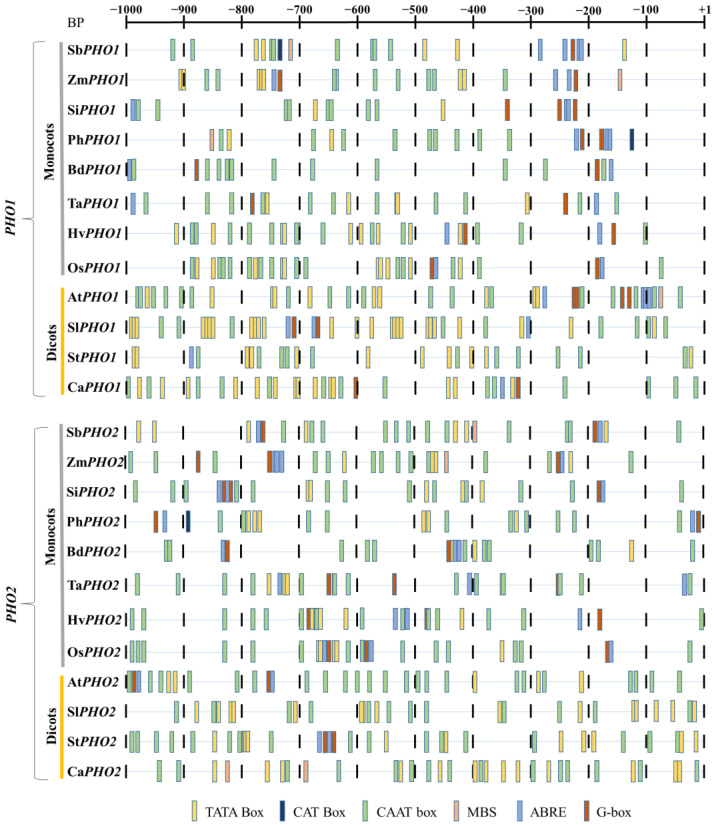
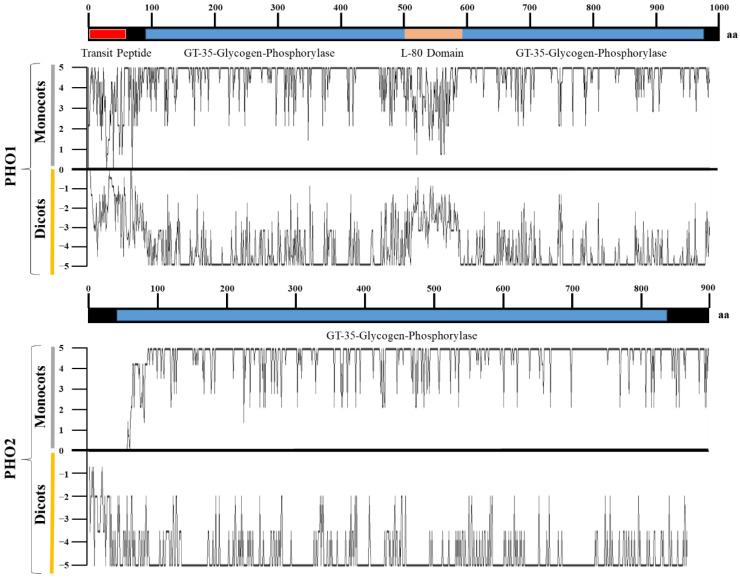
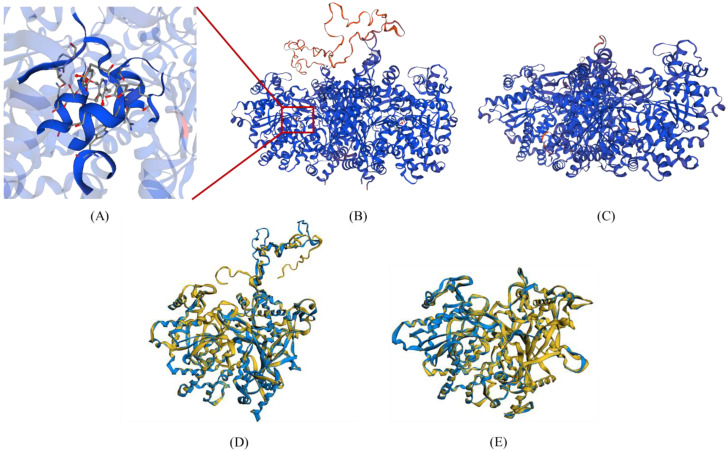
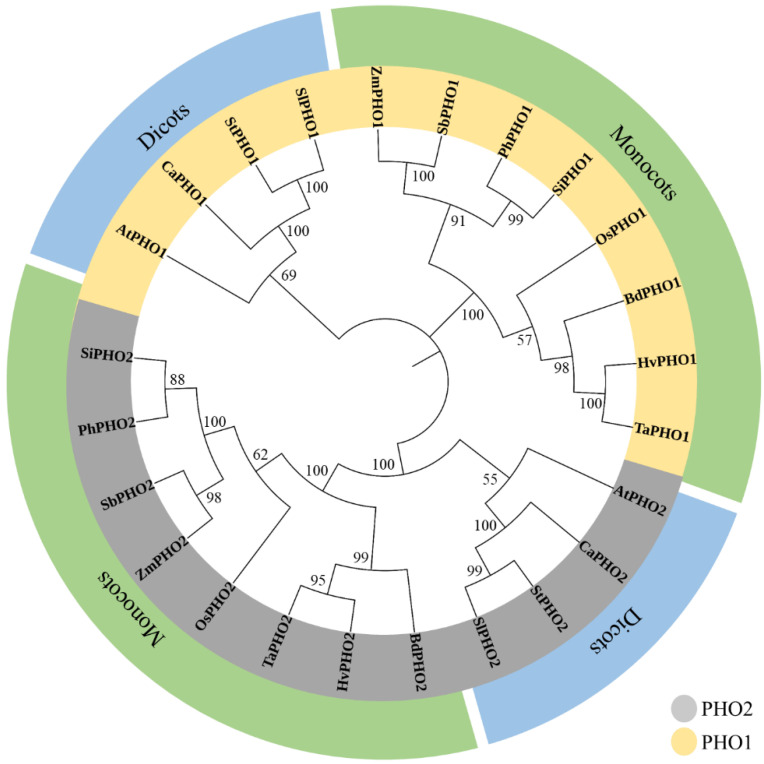
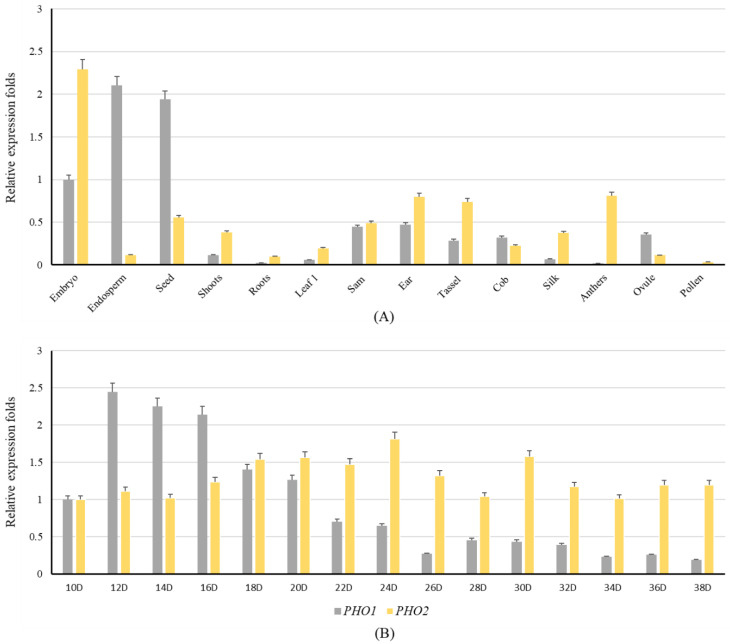
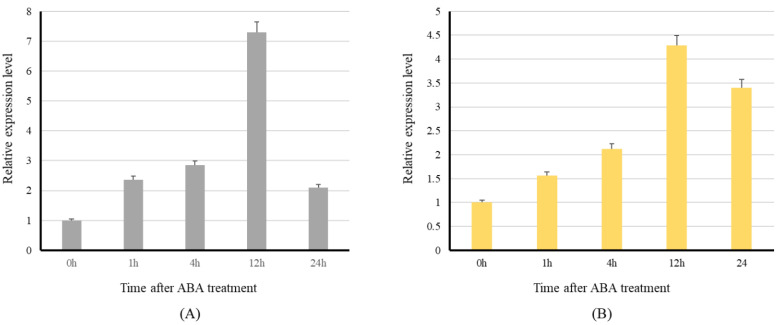
Starch phosphorylase (PHO) is a multimeric enzyme with two distinct isoforms: plastidial starch phosphorylase (PHO1) and cytosolic starch phosphorylase (PHO2). PHO1 specifically resides in the plastid, while PHO2 is found in the cytosol. Both play a critical role in the synthesis and degradation of starch. This study aimed to report the detailed structure, function, and evolution of genes encoding PHO1 and PHO2 and their protein ligand-binding sites in eight monocots and four dicots. "True" orthologs of PHO1 and PHO2 of Oryza sativa were identified, and the structure of the enzyme at the protein level was studied. The genes controlling PHO2 were found to be more conserved than those controlling PHO1; the variations were mainly due to the variable sequence and length of introns. Cis-regulatory elements in the promoter region of both genes were identified, and the expression pattern was analyzed. The real-time quantitative polymerase chain reaction indicated that PHO2 was expressed in all tissues with a uniform pattern of transcripts, and the expression pattern of PHO1 indicates that it probably contributes to the starch biosynthesis during seed development in Zea mays. Under abscisic acid (ABA) treatment, PHO1 was found to be downregulated in Arabidopsis and Hordeum vulgare. However, we found that ABA could up-regulate the expression of both PHO1 and PHO2 within 12 h in Zea mays. In all monocots and dicots, the 3D structures were highly similar, and the ligand-binding sites were common yet fluctuating in the position of aa residues.
Keywords: comparative study; cytosolic starch phosphorylase; plastidial starch phosphorylase; starch phosphorylase.
Conflict of interest statement
The authors declare that the research was conducted in the absence of any commercial or financial relationships that could be construed as a potential conflict of interest.
Figures
Similar articles
-
Structure and expression of barley starch phosphorylase genes.Planta. 2013 Dec;238(6):1081-93. doi: 10.1007/s00425-013-1953-6. Epub 2013 Sep 4. Planta. 2013. PMID: 24002549
-
Molecular Functions and Pathways of Plastidial Starch Phosphorylase (PHO1) in Starch Metabolism: Current and Future Perspectives.Int J Mol Sci. 2021 Sep 28;22(19):10450. doi: 10.3390/ijms221910450. Int J Mol Sci. 2021. PMID: 34638789 Free PMC article. Review.
-
Characterization of plastidial starch phosphorylase in Triticum aestivum L. endosperm.J Plant Physiol. 2009 Sep 15;166(14):1465-78. doi: 10.1016/j.jplph.2009.05.004. Epub 2009 Jun 12. J Plant Physiol. 2009. PMID: 19524321
-
Glucan phosphorylases in Vicia faba L.: cloning, structural analysis and expression patterns of cytosolic and plastidic forms in relation to starch.Planta. 1996;199(1):64-73. doi: 10.1007/BF00196882. Planta. 1996. PMID: 8680306
-
The plastid phosphorylase as a multiple-role player in plant metabolism.Plant Sci. 2020 Jan;290:110303. doi: 10.1016/j.plantsci.2019.110303. Epub 2019 Oct 10. Plant Sci. 2020. PMID: 31779913 Review.
Cited by
-
Serine 31 Phosphorylation-Driven Regulation of AGPase Activity: Potential Implications for Enhanced Starch Yields in Crops.Int J Mol Sci. 2023 Oct 18;24(20):15283. doi: 10.3390/ijms242015283. Int J Mol Sci. 2023. PMID: 37894964 Free PMC article.
-
Molecular Genetics Enhances Plant Breeding.Int J Mol Sci. 2023 Jun 9;24(12):9977. doi: 10.3390/ijms24129977. Int J Mol Sci. 2023. PMID: 37373125 Free PMC article.
-
Genome-wide identification of starch phosphorylase gene family in Rosa chinensis and expression in response to abiotic stress.Sci Rep. 2024 Jun 17;14(1):13917. doi: 10.1038/s41598-024-64937-1. Sci Rep. 2024. PMID: 38886497 Free PMC article.
-
Site-Directed Mutations at Phosphorylation Sites in Zea mays PHO1 Reveal Modulation of Enzymatic Activity by Phosphorylation at S566 in the L80 Region.Plants (Basel). 2023 Sep 8;12(18):3205. doi: 10.3390/plants12183205. Plants (Basel). 2023. PMID: 37765369 Free PMC article.
References
-
- Tetlow I.J., Wait R., Lu Z., Akkasaeng R., Bowsher C.G., Esposito S., Kosar-Hashemi B., Morell M.K., Emes M.J. Protein phosphorylation in amyloplasts regulates starch branching enzyme activity and protein-protein interactions. Plant Cell. 2004;16:694–708. doi: 10.1105/tpc.017400. - DOI - PMC - PubMed
-
- Dauvillee D., Chochois V., Steup M., Haebel S., Eckermann N., Ritte G., Ral J.P., Colleoni C., Hicks G., Wattebled F., et al. Plastidial phosphorylase is required for normal starch synthesis in Chlamydomonas reinhardtii. Plant J. 2006;48:274–285. doi: 10.1111/j.1365-313X.2006.02870.x. - DOI - PubMed
MeSH terms
Substances
Grants and funding
LinkOut - more resources
Full Text Sources
