

Effect of Cardiotonic Steroid Marinobufagenin on Vascular Remodeling and Cognitive Impairment in Young Dahl-S Rats
- PMID: 35562955
- PMCID: PMC9101263
- DOI: 10.3390/ijms23094563
Effect of Cardiotonic Steroid Marinobufagenin on Vascular Remodeling and Cognitive Impairment in Young Dahl-S Rats
Abstract
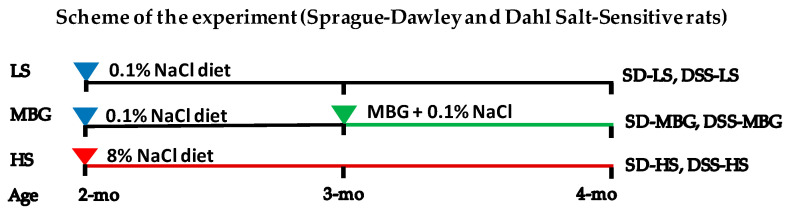
The hypertensive response in Dahl salt-sensitive (DSS) rats on a high-salt (HS) diet is accompanied by central arterial stiffening (CAS), a risk factor for dementia, and heightened levels of a prohypertensive and profibrotic factor, the endogenous Na/K-ATPase inhibitor marinobufagenin (MBG). We studied the effect of the in vivo administration of MBG or HS diet on blood pressure (BP), CAS, and behavioral function in young DSS rats and normotensive Sprague-Dawley rats (SD), the genetic background for DSS rats. Eight-week-old male SD and DSS rats were given an HS diet (8% NaCl, n = 18/group) or a low-salt diet (LS; 0.1% NaCl, n = 14-18/group) for 8 weeks or MBG (50 µg/kg/day, n = 15-18/group) administered via osmotic minipumps for 4 weeks in the presence of the LS diet. The MBG-treated groups received the LS diet. The systolic BP (SBP); the aortic pulse wave velocity (aPWV), a marker of CAS; MBG levels; spatial memory, measured by a water maze task; and tissue collection for the histochemical analysis were assessed at the end of the experiment. DSS-LS rats had higher SBP, higher aPWV, and poorer spatial memory than SD-LS rats. The administration of stressors HS and MBG increased aPWV, SBP, and aortic wall collagen abundance in both strains vs. their LS controls. In SD rats, HS or MBG administration did not affect heart parameters, as assessed by ECHO vs. the SD-LS control. In DSS rats, impaired whole-heart structure and function were observed after HS diet administration in DSS-HS vs. DSS-LS rats. MBG treatment did not affect the ECHO parameters in DSS-MBG vs. DSS-LS rats. The HS diet led to an increase in endogenous plasma and urine MBG levels in both SD and DSS groups. Thus, the prohypertensive and profibrotic effect of HS diet might be partially attributed to an increase in MBG. The prohypertensive and profibrotic functions of MBG were pronounced in both DSS and SD rats, although quantitative PCR revealed that different profiles of profibrotic genes in DSS and SD rats was activated after MBG or HS administration. Spatial memory was not affected by HS diet or MBG treatment in either SD or DSS rats. Impaired cognitive function was associated with higher BP, CAS, and cardiovascular remodeling in young DSS-LS rats, as compared to young SD-LS rats. MBG and HS had similar effects on the cardiovascular system and its function in DSS and SD rats, although the rate of change in SD rats was lower than in DSS rats. The absence of a cumulative effect of increased aPWV and BP on spatial memory can be explained by the cerebrovascular and brain plasticity in young rats, which help the animals to tolerate CAS elevated by HS and MBG and to counterbalance the profibrotic effect of heightened MBG.
Keywords: Dahl salt-sensitive rats; aortic pulse wave velocity; arterial stiffness; behavioral tests; cardiovascular remodeling; echocardiography; fibrosis; genes; hypertension; marinobufagenin; spatial memory; steroidal inhibitor of Na/K-ATPase; vascular dementia.
Conflict of interest statement
The authors declare no conflict of interest.
Figures


Similar articles
-
New Insights on the Role of Marinobufagenin from Bench to Bedside in Cardiovascular and Kidney Diseases.Int J Mol Sci. 2023 Jul 6;24(13):11186. doi: 10.3390/ijms241311186. Int J Mol Sci. 2023. PMID: 37446363 Free PMC article. Review.
-
Dietary Sodium Restriction Reduces Arterial Stiffness, Vascular TGF-β-Dependent Fibrosis and Marinobufagenin in Young Normotensive Rats.Int J Mol Sci. 2018 Oct 15;19(10):3168. doi: 10.3390/ijms19103168. Int J Mol Sci. 2018. PMID: 30326586 Free PMC article.
-
Monoclonal Antibody to Marinobufagenin Downregulates TGFβ Profibrotic Signaling in Left Ventricle and Kidney and Reduces Tissue Remodeling in Salt-Sensitive Hypertension.J Am Heart Assoc. 2019 Oct 15;8(20):e012138. doi: 10.1161/JAHA.119.012138. Epub 2019 Oct 2. J Am Heart Assoc. 2019. PMID: 31576777 Free PMC article.
-
Aortic Fibrosis, Induced by High Salt Intake in the Absence of Hypertensive Response, is Reduced by a Monoclonal Antibody to Marinobufagenin.Am J Hypertens. 2016 May;29(5):641-6. doi: 10.1093/ajh/hpv155. Epub 2015 Sep 7. Am J Hypertens. 2016. PMID: 26350300 Free PMC article.
-
The Na+K+-ATPase Inhibitor Marinobufagenin and Early Cardiovascular Risk in Humans: a Review of Recent Evidence.Curr Hypertens Rep. 2019 Apr 12;21(5):38. doi: 10.1007/s11906-019-0942-y. Curr Hypertens Rep. 2019. PMID: 30980225 Free PMC article. Review.
Cited by
-
Sensational site: the sodium pump ouabain-binding site and its ligands.Am J Physiol Cell Physiol. 2024 Apr 1;326(4):C1120-C1177. doi: 10.1152/ajpcell.00273.2023. Epub 2024 Jan 15. Am J Physiol Cell Physiol. 2024. PMID: 38223926 Free PMC article. Review.
-
New Insights on the Role of Marinobufagenin from Bench to Bedside in Cardiovascular and Kidney Diseases.Int J Mol Sci. 2023 Jul 6;24(13):11186. doi: 10.3390/ijms241311186. Int J Mol Sci. 2023. PMID: 37446363 Free PMC article. Review.
-
Silencing of PKG1 Gene Mimics Effect of Aging and Sensitizes Rat Vascular Smooth Muscle Cells to Cardiotonic Steroids: Impact on Fibrosis and Salt Sensitivity.J Am Heart Assoc. 2023 Jun 20;12(12):e028768. doi: 10.1161/JAHA.122.028768. Epub 2023 Jun 10. J Am Heart Assoc. 2023. PMID: 37301747 Free PMC article.
-
Measurement of blood pressure in rats: Invasive or noninvasive methods?Physiol Rep. 2024 Sep;12(17):e70041. doi: 10.14814/phy2.70041. Physiol Rep. 2024. PMID: 39266877 Free PMC article. Review.
-
Ca2+-Driven Selectivity of the Effect of the Cardiotonic Steroid Marinobufagenin on Rabbit Sinoatrial Node Function.Cells. 2023 Jul 18;12(14):1881. doi: 10.3390/cells12141881. Cells. 2023. PMID: 37508546 Free PMC article.
References
-
- Zhang Y., Wei W., Shilova V., Petrashevskaya N.N., Zernetkina V.I., Grigorova Y.N., Marshall C.A., Fenner R.C., Lehrmann E., WoodIII W.H. Monoclonal Antibody to Marinobufagenin Downregulates TGFbeta Profibrotic Signaling in Left Ventricle and Kidney and Reduces Tissue Remodeling in Salt-Sensitive Hypertension. J. Am. Heart Assoc. 2019;8:e012138. doi: 10.1161/JAHA.119.012138. - DOI - PMC - PubMed
MeSH terms
Substances
LinkOut - more resources
Full Text Sources
Medical
