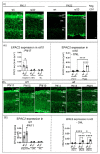
. 2022 Apr 21;23(9):4619.
doi: 10.3390/ijms23094619.

Enhanced cGMP Interactor Rap Guanine Exchange Factor 4 (EPAC2) Expression and Activity in Degenerating Photoreceptors: A Neuroprotective Response?

Affiliations

Enhanced cGMP Interactor Rap Guanine Exchange Factor 4 (EPAC2) Expression and Activity in Degenerating Photoreceptors: A Neuroprotective Response?

Michel Rasmussen et al. Int J Mol Sci. .

Abstract

The disease retinitis pigmentosa (RP) leads to photoreceptor degeneration by a yet undefined mechanism(s). In several RP mouse models (i.e., rd mice), a high cyclic GMP (cGMP) level within photoreceptors is detected, suggesting that cGMP plays a role in degeneration. The rap guanine exchange factor 4 (EPAC2) is activated by cyclic AMP (cAMP) and is an accepted cGMP-interacting protein. It is unclear whether and how cGMP interacts with EPAC2 in degenerating photoreceptors; we therefore investigated EPAC2 expression and interactions with cGMP and cAMP in retinas of the rd1 and rd10 models for retinal degeneration. EPAC2 expression in the photoreceptor layer increased significantly during rd1 and rd10 degeneration, and an increase in EPAC2 interactions with cGMP but not cAMP in the rd1 was also seen via a proximity ligation assay on histological sections. Retinal explant cultures revealed that pharmacological inhibition of the EPAC2 activity reduced the photoreceptor layer thickness in the rd10 retina, suggesting that EPAC2 inhibition promotes degeneration. Taken together, our results support the hypothesis that high degeneration-related cGMP leads to increased EPAC2 and cGMP interactions, inhibiting EPAC2. By inference, EPAC2 could have neuroprotective capacities that may be exploited in the future.

Keywords: cAMP; cGMP; neuroprotective; photoreceptors; rap guanine exchange factor 4; retinal degeneration.


Conflict of interest statement

F.S. is employed at Biolog Life Science Institute GmbH & Co. KG, which offers the analogs and other products used in this study on a commercial basis.

Figures
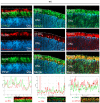
Figure 1
Figure 1
EPAC2 protein localization in wt retina. Panels show, from top to bottom, EPAC2 staining, photoreceptor markers, merged images, and fluorescence intensity profiles*. (Left panel) EPAC2 was expressed in the outer nuclear layer (ONL) and within photoreceptor segments (IS/OS), but there was no overlap between EPAC2 and rhodopsin, a marker for rod outer segments (OS); (Middle panel). There was no clear indication of colocalization between EPAC2 and peanut agglutinin (PNA, a specific glycoprotein binder that binds the extracellular matrix around the inner segments (IS) and OS, as well as the synaptic pedicles, of cones [Blanks and Johnson, 1984 [32], Johnson et al., 1986 [33]). Arrows show PNA localization; no clear colocalization is observed between PNA and EPAC2, which is further supported by the fluorescence intensity profile at the bottom. (Right panel) Overlap between EPAC2 and ATP1A3, a protein specific for photoreceptor IS (Molday, LL et al., 2019 [34]), as indicated by the merged picture and fluorescence intensity profiles. The pictures represent three biological replicates per staining. DAPI (blue) was used as a nuclear counterstain. Scale bar: 10 µm. * Fluorescence intensity profiles were obtained by analyzing a horizontal line (indicated by a white line in the bottom pictures) in the segments and showing the intensities of the respective green/red fluorescence in a graph.
Figure 2
Figure 2
EPAC2 expression in the rd models compared to their respective wt retina. (A,B) Example of EPAC2 immunostaining, in this case, rd10, rd1, and wt retina at different ages (i.e., wt/rd10: PN17, and PN22, wt/rd1: PN11, PN15, and PN19). A negative control with no primary EPAC2 antibody is provided. Scale bar: (A) 10 µm and (B) 50 µm. Panel (Ai) EPAC2 expression analyses in rd10. Left for the different layers: segments (IS/OS), ONL, and INL; right data from relevant ages for rd10 and their respective wt counterparts. (Bi) EPAC2 expression analyses in rd1. Left for the different layers: segments (IS/OS), ONL, and INL; right data from relevant ages for rd1 and their respective wt counterparts. The EPAC2 expression was generally higher within the segments, and with respect to these, rd10 had less EPAC2 expression than wt. The ONL and INL values were all significantly different from the segment values of the corresponding genotype (not labeled in the figure). Furthermore, data show EPAC2 expression increases significantly over time in both models. (A,B) Graphs represent three to seven biological replicates with mean ± SD; the two-way ANOVA was applied, and the levels of significance are * p < 0.05, **** p < 0.0001. Abbreviations the same as in Figure 1.
Figure 3
Figure 3
cGMP, cAMP, and EPAC2 are associated with cell death. All pictures represent the rd1 retina at PN11. A to D all show: X, first staining; Xi, second staining; Xii, merged stainings; and increased magnification. (AAii) Accumulated cGMP did not overlap with TUNEL+ cells in the rd1 retina. Arrowheads in A and Ai indicates that there was no obvious overlap between the cGMP and TUNEL+ cells. (BBii) Accumulated cAMP overlapped with TUNEL+ cells in some cases. Arrows in Bii indicate such an overlap (yellow). (CCii) cGMP and cAMP showed overlap in a few photoreceptor nuclei*. A to C suggest that high intracellular cGMP is followed by cAMP accumulation, which in turn is followed by TUNEL positivity (a proposed order of events is indicated in the bottom panel). (DDii) Accumulated cGMP colocalized with EPAC2 in degenerating cells, where EPAC2 appeared to have higher expression. Arrowheads point to colocalization of accumulated cGMP and high EPAC2 expression. The red and blue inserted squares in Di show cells containing augmented EPAC2 expression (small, red, and blue) and magnifications of these (large, red, and blue). Micrographs are representative of three biological replicates. ONL: outer nuclear layer. As judged by the position and appearance of the stained structure.
Figure 4
Figure 4
cAMP level increases within the ONL in degenerating rd1 retinas. The cAMP level was quantified from immunofluorescence stainings from the two rd models and given as level/area (µm2): rd10 (left) and rd1 (right), as well as their respective wt counterparts at different ages. cAMP levels increased with time in rd1 but were not altered significantly in rd10 or wt. Graphs represent three to six biological replicates, and bars represent mean ± SD; levels of significance are: * p < 0.05, ** p < 0.01, **** p < 0.0001.
Figure 5
Figure 5
The extent of cGMP and EPAC2 proximity increases with time in the rd retina. Panel (A,B) gives PLA ratios (PLA counts over ONL area) and raw PLA counts for various situations: (left) proximity outcome between EPAC2 and cGMP (EPAC2:cGMP); (middle) proximity outcome between EPAC2 and cAMP (EPAC2:cAMP); (right) the raw proximity count (PLA count) was provided for comparison. (A) rd10 did not show any significant alteration between EPAC2:cGMP nor between EPAC2:cAMP at PN17 or PN22. (B) A significant increase in the EPAC2:cGMP ratio was observed over time in the rd1 model. Graphs represent three to six biological replicates, and bars represent mean ± SD; levels of significance are: * p < 0.05. ONL: outer nuclear layer.
Figure 6
Figure 6
Inhibition of EPAC2 activity decreases ONL thickness in the rd10 model. (A) Inhibition of EPAC2 activity by ESI-05 in rd10 explants (treatment paradigm: PN12-PN24) caused a numerical but not significant increase in EPAC2 expression compared to the control (Ctrl, i.e., untreated retina) and the S-220-treated retina. For the wt retina, the activator S-220 reduced EPAC2 expression significantly in the ONL compared to Ctrl. (B) The rd10 explants had significantly more TUNEL-positive cells compared to their healthy counterparts. No differences in the number of TUNEL+ cells was associated with the treatments. (C) ESI-05 treatment leads to a significant reduction in ONL thickness in rd10 explants but not in wt explants. (D) Examples of stainings, forming the basis of the graphs above. All figures represent mean ± SD. Results represent three to six biological replicates. The Kruskal–Wallis statistical method was applied to identify statistical significance (* p < 0.05). The dotted line in figure C marks the ONL (outer nuclear layer). Scale bar = 20 µm.
Figure 7
Figure 7
Illustration of cGMP’s suggested effect on EPAC2 activity based on data from both rd1 and rd10. In the rd10 model, EPAC2 activity is decreased compared to wt. Therefore, as a speculation, the rd10 model may compensate for the activity loss by expressing more EPAC2 protein over time within the ONL, which was also seen with rd1. The decreased EPAC2 activity could be the result of increasing cGMP levels, which compete with cAMP for the binding of EPAC2. Increased cGMP binding might in turn prevent stimulation of protective pathways, even if the cAMP level would subsequently increase. The up and down arrows indicate an increase or decrease, respectively, of either Rap1 activity or EPAC2 expression.

Similar articles

Cited by

References

    1. Fahim A.T., Daiger S.P., Weleber R.G. Nonsyndromic Retinitis Pigmentosa Overview. GeneReviews®. [(accessed on 23 September 2020)]; Available online: http://www.ncbi.nlm.nih.gov/pubmed/20301590.
    1. Chang S., Vaccarella L., Olatunji S., Cebulla C., Christoforidis J. Diagnostic Challenges in Retinitis Pigmentosa: Genotypic Multiplicity and Phenotypic Variability. Curr. Genom. 2011;12:267–275. doi: 10.2174/138920211795860116. - DOI - PMC - PubMed
    1. Pfeiffer R.L., Marc R.E., Jones B.W. Persistent remodeling and neurodegeneration in late-stage retinal degeneration. Prog. Retin. Eye Res. 2020;74:100771. doi: 10.1016/j.preteyeres.2019.07.004. - DOI - PMC - PubMed
    1. Hanna J., Yücel Y.H., Zhou X., Mathieu E., Paczka-Giorgi L.A., Gupta N. Progressive loss of retinal blood vessels in a live model of retinitis pigmentosa. Can. J. Ophthalmol. 2017;53:391–401. doi: 10.1016/j.jcjo.2017.10.014. - DOI - PubMed
    1. Petit L., Lhériteau E., Weber M., Le Meur G., Deschamps J.Y., Provost N., Mendes-Madeira A., Libeau L., Guihal C., Colle M.A., et al. Restoration of vision in the PDE6β-deficient dog, a large animal model of rod-cone dystrophy. Mol. Ther. 2012;20:2019–2030. doi: 10.1038/mt.2012.134. - DOI - PMC - PubMed

LinkOut - more resources