. 2022 Apr 23;23(9):4683.
doi: 10.3390/ijms23094683.

Acute Hypoxia Alters Extracellular Vesicle Signatures and the Brain Citrullinome of Naked Mole-Rats (Heterocephalus glaber)

Affiliations

Acute Hypoxia Alters Extracellular Vesicle Signatures and the Brain Citrullinome of Naked Mole-Rats (Heterocephalus glaber)

Stefania D'Alessio et al. Int J Mol Sci. .

Abstract

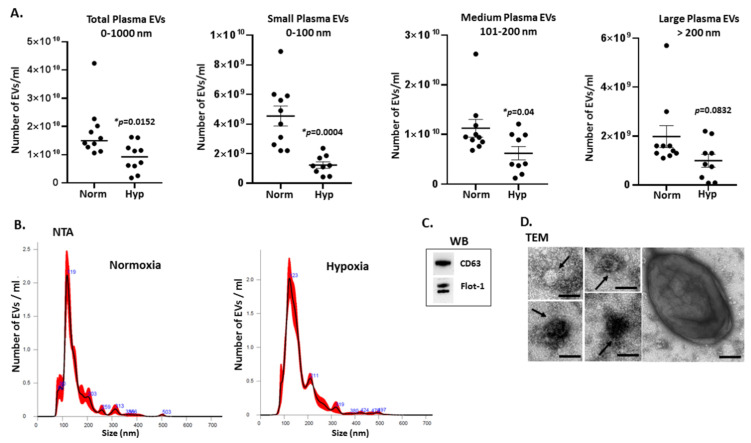
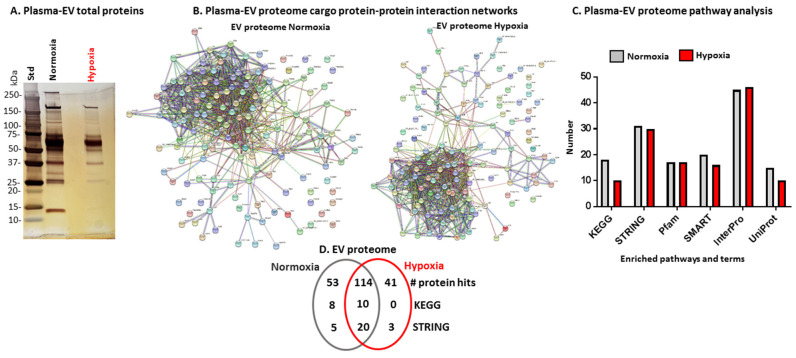
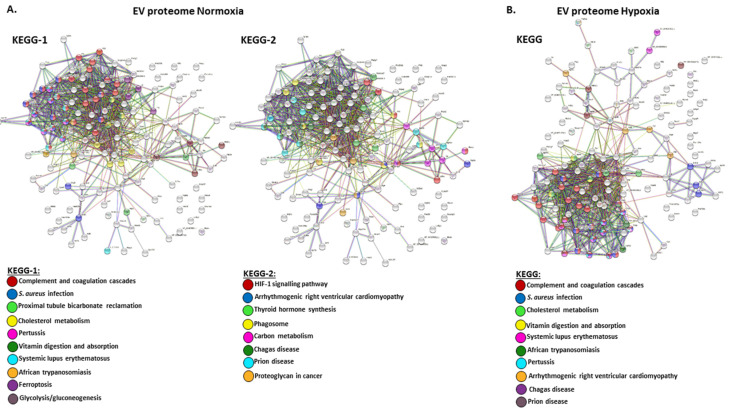
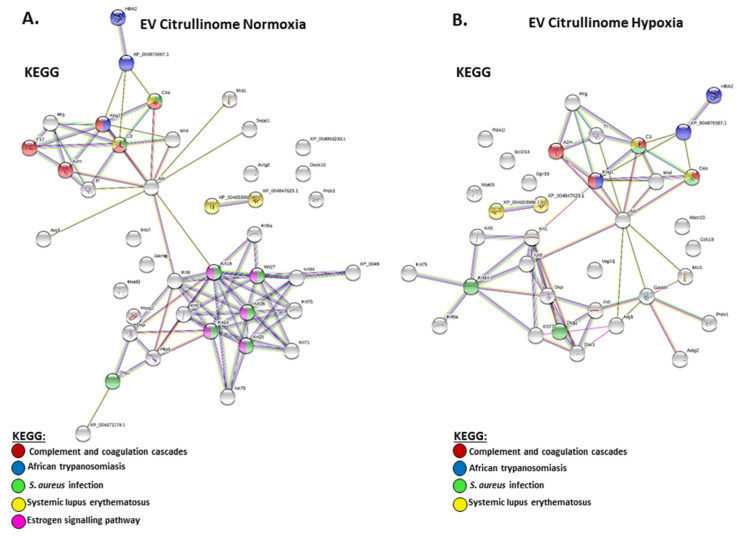
Peptidylarginine deiminases (PADs) and extracellular vesicles (EVs) may be indicative biomarkers of physiological and pathological status and adaptive responses, including to diseases and disorders of the central nervous system (CNS) and related to hypoxia. While these markers have been studied in hypoxia-intolerant mammals, in vivo investigations in hypoxia-tolerant species are lacking. Naked mole-rats (NMR) are among the most hypoxia-tolerant mammals and are thus a good model organism for understanding natural and beneficial adaptations to hypoxia. Thus, we aimed to reveal CNS related roles for PADs in hypoxia tolerance and identify whether circulating EV signatures may reveal a fingerprint for adaptive whole-body hypoxia responses in this species. We found that following in vivo acute hypoxia, NMR: (1) plasma-EVs were remodelled, (2) whole proteome EV cargo contained more protein hits (including citrullinated proteins) and a higher number of associated KEGG pathways relating to the total proteome of plasma-EVs Also, (3) brains had a trend for elevation in PAD1, PAD3 and PAD6 protein expression, while PAD2 and PAD4 were reduced, while (4) the brain citrullinome had a considerable increase in deiminated protein hits with hypoxia (1222 vs. 852 hits in normoxia). Our findings indicate that circulating EV signatures are modified and proteomic content is reduced in hypoxic conditions in naked mole-rats, including the circulating EV citrullinome, while the brain citrullinome is elevated and modulated in response to hypoxia. This was further reflected in elevation of some PADs in the brain tissue following acute hypoxia treatment. These findings indicate a possible selective role for PAD-isozymes in hypoxia response and tolerance.

Keywords: Heterocephalus glaber; KEGG; central nervous system; deimination/citrullination; extracellular vesicles (EVs); hypoxia; in vivo; peptidylarginine deiminase (PAD); plasma.


Conflict of interest statement

The authors declare no conflict of interest. The funders had no role in the design of the study; in the collection, analyses, or interpretation of data; in the writing of the manuscript, or in the decision to publish the results.

Figures

Figure 1
Figure 1
EV profile trends from plasma of naked mole-rats treated for 4 h in normoxia or hypoxia. (A) Number of EVs isolated from naked mole-rat plasma, comparing normoxia and hypoxia conditions. Changes were assessed in release profiles of total EVs (0–1000 nm), small EVs (<100 nm), medium-sized EVs (101–200 nm) and large EVs (201–1000 nm); based on measurement of plasma EVs from 10 animals per group; error bars represent standard error of mean (SEM); t-test, exact p-values are shown, p < 0.05 considered statistically significant (indicated by *). (B) Representative NTA curves of plasma EVs from naked mole-rats following normoxia or hypoxia treatment, respectively; (C) Western blotting analysis of EV markers for naked mole-rat plasma EVs, showing positive for CD63 and Flotillin-1; (D) Transmission electron microscopy (TEM) of plasma-EVs from naked mole-rats, showing representative images of the differently sized EVs; scale bar indicates 100 nm, black arrows highlight individual EVs.
Figure 2
Figure 2
Total proteomic cargo of plasma EVs from normoxia- and hypoxia-treated naked mole-rats. (A) SilverGel showing total protein EV cargo that was then subjected to LC-MS/MS analysis. (B) Protein interaction networks for the plasma EV proteome of normoxia- and hypoxia-treated naked mole-rats. (C) Histogram showing the number of pathway analysis terms associated with the proteome of EVs from normoxia- and hypoxia-treated animals (n = 5 animals per group). (D) Venn diagram showing unique and shared protein hits, and KEGG and STRING pathways between EV proteomes of the normoxia and hypoxia groups (n = 5 animals per group).
Figure 3
Figure 3
KEGG pathway analysis for protein network analysis for EV total protein cargo, showing predicted protein networks annotating associated KEGG pathways for total protein of plasma EVs from (A) normoxia-treated mole-rats and (B) hypoxia-treated mole-rats.
Figure 4
Figure 4
F95-enriched protein cargo of plasma EVs (EV citrullinome) from normoxia- and hypoxia-treated naked mole-rats. (A) SilverGel showing F95-enriched protein fractions from EVs (EV citrullinome) that were then subjected to LC-MS/MS analysis. (B) Protein–protein interaction networks created in STRING for the plasma-EV citrullinome of normoxia- and hypoxia-treated naked mole-rats. (C) Histogram showing number of pathway analysis terms associated with the EV citrullinome from normoxia- and hypoxia-treated animals. (D) Venn diagram summarising deimination/citrullination (F95) hits and main KEGG and STRING pathways related to these hits, indicating shared or distinct hits and pathways between the groups (n = 5 animals per group).
Figure 5
Figure 5
STRING analysis for the EV citrullinome, showing predicted protein networks and associated KEGG pathways for the plasma EV citrullinome from (A) normoxia-treated naked mole-rats and (B) hypoxia-treated naked mole-rats.
Figure 6
Figure 6
PAD isozyme and CitH3 protein levels in brains of naked mole-rats following normoxia and hypoxia treatment, showing (A) PAD1, (B) PAD2, (C) PAD3, (D) PAD4, (E) PAD6, and (F) CitH3. Protein levels were assessed in n = 5 brains per group and normalised against beta-actin protein levels; exact p-values are indicated (t-test; * indicates significance at p < 0.05; circles represent normoxia and squares hypoxia brain samples, respectively) and the error bar represents SD.
Figure 7
Figure 7
The brain citrullinome of naked mole-rats following normoxia or hypoxia treatment. (A) SilverGel showing F95-enriched proteins from control brains (normoxia) and brains taken from animals after a hypoxia challenge; n = 5 (pool of 5 brains per group; 2 experimental replicates). (B) Protein-interaction networks for all deiminated protein candidates identified in naked mole-rat brains following normoxia or hypoxia (brain citrullinome). (C) STRING pathway analysis results for KEGG and GO terms for the full brain citrullinome following normoxia or hypoxia treatment. (D) Venn diagram summarising deimination/citrullination hits (F95) and shared and specific pathways for the citrullinome between normoxic and hypoxic brains (n = 5 brains per group in all experiments).
Figure 8
Figure 8
Protein networks built based on F95-enriched proteins identified in either the normoxia or hypoxia brains only. (A) F95 hits from normoxia brains only (not overlapping with the hypoxia group); (B) F95-enriched proteins identified in hypoxia brains only (not overlapping with the normoxia group).

Similar articles

Cited by

References

    1. Buffenstein R., Amoroso V., Andziak B., Avdieiev S., Azpurua J., Barker A.J., Bennett N.C., Brieno-Enriquez M.A., Bronner G.N., Coen C., et al. The naked truth: A comprehensive clarification and classification of current ‘myths’ in naked mole-rat biology. Biol. Rev. Camb. Philos. Soc. 2022;97:115–140. doi: 10.1111/brv.12791. - DOI - PMC - PubMed
    1. Pamenter M.E. Adaptations to a hypoxic lifestyle in naked mole-rats. J. Exp. Biol. 2022;225:jeb196725. doi: 10.1242/jeb.196725. - DOI - PubMed
    1. Chung D., Dzal Y.A., Seow A., Milsom W.K., Pamenter M.E. Naked mole rats exhibit metabolic but not ventilatory plasticity following chronic sustained hypoxia. Proc. Biol. Sci. 2016;283:20160216. doi: 10.1098/rspb.2016.0216. - DOI - PMC - PubMed
    1. Pamenter M.E., Dzal Y.A., Milsom W.K. Adenosine receptors mediate the hypoxic ventilatory response but not the hypoxic metabolic response in the naked mole rat during acute hypoxia. Proc. Biol. Sci. 2015;282:20141722. doi: 10.1098/rspb.2014.1722. - DOI - PMC - PubMed
    1. Pamenter M.E., Lau G.Y., Richards J.G., Milsom W.K. Naked mole rat brain mitochondria electron transport system flux and H(+) leak are reduced during acute hypoxia. J. Exp. Biol. 2018;221 Pt 4:jeb171397. doi: 10.1242/jeb.171397. - DOI - PubMed

LinkOut - more resources