

Leptin Signaling in Obesity and Colorectal Cancer
- PMID: 35563103
- PMCID: PMC9102849
- DOI: 10.3390/ijms23094713
Leptin Signaling in Obesity and Colorectal Cancer
Abstract
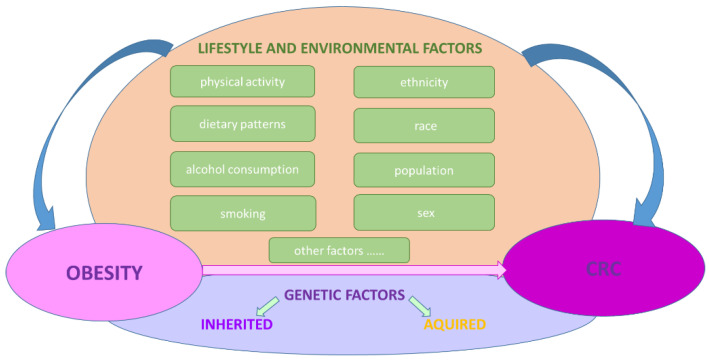
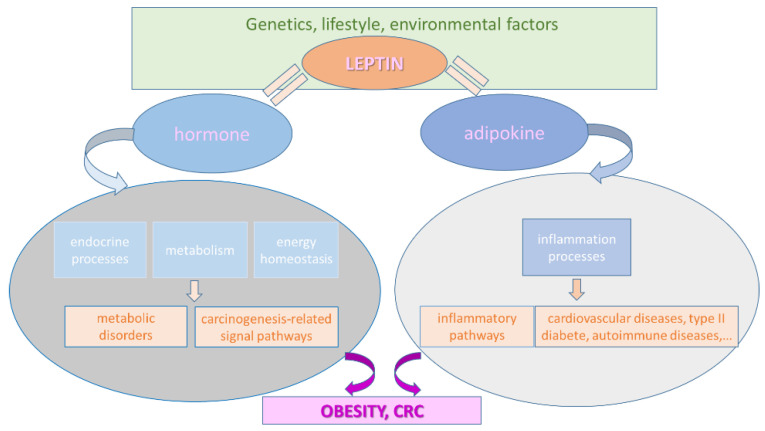
Obesity and colorectal cancer (CRC) are among the leading diseases causing deaths in the world, showing a complex multifactorial pathology. Obesity is considered a risk factor in CRC development through inflammation, metabolic, and signaling processes. Leptin is one of the most important adipokines related to obesity and an important proinflammatory marker, mainly expressed in adipose tissue, with many genetic variation profiles, many related influencing factors, and various functions that have been ascribed but not yet fully understood and elucidated, the most important ones being related to energy metabolism, as well as endocrine and immune systems. Aberrant signaling and genetic variations of leptin are correlated with obesity and CRC, with the genetic causality showing both inherited and acquired events, in addition to lifestyle and environmental risk factors; these might also be related to specific pathogenic pathways at different time points. Moreover, mutation gain is a crucial factor enabling the genetic process of CRC. Currently, the inconsistent and insufficient data related to leptin's relationship with obesity and CRC indicate the necessity of further related studies. This review summarizes the current knowledge on leptin genetics and its potential relationship with the main pathogenic pathways of obesity and CRC, in an attempt to understand the molecular mechanisms of these associations, in the context of inconsistent and contradictory data. The understanding of these mechanisms linking obesity and CRC could help to develop novel therapeutic targets and prevention strategies, resulting in a better prognosis and management of these diseases.
Keywords: LEP; LEPR; colorectal cancer; microbiome; obesity.
Conflict of interest statement
The authors declare no conflict of interest.
Figures
References
-
- World Health Organization Obesity and Overweight. [(accessed on 19 July 2021)]. Available online: http://www.who.int/news-room/fact-sheets/detail/obesity-and-overweight.
-
- World Obesity Obesity Classification. [(accessed on 19 July 2021)]. Available online: https://www.worldobesity.org/about/about-obesity/obesity-classification.
-
- Forstner S., Rusu A. Development of personalised food for the nutrition of elderly consumers. In: Dumitras D.E., Jitea I.M., Aerts S., editors. Know Your Food. Food Ethics and Innovation. Wageningen Academic Publishers; Wageningen, The Netherlands: 2015. pp. 24–28.
Publication types
MeSH terms
Substances
Grants and funding
LinkOut - more resources
Full Text Sources
Medical
Miscellaneous
