. 2022 Apr 26;23(9):4787.
doi: 10.3390/ijms23094787.

Long Non-Coding LEF1-AS1 Sponge miR-5100 Regulates Apoptosis and Autophagy in Gastric Cancer Cells via the miR-5100/DEK/AMPK-mTOR Axis

Affiliations

Long Non-Coding LEF1-AS1 Sponge miR-5100 Regulates Apoptosis and Autophagy in Gastric Cancer Cells via the miR-5100/DEK/AMPK-mTOR Axis

Huimin Zhang et al. Int J Mol Sci. .

Abstract

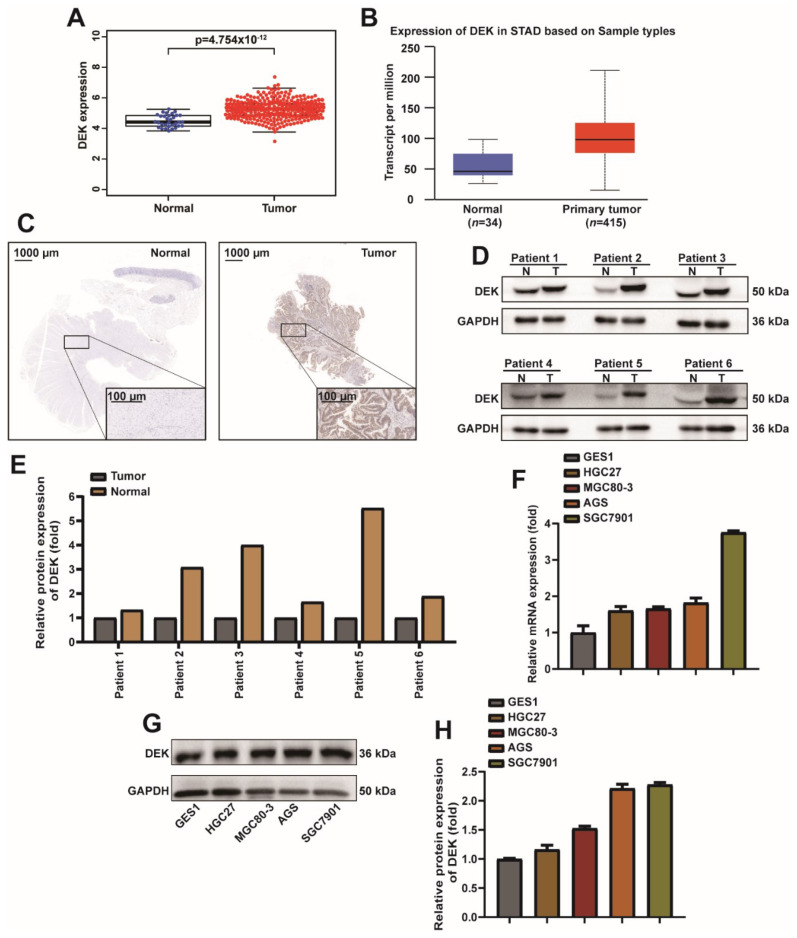
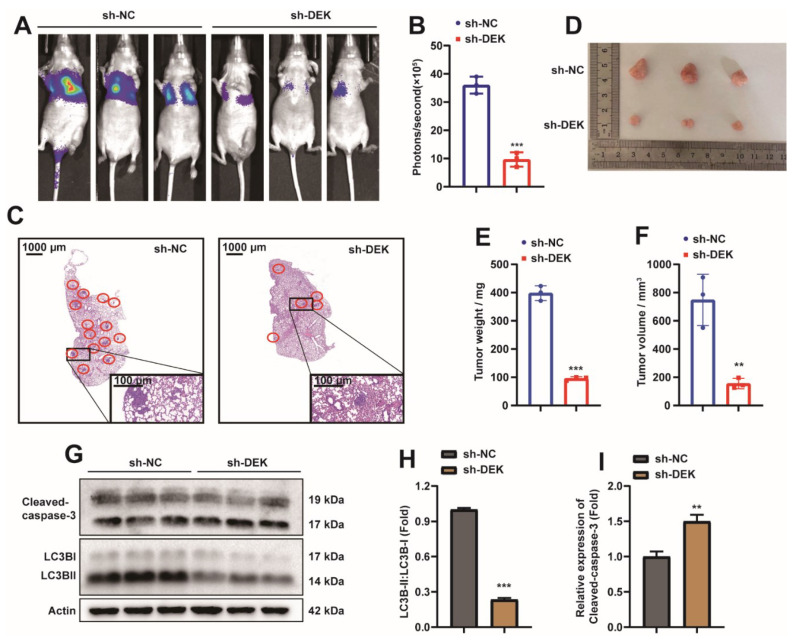
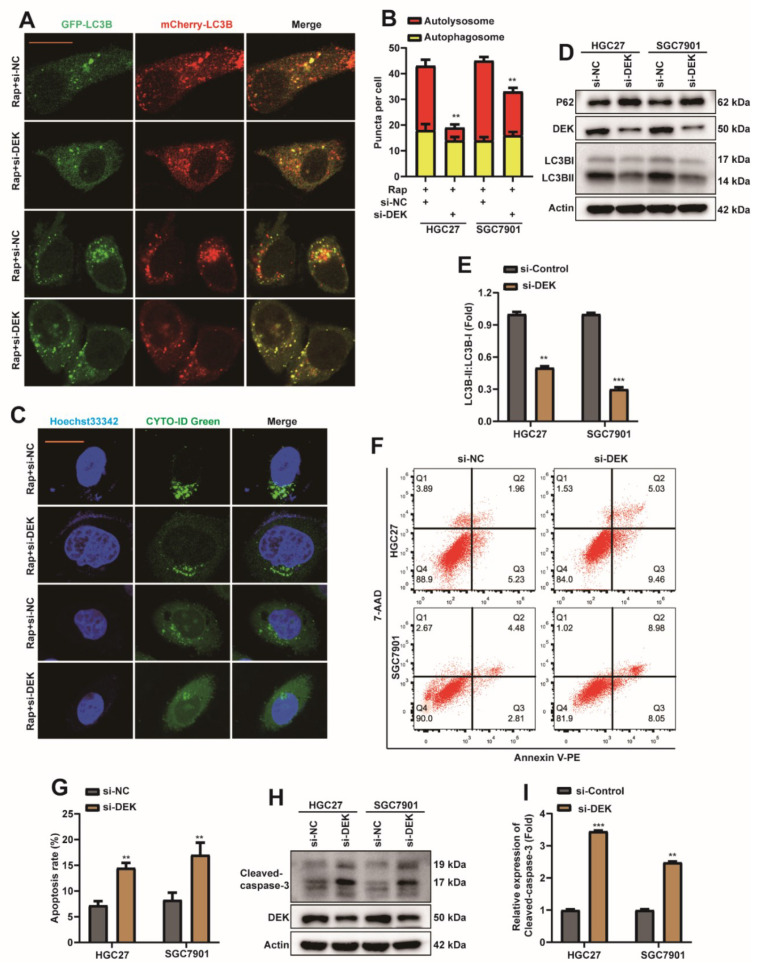
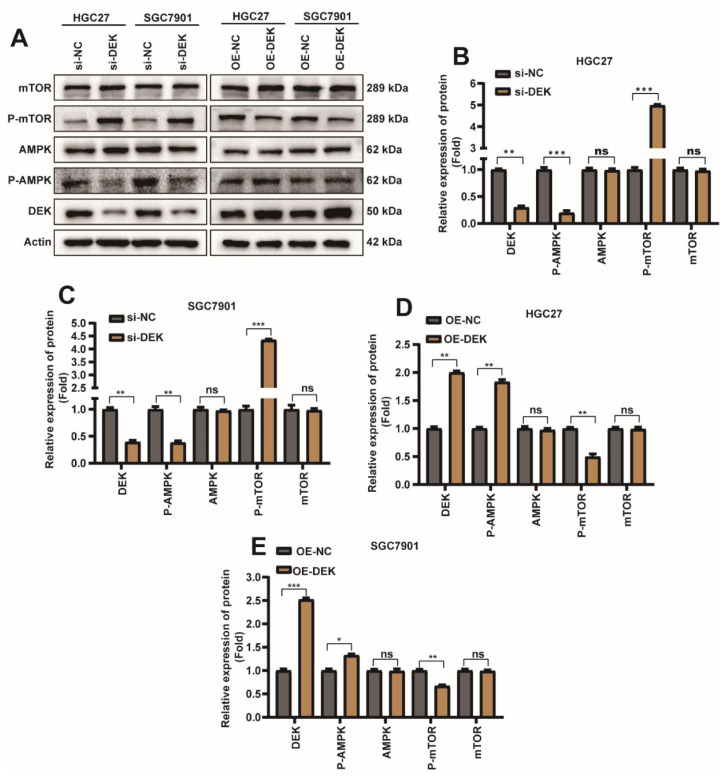
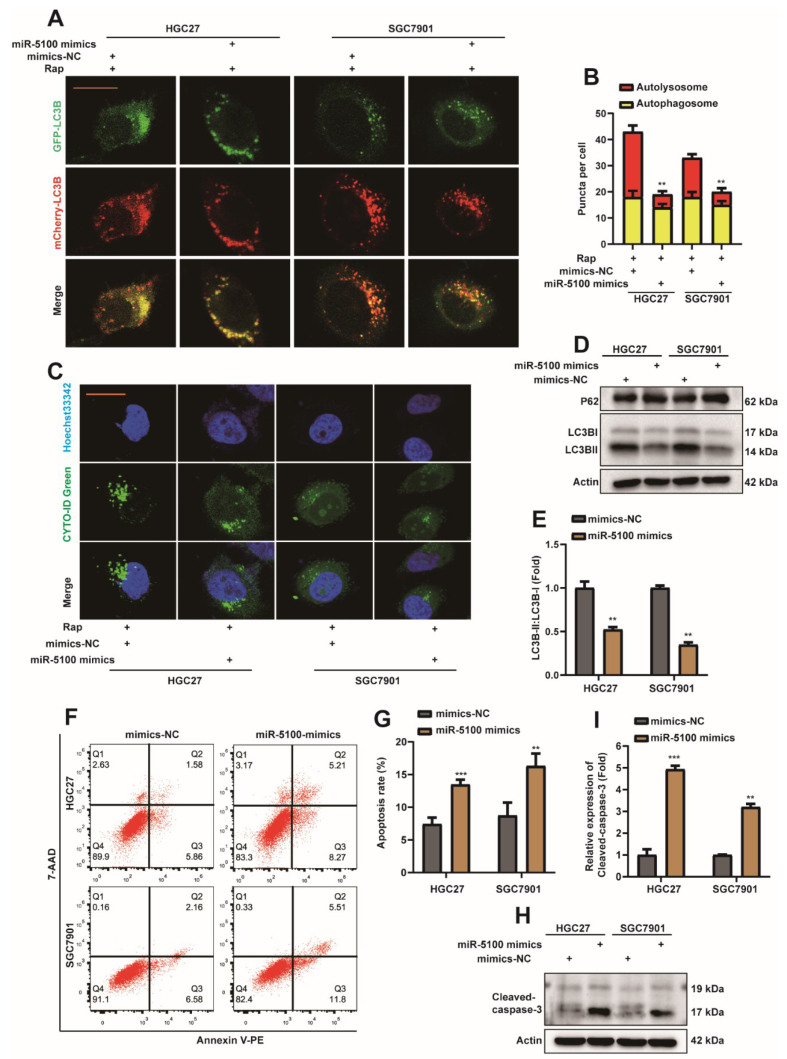
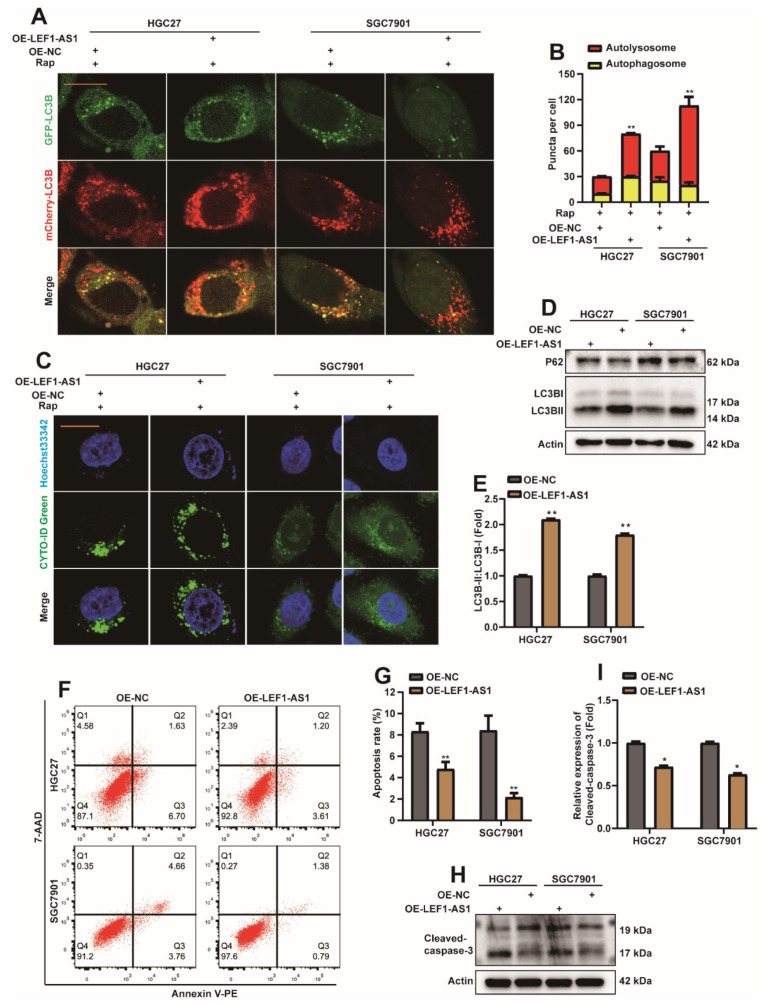
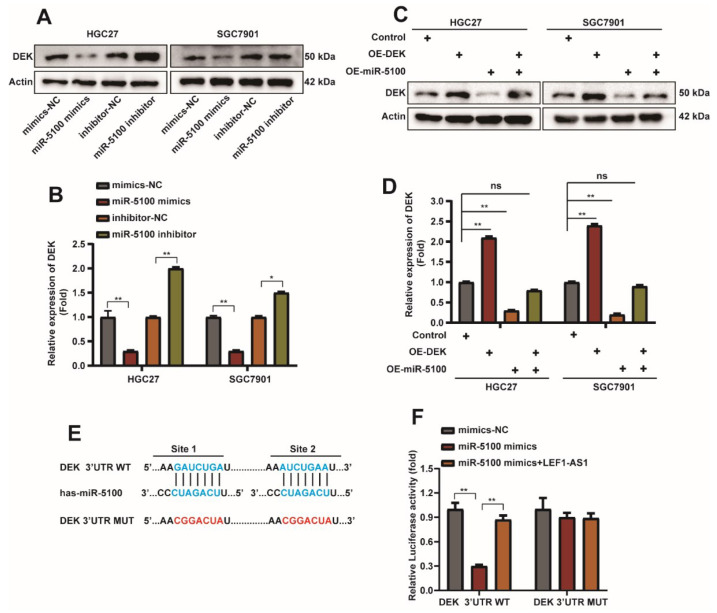
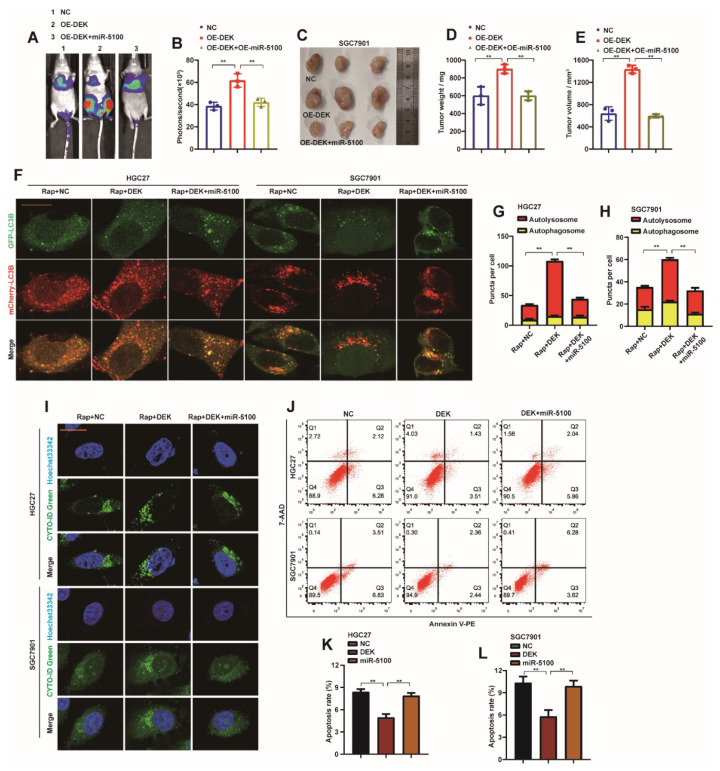
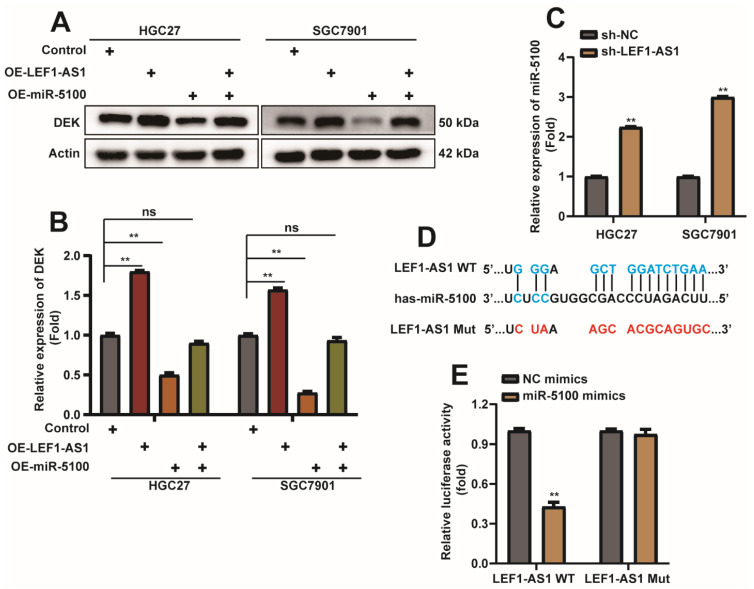
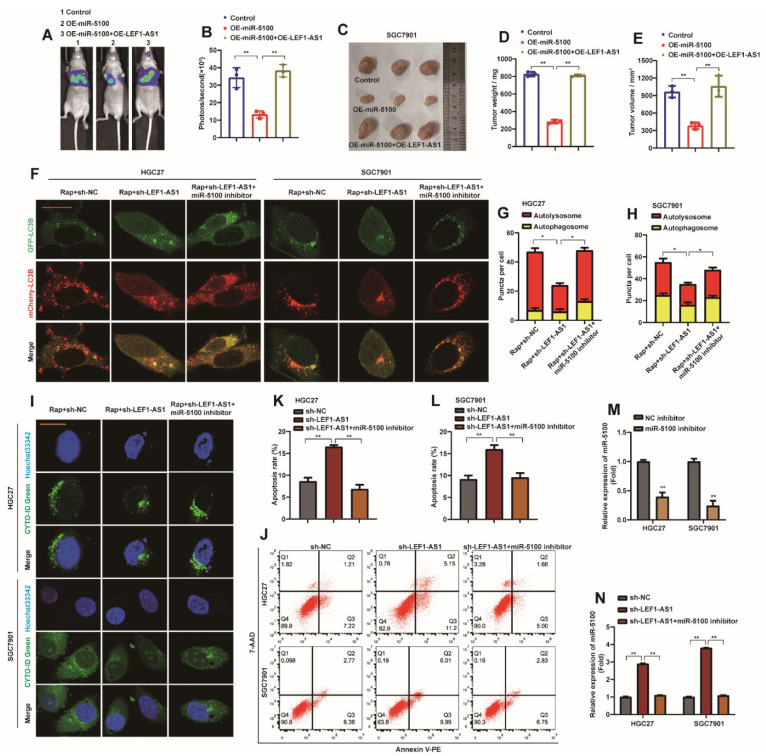
DEK and miR-5100 play critical roles in many steps of cancer initiation and progression and are directly or indirectly regulated by most promoters and repressors. LEF1-AS1 as a long non-coding RNA can regulate tumor development through sponge miRNA. The effect and regulatory mechanism of DEK on autophagy and apoptosis in gastric cancer (GC), and the role between miR-5100 and DEK or miR-5100 and LEF1-AS1 are still unclear. Our study found that DEK was highly expressed in gastric cancer tissues and cell lines, and knockdown of DEK inhibited the autophagy of cells, promoted apoptosis, and suppressed the malignant phenotype of gastric cancer. DEK regulates autophagy and apoptosis through the AMPK/mTOR signaling pathway. In addition, miR-5100 inhibits autophagy and promotes apoptosis in GC cells while LEF1-AS1 had the opposite effect. Studies have shown that miR-5100 acts by targeting the 3'UTR of DEK, and LEF1-AS1 regulates the expression of miR-5100 by sponging with mIR-5100. In conclusion, our results found that LEF1-AS1 and miR-5100 sponge function, and the miR-5100/DEK/AMPK/mTOR axis regulates autophagy and apoptosis in gastric cancer cells.

Keywords: DEK; LEF1-AS1; apoptosis; autophagy; miR-5100.


Conflict of interest statement

The authors declare that there is no conflict of interest.

Figures

Figure 1
Figure 1
DEK is highly expressed in GC tissues and cells. (A) TCGA database analysis of DEK levels in GC tissues and normal tissues. (B) DEK expression levels in STAD are predicted at the UALCAN. (C) Representative images of DEK immunohistochemistry (IHC) in normal tissue of GC (left) and GC tissue (right). (D) Western Blot assay detected DEK protein in normal tissues and GC tissues in 6 pairs of samples. (E) The Western Blot signal for each patient was normalized with GAPDH and presented as a histogram. (F) qPCR experiments to analyze DEK mRNA levels in GES1, HGC27, MGC80-3, AGS, and SGC7901 cell lines and normalized to GAPDH. (G,H) Western blot assay to detect DEK protein expression in GES1, HGC27, MGC80-3, AGS, and SGC7901 cell lines. Western Blot signals were normalized with Actin. Among them, the differentiation degree of HGC27, MGC8-3, AGS and SGC7901 cells increased in turn.
Figure 2
Figure 2
DEK accelerates the phenotype of GC. (A) Lung metastases were observed after luciferase-labeled DEK-knockdown (sh-DEK) or no-knockdown (sh-NC) SGC7901 cells were injected into nude mice via tail vein. (B) The luciferase bioluminescence values of mouse lung metastases (n = 3). (C) HE staining analysis of lung metastasis in nude mice. (D) Xenografts were obtained by subcutaneous injection of DEK-knockdown (sh-DEK) or no-knockdown (sh-NC) SGC7901 cells. (E,F) The weight and volume of subcutaneous xenografts were counted and presented in the form of histograms (**: p < 0.01, ***: p < 0.001). (G,H) Western Blot analysis in subcutaneous xenograft tissue LC3B expression, results were normalized with Actin, and LC3BII/I ratios were analyzed. (H,I) Western Blot analysis of Cleaved-caspase-3 protein in subcutaneous xenograft tissue and normalized with Actin (**: p < 0.01, ***: p < 0.001).
Figure 3
Figure 3
DEK promotes autophagy and inhibits apoptosis in GC cells. (A) si-DEK or si-NC were transfected into HGC27 or SGC7901 cell lines stably expressing mCherry-EGFP-LC3B. Cells were treated with 5 nM rapamycin (Rap) 24 h after transfection, and autophagic flux was observed 8 h later (scar bar = 40 μm) (**: p < 0.01). (B) Autophagosome (red dots) and Autolysosome (yellow dots) were counted and analyzed. (C) si-DEK or si-NC were transfected into HGC27 or SGC7901 cell lines. Cells were treated with 5 nM rapamycin (Rap) 24 h after transfection, and the level of autophagy was observed 8 h later. (D,E) si-DEK or si-NC were transfected into HGC27 or SGC7901 cell lines, and cells were harvested 36 h later. Western Blot detection of DEK, p62, LC3B proteins. The ratio of LC3BII/I was analyzed by normalization with Actin (n = 3, **: p < 0.01, ***: p < 0.001). (F,G) si-DEK or si-NC were transfected into HGC27 or SGC7901 cell lines, and the apoptosis rate was analyzed by flow cytometry after 36 h, and statistical analysis was performed. (H,I) si-DEK or si-NC was transfected into HGC27 or SGC7901 cell lines, and 36 h later, the expression of Cleaved-caspase-3 was detected by Western Blot, and quantitative analysis was performed (n = 3, **: p < 0.01, ***: p < 0.001).
Figure 4
Figure 4
DEK promotes autophagy and inhibits apoptosis in GC through AMPK/mTOR signaling pathway. si-DEK/si-NC was transfected into HGC27/SGC7901 cell line, similarly OE-DEK/OE-NC was transfected into HGC27/SGC7901 cell line. The cells were harvested 36 h after transfection. (A) The protein expression levels of DEK, AMPK, p-AMPK, mTOR and p-mTOR were detected by Weather Blot. (B) Quantitative analysis of Weather Blot results for DEK, AMPK, p-AMPK, mTOR, and p-mTOR proteins after si-NC/si-DEK in HGC27 cells, normalized with Actin protein signal. (C) Quantitative analysis of Weather Blot results for DEK, AMPK, p-AMPK, mTOR, and p-mTOR proteins after si-NC/si-DEK in SGC7901 cells, normalized with Actin protein signal. (D) Quantitative analysis of Weather Blot results for DEK, AMPK, p-AMPK, mTOR and p-mTOR proteins after HGC27 cells were subjected to OE-NC/OE-DEK, normalized with Actin protein signal. (E) Quantitative analysis of Weather Blot results for DEK, AMPK, p-AMPK, mTOR and p-mTOR proteins after OE-NC/OE-DEK in SGC7901 cells, normalized with Actin protein signal (n = 3, *: p < 0.05, **: p < 0.01, ***: p < 0.001).
Figure 5
Figure 5
miR-5100 inhibits autophagy and promotes apoptosis in GC cells. (A) miR-5100 mimics/mimics-NC were transfected into HGC27 or SGC7901 cell lines stably expressing mCherry-EGFP-LC3B. Cells were treated with 5 nM rapamycin (Rap) 24 h after transfection, and autophagic flux was observed 8 h later (scar bar = 40 μm). (B) Autophagosome (red dots) and Autolysosome (yellow dots) were counted and analyzed, **: p < 0.01. (C) miR-5100 mimics/mimics-NCs were transfected into HGC27 or SGC7901 cell lines. Cells were treated with 5 nM rapamycin (Rap) 24 h after transfection, and the level of autophagy was observed 8 h later. (D,E) miR-5100 mimics/mimics-NCs were transfected into HGC27 or SGC7901 cell lines, and cells were harvested 36 h later. Western Blot detection of DEK, p62, LC3B proteins. The ratio of LC3BII/I was analyzed by normalization with Actin (n = 3, **: p < 0.01). (F,G) miR-5100 mimics/mimics-NC were transfected into HGC27 or SGC7901 cell lines, and the apoptosis rate was analyzed by flow cytometry after 36 h, and statistical analysis was performed (n = 3, **: p < 0.01, ***: p <0.001). (H,I) miR-5100 mimics/mimics-NC was transfected into HGC27 or SGC7901 cell lines, and 36 h later, the expression of Cleaved-caspase-3 was detected by Western Blot, and quantitative analysis was performed (n = 3, **: p < 0.01, ***: p <0.001).
Figure 6
Figure 6
Long non-coding LEF1-AS1 promotes autophagy and inhibits apoptosis in GC cells. (A) OE-LEF1-AS1/OE-NC were transfected into HGC27 or SGC7901 cell lines stably expressing mCherry-EGFP-LC3B. Cells were treated with 5 nM rapamycin (Rap) 24 h after transfection, and autophagic flux was observed 8 h later (scar bar = 40 μm). (B) Autophagosome (red dots) and Autolysosome (yellow dots) were counted and analyzed (**: p < 0.01). (C) OE-LEF1-AS1/OE-NC were transfected into HGC27 or SGC7901 cell lines. Cells were treated with 5 nM rapamycin (Rap) 24 h after transfection, and the level of autophagy was observed 8 h later. (D,E) OE-LEF1-AS1/OE-NC were transfected into HGC27 or SGC7901 cell lines, and cells were harvested 36 h later. Western Blot detection of DEK, p62, LC3B proteins. The ratio of LC3BII/I was analyzed by normalization with Actin (n = 3, **: p < 0.01). (F,G) OE-LEF1-AS1/OE-NC was transfected into HGC27 or SGC7901 cell lines, and the apoptosis rate was analyzed by flow cytometry after 36 h, and statistical analysis was performed (n = 3, **: p < 0.01). (H,I) OE-LEF1-AS1/OE-NC was transfected into HGC27 or SGC7901 cell lines, and the expression of Cleaved-caspase-3 was detected by Western Blot 36 h later, and quantitative analysis was performed (n = 3, *: p < 0.05).
Figure 7
Figure 7
miR-5100 can directly bound to the 3′UTR of DEK and regulate DEK expression. (A,B) Western Blot detection of DEK expression when miR-5100 mimics/mimics-NC/miR-5100 inhibitor/inhibitor-NC was transfected into HGC27 and SGC7901 cells for 36 h, and the experimental results were quantified with Actin Normalized (n = 3, *: p < 0.05, **: p < 0.01). (C,D) Western blot detection of DEK protein when miR-5100 mimics + OE-NC/OE-DEK + mimics-NC/5100 mimics + OE-DEK were transfected into HGC27 and SGC7901 cells, co-transfected with mimics-NC and OE-NC as controls. Quantitative analysis of experimental results was normalized with Actin (n = 3, **: p < 0.01). (E) Construction of WTDEK- Schematic representation of the 3′UTR-WT and DEK-3′UTR-Mut luciferase reporter plasmids. (F) DEK 3′UTR-WT/Mut and mimics-NC/miR-5100 mimics/miR-5100 mimics + LEF1-AS1 were co-transfected, and the luciferase reporter assay verified the targeting between miR-5100 and DEK effect (n = 3, **: p < 0.01).
Figure 8
Figure 8
miR-5100 reverses the malignant phenotype of GC induced by abnormal expression of DEK. (A,B) pre-miR-5100 was introduced into SGC7901-DEK cell lines by lentiviral method, the resulting cell lines were labeled with luciferase, and then injected into nude mice by tail vein to detect the lungs of nude mice Department transfer situation. Statistical analysis of the fluorescence signal intensity was performed (n = 3, **: p < 0.01). (CE) Pre-miR-5100 was introduced in SGC7901-DEK cell line, SGC7901-DEK/SGC7901-DEK + miR-5100 or control cell line was injected subcutaneously into nude mice, and subcutaneous xenografts were harvested and treated. Allograft mass and volume were statistically analyzed (**: p < 0.01). (F) HGC27-DEK/SGC7901-DEK cells stably expressing mCherry-EGFP-LC3B were introduced with pre-miR-5100, respectively, and cells were treated with 5 nM Rap for 8 h, and the level of autophagic flux was observed under confocal microscopy. (G,H) Autophagosome (red dots) and Autolysosome (yellow dots) were analyzed (**: p < 0.01). (I) Pre-miR-5100 was introduced into HGC27-DEK/SGC7901-DEK cells, and the level of autophagy were observed under confocal microscopy after 5 nM Rap treatment for 8 h. (JL) Pre-miR-5100 was introduced into HGC27-DEK/SGC7901-DEK cells, and the apoptosis level of the cells was detected by flow cytometry, and the results were statistically analyzed (n = 3, **: p < 0.01).
Figure 9
Figure 9
LEF1-AS1 sponge adsorbs miR-5100 and regulates the expression of miR-5100. (A,B) Western Blot detection of DEK protein when OE-LEF1-AS1 + mimics-NC/miR-5100 mimics + OE-NC/5100 mimics + OE-LEF1-AS1 was transfected into HGC27 and SGC7901 cells, and co-transfected with mimics -NC and OE-NC were used as controls. Quantitative analysis of experimental results was normalized with Actin (n = 3, **: p < 0.01). (C) qPCR was used to detect the expression level of mIR-5100 in HGC27- sh-LEF1-AS1 and SGC7901-sh-LEF1-AS1 cell lines, U6 was used as normalization (n = 3, **: p < 0.01). (D) Schematic diagram of construction of LEF1-AS1-WT and LEF1-AS1-Mut luciferase reporter plasmids. (E) LEF1-AS1-WT/Mut and mimics-NC/miR-5100 mimics were co-transfected, and the luciferase reporter assay verified the sponge effect between miR-5100 and LEFAS1 (n = 3, **: p < 0.01).
Figure 10
Figure 10
LEF1-AS1 reverses the malignant phenotype of GC induced by abnormal expression of miR-5100. (A,B) LEF1-AS1 was introduced into SGC7901-miR-5100 cell line by lentiviral method, then the cell line was labeled with luciferase, and then injected into nude mice by tail vein to detect the lung metastasis of nude mice. Statistical analysis of the fluorescence signal intensity was performed (n = 3, **: p < 0.01). (CE) LEF1-AS1 was introduced in SGC7901-miR-5100 cell line, SGC7901-miR-5100/SGC7901-miR-5100 + LEF1-AS1 or control cell line was injected subcutaneously into nude mice, and subcutaneous heterozygous cells were harvested. Tumors were implanted and the mass and volume of the xenografted tumors were statistically analyzed (**: p < 0.01). (F) HGC27-sh-LEF1-AS1/SGC7901-sh-LEF1-AS1 cells stably expressing mCherry-EGFP-LC3B were transfected with miR-5100 inhibitor, respectively, and cells were treated with 5 nM Rap for 8 h under confocal microscopy The levels of autophagic flux were observed. (G,H) Autophagosome (red dots) and Autolysosome (yellow dots) were analyzed (*: p < 0.05). (I) HGC27-sh-LEF1-AS1/SGC7901-sh-LEF1-AS1 cells were transfected with miR-5100 inhibitor and treated with 5 nM Rap for 8 h to observe the level of autophagy under a confocal microscope. (JL) HGC27-sh-LEF1-AS1/SGC7901-sh-LEF1-AS1 cells were transfected with miR-5100 inhibitor, the apoptosis level of cells was detected by flow cytometry, and the results were statistically analyzed (n = 3, **: p < 0.01).

Similar articles

Cited by

References

    1. Waldum H., Fossmark R. Gastritis, Gastric Polyps and Gastric Cancer. Int. J. Mol. Sci. 2021;22:6548. doi: 10.3390/ijms22126548. - DOI - PMC - PubMed
    1. Bray F., Ferlay J., Soerjomataram I., Siegel R.L., Torre L.A., Jemal A. Global cancer statistics 2018: GLOBOCAN estimates of incidence and mortality worldwide for 36 cancers in 185 countries. CA A Cancer J. Clin. 2018;68:394–424. doi: 10.3322/caac.21492. - DOI - PubMed
    1. Li S., Yang X., Li W., Chen Z. Comprehensive Analysis of E2F Family Members in Human Gastric Cancer. Front. Oncol. 2021;11:625257. doi: 10.3389/fonc.2021.625257. - DOI - PMC - PubMed
    1. Recio-Boiles A., Babiker H.M. StatPearls. StatPearls Publishing LLC; Treasure Island, FL, USA: 2022. Gastric Cancer. StatPearls Publishing Copyright © 2022.
    1. Khodadoust M.S., Verhaegen M., Kappes F., Riveiro-Falkenbach E., Cigudosa J.C., Kim D.S., Chinnaiyan A.M., Markovitz D.M., Soengas M.S. Melanoma proliferation and chemoresistance controlled by the DEK oncogene. Cancer Res. 2009;69:6405–6413. doi: 10.1158/0008-5472.CAN-09-1063. - DOI - PMC - PubMed

MeSH terms