. 2022 Apr 28;23(9):4891.
doi: 10.3390/ijms23094891.

A Novel High Content Angiogenesis Assay Reveals That Lacidipine, L-Type Calcium Channel Blocker, Induces In Vitro Vascular Lumen Expansion

Affiliations

A Novel High Content Angiogenesis Assay Reveals That Lacidipine, L-Type Calcium Channel Blocker, Induces In Vitro Vascular Lumen Expansion

Dorota A Nawrot et al. Int J Mol Sci. .

Abstract

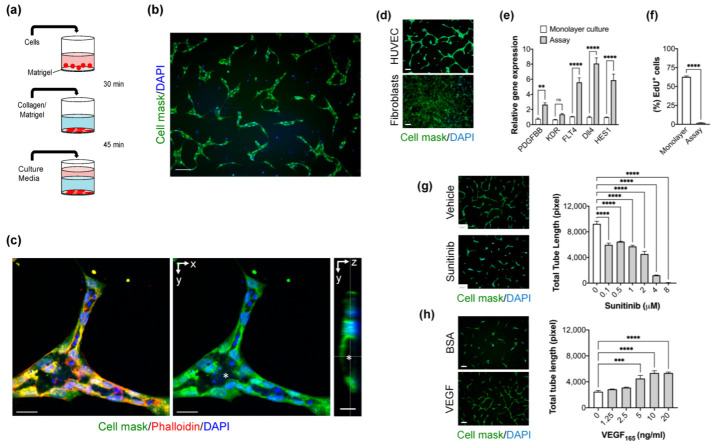
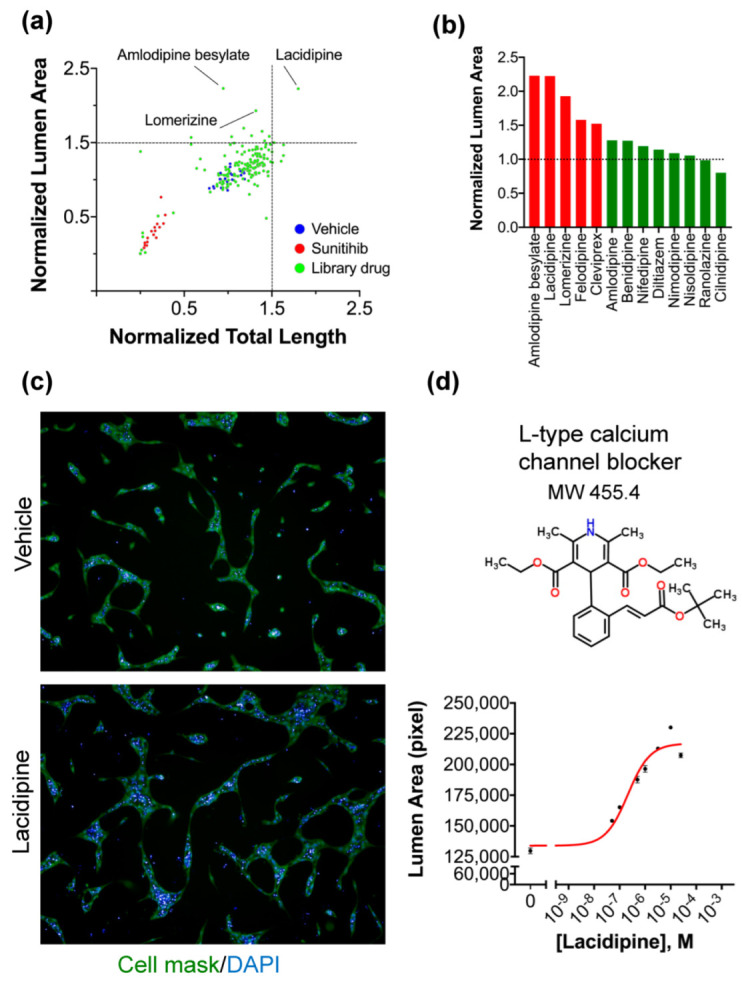
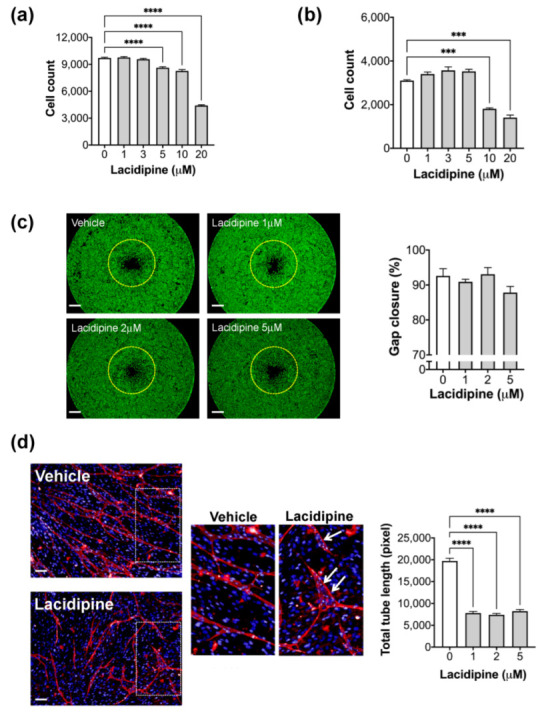
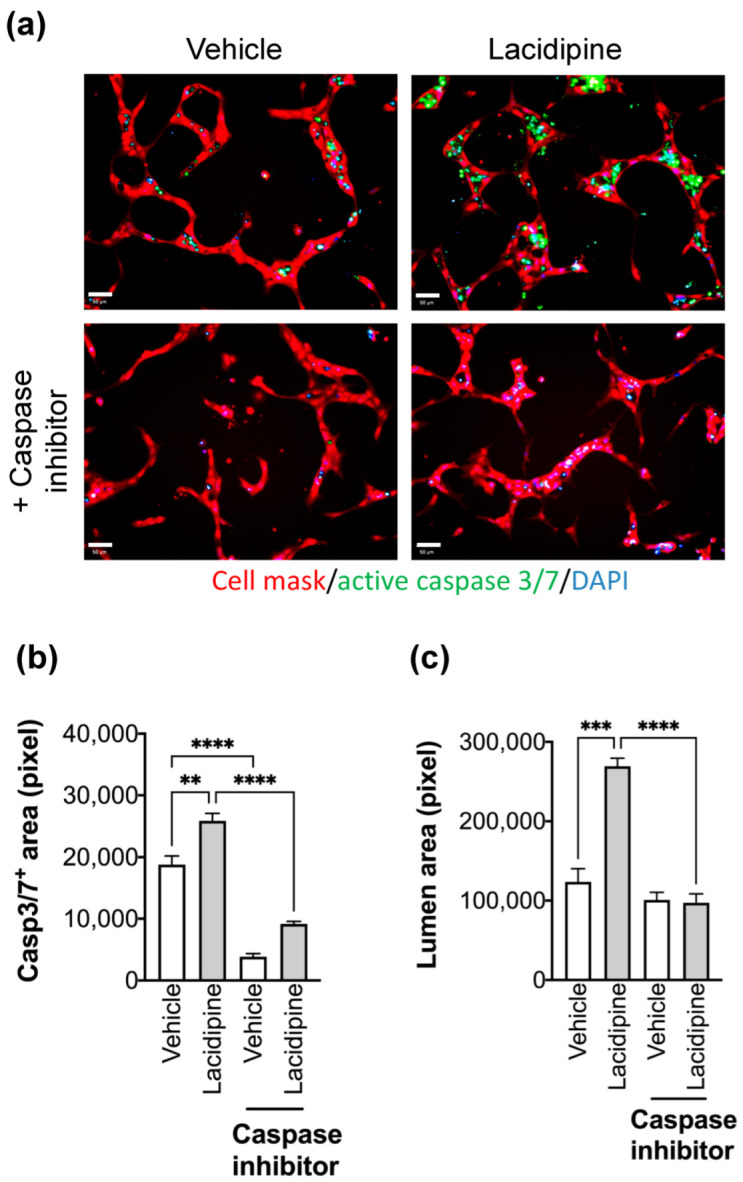
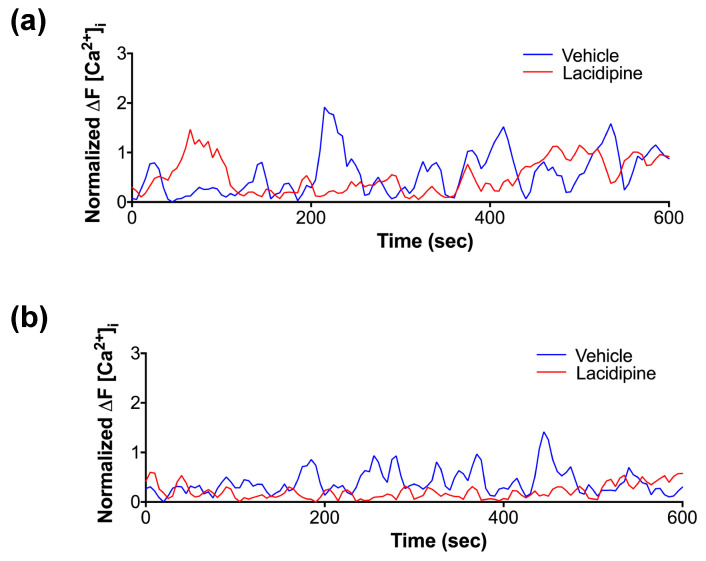
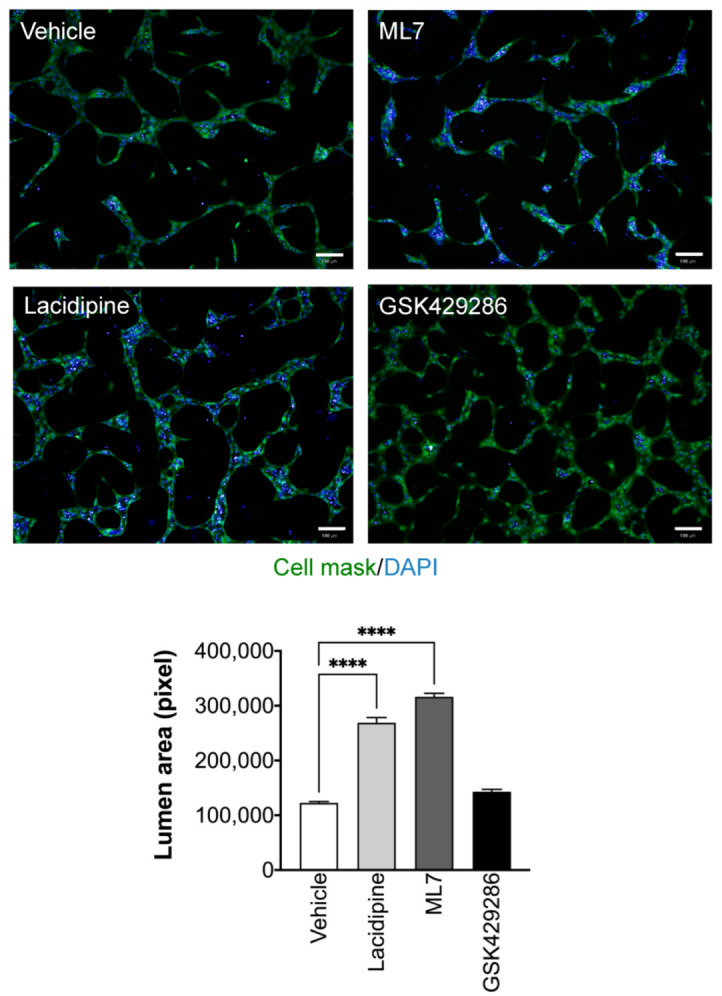
Angiogenesis is a critical cellular process toward establishing a functional circulatory system capable of delivering oxygen and nutrients to the tissue in demand. In vitro angiogenesis assays represent an important tool for elucidating the biology of blood vessel formation and for drug discovery applications. Herein, we developed a novel, high content 2D angiogenesis assay that captures endothelial morphogenesis's cellular processes, including lumen formation. In this assay, endothelial cells form luminized vascular-like structures in 48 h. The assay was validated for its specificity and performance. Using the optimized assay, we conducted a phenotypic screen of a library containing 150 FDA-approved cardiovascular drugs to identify modulators of lumen formation. The screening resulted in several L-type calcium channel blockers being able to expand the lumen space compared to controls. Among these blockers, Lacidipine was selected for follow-up studies. We found that the endothelial cells treated with Lacidipine showed enhanced activity of caspase-3 in the luminal space. Pharmacological inhibition of caspase activity abolished the Lacidipine-enhancing effect on lumen formation, suggesting the involvement of apoptosis. Using a Ca2+ biosensor, we found that Lacipidine reduces the intracellular Ca2+ oscillations amplitude in the endothelial cells at the early stage, whereas Lacidipine blocks these Ca2+ oscillations completely at the late stage. The inhibition of MLCK exhibits a phenotype of lumen expansion similar to that of Lacidipine. In conclusion, this study describes a novel high-throughput phenotypic assay to study angiogenesis. Our findings suggest that calcium signalling plays an essential role during lumen morphogenesis. L-type Ca2+ channel blockers could be used for more efficient angiogenesis-mediated therapies.

Keywords: angiogenesis; high-content screening; in vitro angiogenesis assay; lacidipine; lumen formation.


Conflict of interest statement

The authors declare that they have no conflict of interest.

Figures

Figure 1
Figure 1
Optimization and validation of the novel 2D angiogenesis assay. (a) Workflow of the assay: HUVECs were seeded on coated 96-well plates with a thin layer of Matrigel. Extracellular matrix gel (type I collagen/Matrigel) was added on adhered HUVEC. Following gel polymerization, media was added and incubated for 48 h. (b) Representative fluorescent image showing the vascular-like structures formed by HUVEC cultured with type I collagen/Matrigel mixture. Cells were stained with HCS Cell Mask (green), and DAPI (Blue). Scale bar = 100 μm. (c) Confocal Z-stack imaging of a vascular-like unit showing the lumen (*) formation is associated with polarized endothelial cells. Cells are stained with HCS Cell Mask (green), Phalloidin (Red), and DAPI (Blue). xy plane (middle) and yz plane (right). Scale bar = 30 μm. (d) Morphology of cultured fibroblasts compared to HUVEC using the angiogenesis assay. Scale bar = 100 μm (e) Levels of pro-angiogenic genes: PDGFB, KDR, FLT4, Dll4, and HES1 mRNA expression detected by quantitative RT-PCR in HUVEC cultured in the angiogenesis assay compared to HUVEC cultured in monolayer settings. Error bars, mean ± SEM, n = 3. Unpaired t-test, ** p < 0.01, *** p < 0.001 compared with monolayer culture conditions. (ns) non significant. (f) The proliferative activity of HUVEC cultured in angiogenesis assay for 48 h as measured by EdU staining, n = 6 per condition, unpaired t-test, Data are mean ± S.E.M, ** p < 0.01, *** p < 0.001. (g) Right panel, the effect of the anti-angiogenic compound, Sunitinib, with various concentrations on the tube formation (total tube length) using the angiogenesis assay. Data are shown as mean ± S.E.M. n = 3 wells per concentration. one-way ANOVA followed by Bonferroni’s post hoc test, **** p < 0.0001 compared to the vehicle. Left panel, representative fluorescent image of the cultures treated with Sunitinib (4 μM) and DMSO (vehicle). Cells were stained with Cell Mask (green) and DAPI (blue). Scale bar = 100 μm. (h) Effect of VEGF on tube formation. The assay was conducted in growth factor-free media (EBM). n = 3 wells per concentration. Error bars, mean ± S.E.M, one-way ANOVA followed by Bonferroni’s post hoc test, **** p < 0.0001 compared to vehicle. Left panel, representative fluorescent image of the cultures treated with VEGF (20 ng/mL) and Bovine Serum Albumin “BSA” (control). Cells were stained with Cell Mask (green) and DAPI (blue). Scale bar = 100 µm.
Figure 2
Figure 2
High-content screening of the cardiovascular compound library using the angiogenesis assay and hit identification. (a) Scatter-plot distribution showing the results of high-content screening. The lumen area and the total tube length were normalized to controls treated with vehicle (DMSO). Enhancer hits of the lumen area are indicated below and above the dotted lines (hit threshold was calculated as follows: median(vehicle) + 4 × standard deviation(vehicle)). Negative controls (are shown in blue positive controls in red and drug library molecules in green. (b) Calcium blockers (in red) were identified as enhancers of lumen formation from the library. (c) Representative fluorescent images from negative control (vehicle) and Lacidipine (enhancer hit for lumen area). Scale bar = 100 µm. (d) Dose–response curve demonstrating the effect of Lacidipine on lumen size using the angiogenesis assay. Data are expressed as mean ± SEM. n = 3 per concentration. The EC50 was calculated as 250 nM.
Figure 3
Figure 3
Effect of Lacidipine on the endothelial cell functions. Effect of Lacidipine on cell proliferation in HUVEC cultured as a monolayer (a) or in the angiogenesis assay (b); n = 6 per concentration, cell count was assessed after 48 h of assay initiation. Data expressed as mean ± SEM, one-way ANOVA followed by Bonferroni’s post hoc test, *** p < 0.001 compared with vehicle. (c) Representative fluorescence images following OrisTM migration assay of HUVEC treated with vehicle or Lacidipine (1, 2, and 5 μM) for 22 h. The yellow dotted line represents the cell edge at 0 h after removing the stoppers. Scale bar = 0.5 mm. (Right panel): quantification of cell migration. The graph represents the average per cent of gap closure ± S.E.M. from six independent experiments. Unpaired student’s t-test was used. No significant differences between groups were detected. (d) The effect of Lacipidine (1, 2, and 5 μM) on tube formation was assessed in a coculture angiogenesis assay where HUVECs were plated on a confluent human dermal fibroblast layer. The medium containing the compound was refreshed on days 3 and 5 following the plating of endothelial cells. Cocultures were stained with an antibody against CD31 and imaged 7 days after endothelial cell plating. The representative fluorescence images of the cocultures treated with Lacidipine (5 μM) and DMSO (vehicle). Inset, “White arrows” indicate the newly formed lumens. (Left panel), total tube length was quantified in nine fields for each well (n = 6 wells per group). Error bars, mean ± SEM, one-way ANOVA followed by Bonferroni’s post hoc test, **** p < 0.001 as compared with vehicle. Scale bar = 100 μm.
Figure 4
Figure 4
Effect of Lacidipine on the lumen formation is mediated by endothelial cell apoptosis. (a) Cell apoptosis was detected by assessing the caspase 3/7 activity (CellEvent™ Caspase-3/7 Green Detection Reagent, Invitrogen) in the presence of Lacipidine (5 μM) or vehicle (DMSO). The caspase inhibitor was Z-VAD-FMK (100 μM). Cells were fixed after labelling the active caspase 3/7 (green), nuclei were counterstained with DAPI (blue), and the cell body was stained with Cell Mask deep red (red). Scale bar = 50 μm. Caspase 3/7 positive area (b) and lumen area (c) were quantified in nine fields for each well (n = 4 per condition), data are expressed as mean ± S.E.M, one-way ANOVA followed by Bonferroni’s post hoc test, ** p < 0.01, *** p < 0.001, **** p < 0.0001.
Figure 5
Figure 5
Ca2+ imaging to detect the endogenous intracellular changes of Ca2+ at early and late stages of tube formation. To monitor the intracellular temporal Ca2+ dynamics, HUVEC were stably infected with genetically encoded Ca2+ FRET sensor (GCaMP) using a lentiviral vector. Cells were time-lapse imaged using the high-content imaging system (Operetta) with 20× objective at 5 s intervals for 10 min. The fluorescent signal was quantified using Harmony imaging software. For each individually tracked cell, a spherical region of interest to avoid overlapping with adjacent cells. The mean fluorescent intensity of all cells at every time point was normalized to the baseline fluorescent intensity of GCaMP6. The graph traces are representative of three independent experiments. A total of 25–40 cells were included in the quantification for each experiment. (a) Representative traces illustrating a pattern of repeated iCa2+ spikes in HUVEC at an early stage (1 h) of the angiogenesis assay. (b) Representative traces showing that the generated iCa2+ spikes in the presence of Lacidipine (5 μM) for 24 h.
Figure 6
Figure 6
Lacidipine induces lumen formation through MLCK inhibition rather than ROCK inhibition. Representative fluorescence images of ML7, a myosin light chain kinase inhibitor (1 μM), which enhances the lumen formation with a similar phenotype of Lacidipine. However, the ROCK inhibitor (GSK429286, 5 μM) did not enhance the lumen formation. n = 4 per condition, data are expressed as mean ± S.E.M, one-way ANOVA followed by Bonferroni’s post hoc test, **** p < 0.0001 as compared to vehicle; scale bar = 100 μm.

References

    1. Eelen G., Treps L., Li X., Carmeliet P. Basic and Therapeutic Aspects of Angiogenesis Updated. Circ. Res. 2020;127:310–329. doi: 10.1161/CIRCRESAHA.120.316851. - DOI - PubMed
    1. Geudens I., Gerhardt H. Coordinating cell behaviour during blood vessel formation. Development. 2011;138:4569–4583. doi: 10.1242/dev.062323. - DOI - PubMed
    1. Eilken H.M., Adams R.H. Dynamics of endothelial cell behavior in sprouting angiogenesis. Curr. Opin. Cell Biol. 2010;22:617–625. doi: 10.1016/j.ceb.2010.08.010. - DOI - PubMed
    1. Gerhardt H., Golding M., Fruttiger M., Ruhrberg C., Lundkvist A., Abramsson A., Jeltsch M., Mitchell C., Alitalo K., Shima D., et al. VEGF guides angiogenic sprouting utilizing endothelial tip cell filopodia. J. Cell Biol. 2003;161:1163–1177. doi: 10.1083/jcb.200302047. - DOI - PMC - PubMed
    1. Kerbel R.S. Tumor angiogenesis. N. Engl. J. Med. 2008;358:2039–2049. doi: 10.1056/NEJMra0706596. - DOI - PMC - PubMed

MeSH terms