A Single-Cell Raman Spectroscopy Analysis of Bone Marrow Mesenchymal Stem/Stromal Cells to Identify Inter-Individual Diversity
- PMID: 35563306
- PMCID: PMC9103070
- DOI: 10.3390/ijms23094915
A Single-Cell Raman Spectroscopy Analysis of Bone Marrow Mesenchymal Stem/Stromal Cells to Identify Inter-Individual Diversity
Abstract
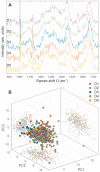
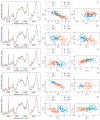
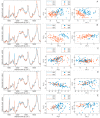
The heterogeneity of stem cells represents the main challenge in regenerative medicine development. This issue is particularly pronounced when it comes to the use of primary mesenchymal stem/stromal cells (MSCs) due to a lack of identification markers. Considering the need for additional approaches in MSCs characterization, we applied Raman spectroscopy to investigate inter-individual differences between bone marrow MSCs (BM-MSCs). Based on standard biological tests, BM-MSCs of analyzed donors fulfill all conditions for their characterization, while no donor-related specifics were observed in terms of BM-MSCs morphology, phenotype, multilineage differentiation potential, colony-forming capacity, expression of pluripotency-associated markers or proliferative capacity. However, examination of BM-MSCs at a single-cell level by Raman spectroscopy revealed that despite similar biochemical background, fine differences in the Raman spectra of BM-MSCs of each donor can be detected. After extensive principal component analysis (PCA) of Raman spectra, our study revealed the possibility of this method to diversify BM-MSCs populations, whereby the grouping of cell populations was most prominent when cell populations were analyzed in pairs. These results indicate that Raman spectroscopy, as a label-free assay, could have a huge potential in understanding stem cell heterogeneity and sorting cell populations with a similar biochemical background that can be significant for the development of personalized therapy approaches.
Keywords: Raman spectroscopy; human bone marrow mesenchymal stem/stromal cells (BM-MSCs); inter-individual heterogeneity; single cell.
Conflict of interest statement
The authors declare no conflict of interest.
Figures


Similar articles
-
Bone marrow from periacetabular osteotomies as a novel source for human mesenchymal stromal cells.Stem Cell Res Ther. 2023 Nov 3;14(1):315. doi: 10.1186/s13287-023-03552-9. Stem Cell Res Ther. 2023. PMID: 37924114 Free PMC article.
-
Bone marrow-derived dedifferentiated fat cells exhibit similar phenotype as bone marrow mesenchymal stem cells with high osteogenic differentiation and bone regeneration ability.J Orthop Surg Res. 2023 Mar 11;18(1):191. doi: 10.1186/s13018-023-03678-9. J Orthop Surg Res. 2023. PMID: 36906634 Free PMC article.
-
Adipose tissue-derived multipotent stromal cells have a higher immunomodulatory capacity than their bone marrow-derived counterparts.Stem Cells Transl Med. 2013 Jun;2(6):455-63. doi: 10.5966/sctm.2012-0184. Epub 2013 May 21. Stem Cells Transl Med. 2013. PMID: 23694810 Free PMC article.
-
Same or not the same? Comparison of adipose tissue-derived versus bone marrow-derived mesenchymal stem and stromal cells.Stem Cells Dev. 2012 Sep 20;21(14):2724-52. doi: 10.1089/scd.2011.0722. Epub 2012 May 9. Stem Cells Dev. 2012. PMID: 22468918 Review.
-
Different Sources of Mesenchymal Stem Cells for Tissue Regeneration: A Guide to Identifying the Most Favorable One in Orthopedics and Dentistry Applications.Int J Mol Sci. 2022 Jun 6;23(11):6356. doi: 10.3390/ijms23116356. Int J Mol Sci. 2022. PMID: 35683035 Free PMC article. Review.
Cited by
-
Raman analysis of lipids in cells: Current applications and future prospects.J Pharm Anal. 2025 Apr;15(4):101136. doi: 10.1016/j.jpha.2024.101136. Epub 2024 Nov 1. J Pharm Anal. 2025. PMID: 40242217 Free PMC article. Review.
-
Label-Free, Noninvasive Bone Cell Classification by Hyperspectral Confocal Raman Microscopy.Chem Biomed Imaging. 2024 Jan 24;2(2):147-155. doi: 10.1021/cbmi.3c00106. eCollection 2024 Feb 26. Chem Biomed Imaging. 2024. PMID: 38425368 Free PMC article.
-
Raman Microscopy and Bone.Methods Mol Biol. 2025;2885:683-691. doi: 10.1007/978-1-0716-4306-8_33. Methods Mol Biol. 2025. PMID: 40448785
-
Optical diffraction tomography and Raman spectroscopy reveal distinct cellular phenotypes during white and brown adipocyte differentiation.Biosens Bioelectron. 2023 Sep 1;235:115388. doi: 10.1016/j.bios.2023.115388. Epub 2023 May 12. Biosens Bioelectron. 2023. PMID: 37207582 Free PMC article.
-
Advances in the application of Raman spectroscopy in haematological tumours.Front Bioeng Biotechnol. 2023 Jan 10;10:1103785. doi: 10.3389/fbioe.2022.1103785. eCollection 2022. Front Bioeng Biotechnol. 2023. PMID: 36704299 Free PMC article. Review.
References
MeSH terms
Grants and funding
LinkOut - more resources
Full Text Sources

