

CD44+ and CD133+ Non-Small Cell Lung Cancer Cells Exhibit DNA Damage Response Pathways and Dormant Polyploid Giant Cancer Cell Enrichment Relating to Their p53 Status
- PMID: 35563313
- PMCID: PMC9101266
- DOI: 10.3390/ijms23094922
CD44+ and CD133+ Non-Small Cell Lung Cancer Cells Exhibit DNA Damage Response Pathways and Dormant Polyploid Giant Cancer Cell Enrichment Relating to Their p53 Status
Abstract
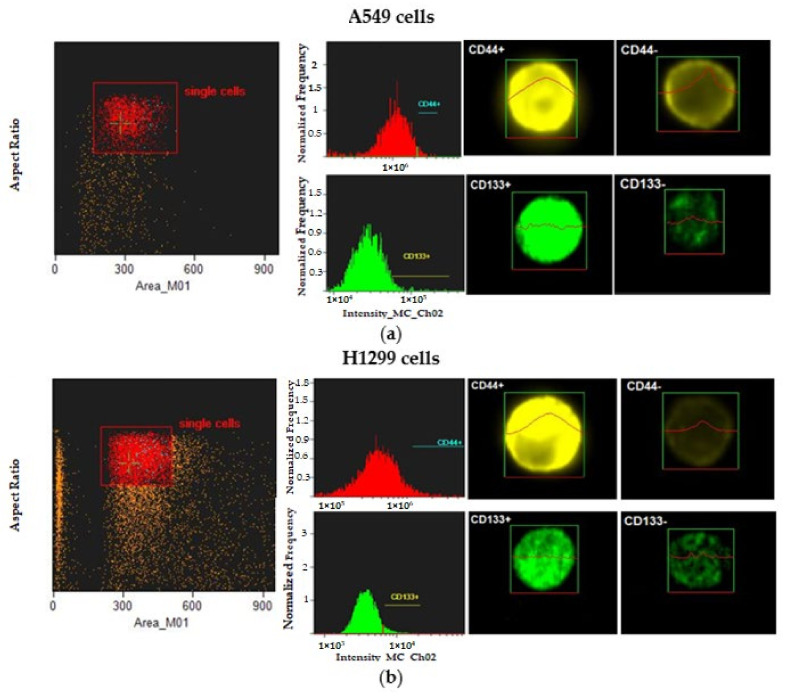
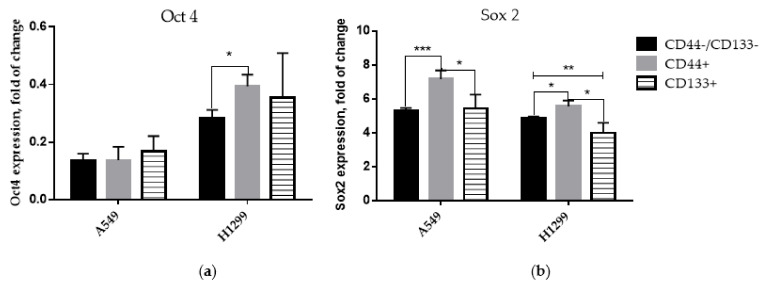
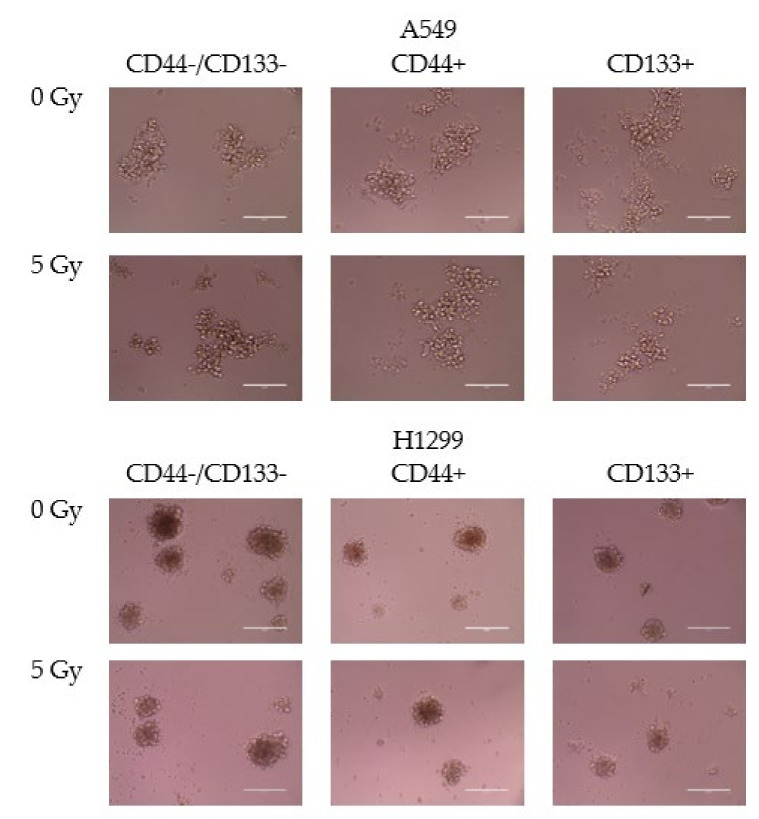
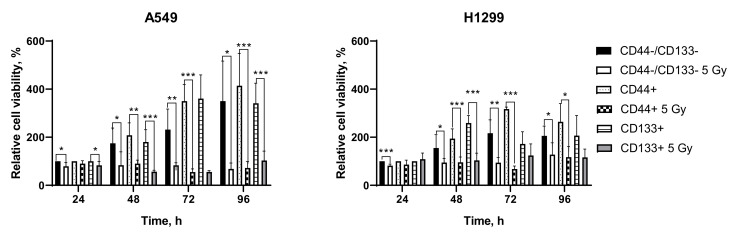
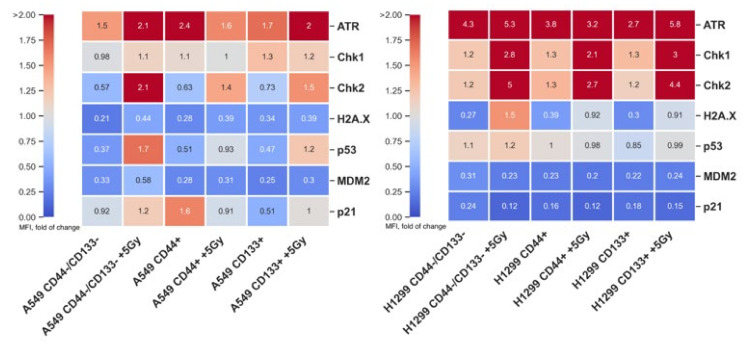
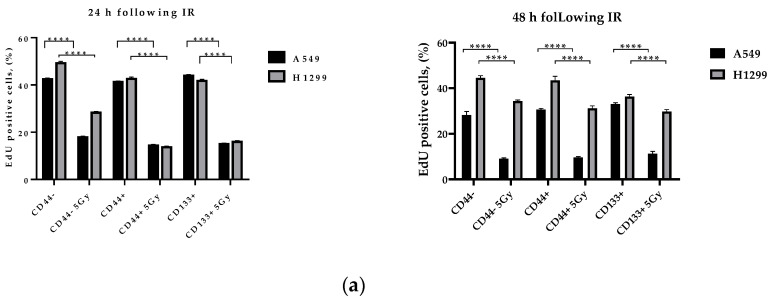
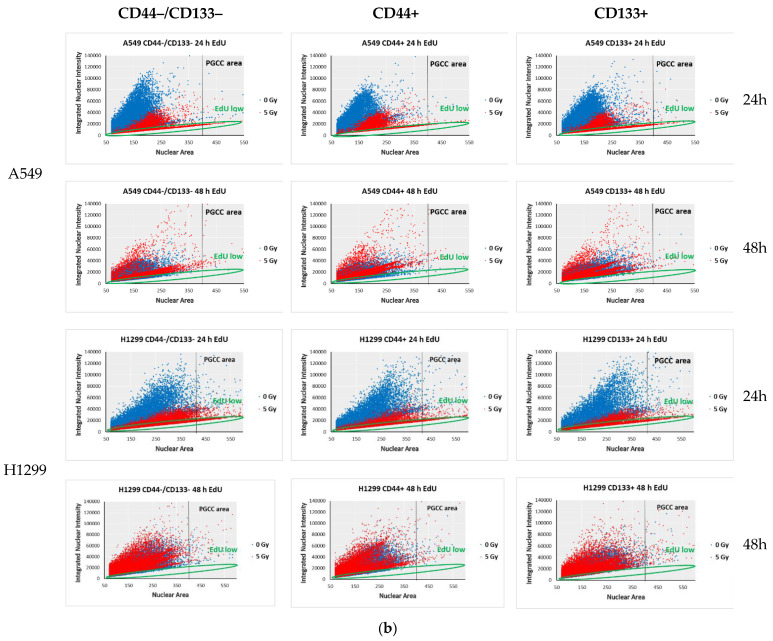
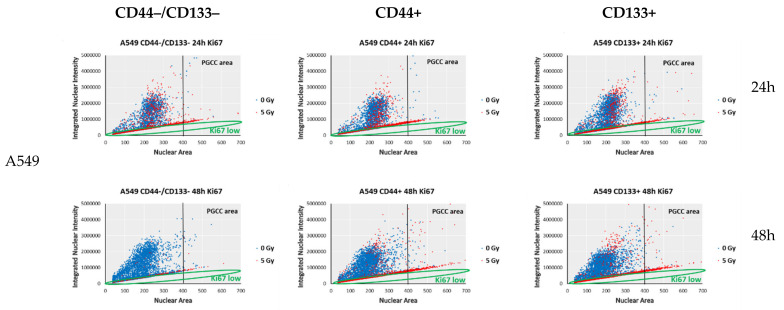
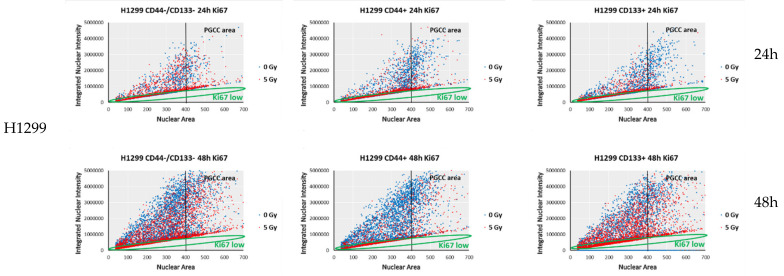
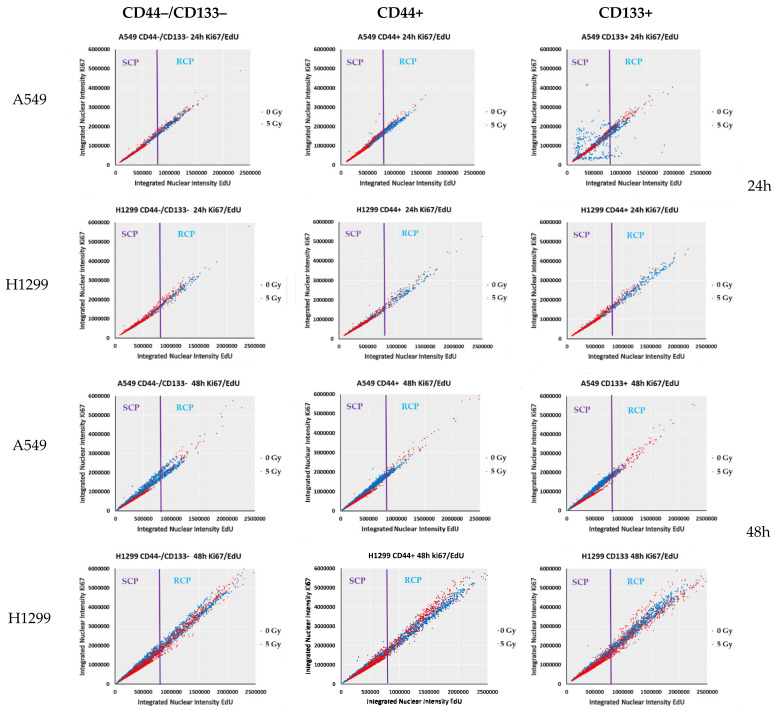
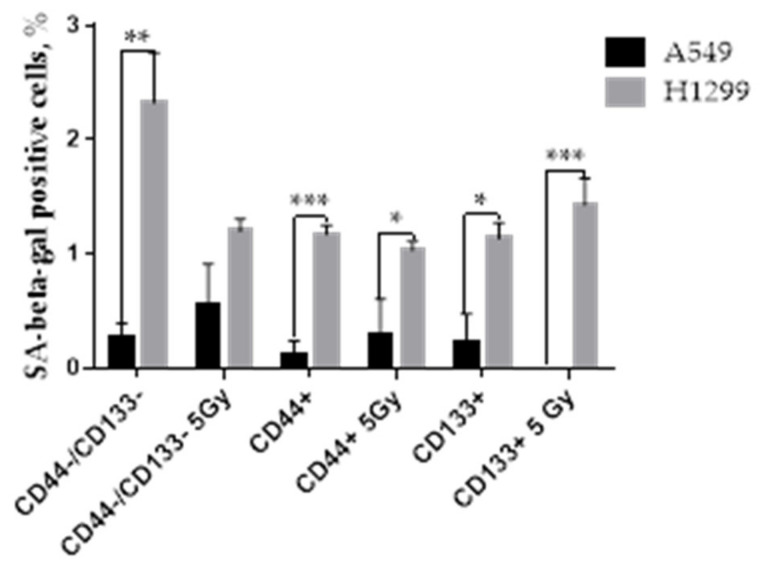
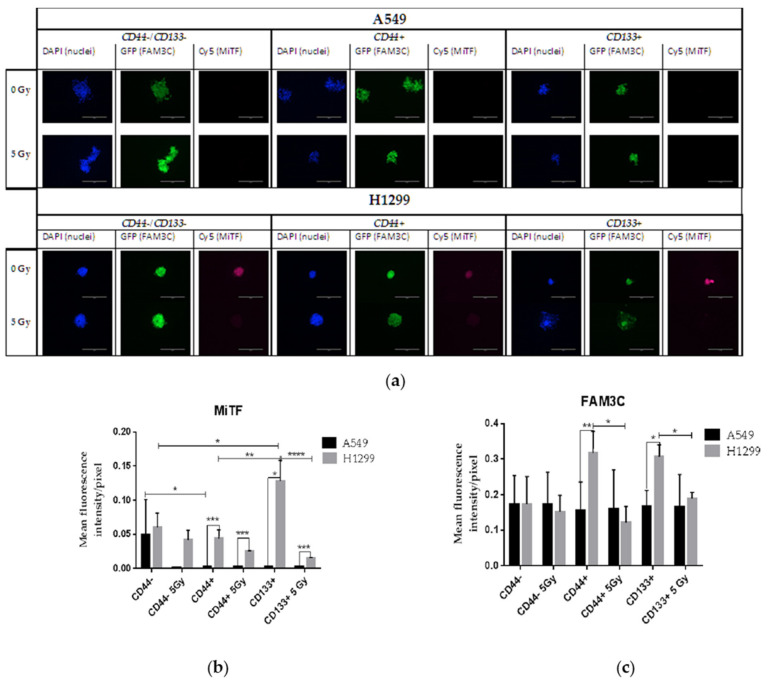
Cancer stem cells (CSCs) play a critical role in the initiation, progression and therapy relapse of many cancers including non-small cell lung cancer (NSCLC). Here, we aimed to address the question of whether the FACS-sorted CSC-like (CD44 + &CD133 +) vs. non-CSC (CD44-/CD133- isogenic subpopulations of p53wt A549 and p53null H1299 cells differ in terms of DNA-damage signaling and the appearance of "dormant" features, including polyploidy, which are early markers (predictors) of their sensitivity to genotoxic stress. X-ray irradiation (IR) at 5 Gy provoked significantly higher levels of the ATR-Chk1/Chk2-pathway activity in CD44-/CD133- and CD133+ subpopulations of H1299 cells compared to the respective subpopulations of A549 cells, which only excited ATR-Chk2 activation as demonstrated by the Multiplex DNA-Damage/Genotoxicity profiling. The CD44+ subpopulations did not demonstrate IR-induced activation of ATR, while significantly augmenting only Chk2 and Chk1/2 in the A549- and H1299-derived cells, respectively. Compared to the A549 cells, all the subpopulations of H1299 cells established an increased IR-induced expression of the γH2AX DNA-repair protein. The CD44-/CD133- and CD133+ subpopulations of the A549 cells revealed IR-induced activation of ATR-p53-p21 cell dormancy signaling-mediated pathway, while none of the CD44+ subpopulations of either cell line possessed any signs of such activity. Our data indicated, for the first time, the transcription factor MITF-FAM3C axis operative in p53-deficient H1299 cells, specifically their CD44+ and CD133+ populations, in response to IR, which warrants further investigation. The p21-mediated quiescence is likely the predominant surviving pathway in CD44-/CD133- and CD133+ populations of A549 cells as indicated by single-cell high-content imaging and analysis of Ki67- and EdU-coupled fluorescence after IR stress. SA-beta-galhistology revealed that cellular-stress-induced premature senescence (SIPS) likely has a significant influence on the temporary dormant state of H1299 cells. For the first time, we demonstrated polyploid giant and/or multinucleated cancer-cell (PGCC/MGCC) fractions mainly featuring the progressively augmenting Ki67low phenotype in CD44+ and CD133+ A549 cells at 24-48 h after IR. In contrast, the Ki67high phenotype enrichment in the same fractions of all the sorted H1299 cells suggested an increase in their cycling/heterochromatin reorganization activity after IR stress. Our results proposed that entering the "quiescence" state rather than p21-mediated SIPS may play a significant role in the survival of p53wt CSC-like NSCLC cells after IR. The results obtained are important for the selection of therapeutic schemes for the treatment of patients with NSCLC, depending on the functioning of the p53 system in tumor cells.
Keywords: FAM3C; MITF; cancer stem cells; non-small cell lung cancer; p21; p53; polyploid giant cancer cells; radioresistance; senescence-associated β-galactosidase; γH2AX.
Conflict of interest statement
The authors declare no conflict of interest.
Figures
Similar articles
-
The CD44high Subpopulation of Multifraction Irradiation-Surviving NSCLC Cells Exhibits Partial EMT-Program Activation and DNA Damage Response Depending on Their p53 Status.Int J Mol Sci. 2021 Feb 27;22(5):2369. doi: 10.3390/ijms22052369. Int J Mol Sci. 2021. PMID: 33673439 Free PMC article.
-
The p53-53BP1-Related Survival of A549 and H1299 Human Lung Cancer Cells after Multifractionated Radiotherapy Demonstrated Different Response to Additional Acute X-ray Exposure.Int J Mol Sci. 2020 May 8;21(9):3342. doi: 10.3390/ijms21093342. Int J Mol Sci. 2020. PMID: 32397297 Free PMC article.
-
Non-small cell lung cancer cells expressing CD44 are enriched for stem cell-like properties.PLoS One. 2010 Nov 19;5(11):e14062. doi: 10.1371/journal.pone.0014062. PLoS One. 2010. PMID: 21124918 Free PMC article.
-
New emerging roles of CD133 in cancer stem cell: Signaling pathway and miRNA regulation.J Cell Physiol. 2019 Dec;234(12):21642-21661. doi: 10.1002/jcp.28824. Epub 2019 May 17. J Cell Physiol. 2019. PMID: 31102292 Review.
-
The Molecular and Cellular Strategies of Glioblastoma and Non-Small-Cell Lung Cancer Cells Conferring Radioresistance.Int J Mol Sci. 2022 Nov 5;23(21):13577. doi: 10.3390/ijms232113577. Int J Mol Sci. 2022. PMID: 36362359 Free PMC article. Review.
Cited by
-
Cisplatin-Resistant CD44+ Lung Cancer Cells Are Sensitive to Auger Electrons.Int J Mol Sci. 2022 Jun 27;23(13):7131. doi: 10.3390/ijms23137131. Int J Mol Sci. 2022. PMID: 35806135 Free PMC article.
-
Molecular mechanism of vimentin nuclear localization associated with the migration and invasion of daughter cells derived from polyploid giant cancer cells.J Transl Med. 2023 Oct 13;21(1):719. doi: 10.1186/s12967-023-04585-7. J Transl Med. 2023. PMID: 37833712 Free PMC article.
-
Loss of TNFRSF21 induces cisplatin sensitivity in lung adenocarcinoma.Oncol Res. 2025 Feb 28;33(3):653-663. doi: 10.32604/or.2024.050182. eCollection 2025. Oncol Res. 2025. PMID: 40109864 Free PMC article.
-
Nanomaterials targeting cancer stem cells to overcome drug resistance and tumor recurrence.Front Oncol. 2025 Jun 6;15:1499283. doi: 10.3389/fonc.2025.1499283. eCollection 2025. Front Oncol. 2025. PMID: 40548119 Free PMC article. Review.
-
Insights into the role of senescence in tumor dormancy: mechanisms and applications.Cancer Metastasis Rev. 2023 Mar;42(1):19-35. doi: 10.1007/s10555-023-10082-6. Epub 2023 Jan 21. Cancer Metastasis Rev. 2023. PMID: 36681750 Review.
References
-
- Upadhyay V.A., Shah K.A., Makwana D.P., Raval A.P., Shah F.D., Rawal R.M. Putative stemness markers octamer-binding transcription factor 4, sex-determining region Y-box 2, and NANOG in non-small cell lung carcinoma: A clinicopathological association. J. Cancer Res. Ther. 2020;16:804–810. doi: 10.4103/jcrt.JCRT_213_18. - DOI - PubMed
-
- Pedregal-Mallo D., Hermida-Prado F., Granda-Diaz R., Montoro-Jimenez I., Allonca E., Pozo-Agundo E., Alvarez-Fernandez M., Alvarez-Marcos C., Garcia-Pedrero J.M., Rodrigo J.P. Prognostic Significance of the Pluripotency Factors NANOG, SOX2, and OCT4 in Head and Neck Squamous Cell Carcinomas. Cancers. 2020;12:1794. doi: 10.3390/cancers12071794. - DOI - PMC - PubMed
MeSH terms
Substances
Grants and funding
LinkOut - more resources
Full Text Sources
Medical
Research Materials
Miscellaneous
