. 2022 Apr 29;23(9):4947.
doi: 10.3390/ijms23094947.

Transduction of Brain Neurons in Juvenile Chum Salmon (Oncorhynchus keta) with Recombinant Adeno-Associated Hippocampal Virus Injected into the Cerebellum during Long-Term Monitoring

Affiliations

Transduction of Brain Neurons in Juvenile Chum Salmon (Oncorhynchus keta) with Recombinant Adeno-Associated Hippocampal Virus Injected into the Cerebellum during Long-Term Monitoring

Evgeniya V Pushchina et al. Int J Mol Sci. .

Abstract

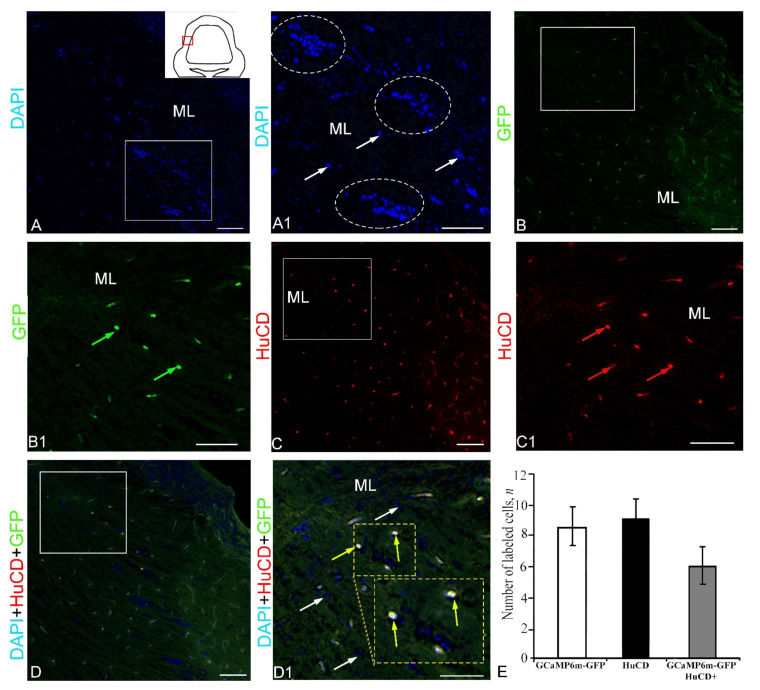
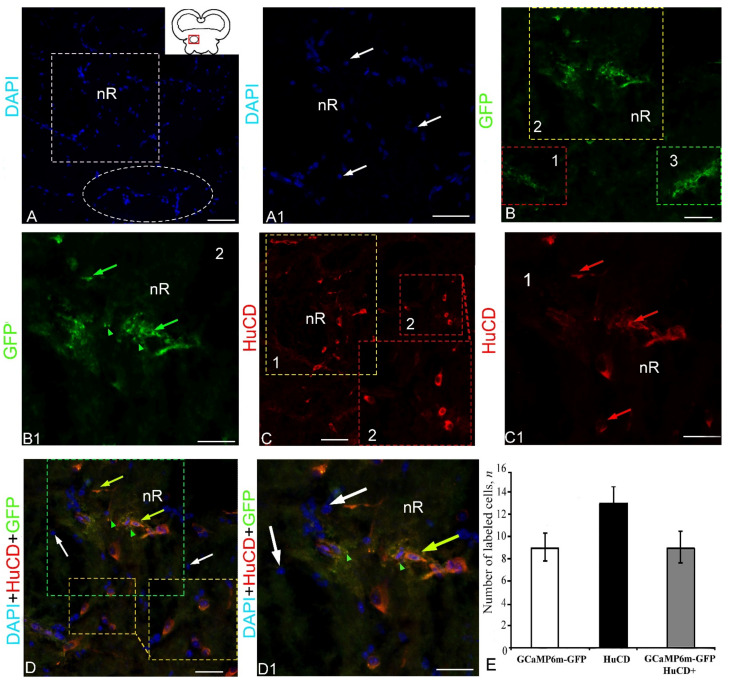
Corpus cerebelli in juvenile chum salmon is a multiprojective region of the brain connected via afferent and efferent projections with the higher regions of the brainstem and synencephalon, as well as with multiprojection regions of the medulla oblongata and spinal cord. During the postembryonic development of the cerebellum in chum salmon, Oncorhynchus keta, the lateral part of the juvenile cerebellum gives rise to the caudomedial part of the definitive cerebellum, which is consistent with the data reported for zebrafish and mouse cerebellum. Thus, the topographic organization of the cerebellum and its efferents are similar between fish (chum salmon and zebrafish) and mammals, including mice and humans. The distributions of recombinant adeno-associated viral vectors (rAAVs) after an injection of the base vector into the cerebellum have shown highly specific patterns of transgene expression in bipolar neurons in the latero-caudal lobe of the juvenile chum tectum opticum. The distribution of rAAVs in the dorsal thalamus, epithalamus, nucleus rotundus, and pretectal complex indicates the targeted distribution of the transgene via the thalamo-cerebellar projections. The detection of GFP expression in the cells of the epiphysis and posterior tubercle of juvenile chum salmon is associated with the transgene's distribution and with the cerebrospinal fluid flow, the brain ventricles and its outer surface. The direct delivery of the rAAV into the central nervous system by intracerebroventricular administration allows it to spread widely in the brain. Thus, the presence of special projection areas in the juvenile chum salmon cerebellum, as well as outside it, and the identification of the transgene's expression in them confirm the potential ability of rAAVs to distribute in both intracerebellar and afferent and efferent extracerebellar projections of the cerebellum.

Keywords: Purkinje cells; cerebellum; cerebrospinal fluid; chum salmon; eurydendroid cells; genetically encoded calcium indicators; green fluorescent protein; intracerebroventricular administration; recombinant adeno-associated viruses; thalamo-cerebellar projections.


Conflict of interest statement

The authors declare no conflict of interest.

Figures

Figure 1
Figure 1
Z-stacks representing DAPI staining, localization of GFP and HuCD, and their co-localization in the cerebellum of juvenile chum salmon, Oncorhynchus keta, at 90 days after a single injection of the rAAV into the cerebellar body. (A) DAPI staining with a pictogram showing the dorso-medial region of the cerebellar body in a red box, dorsal matrix zone (DMZ) in inset, and apical zone (AZ). (A1) A fragment of A3 (outlined by a white square), single rounded DAPI+ nuclei (white arrows), elongated nuclei (pink arrows), and molecular layer (ML). (A2) The enlarged fragment of AZ outlined by a white box in A1 and accumulation of heteromorphic nuclei (inset) with numerous nucleoli (white arrows). (B) Immunolocalization of green fluorescent protein GFP in granules (green arrowheads) and cells (green arrows) in AZ, accumulation of GFP+ granules (inset) in ML. (C) HuCD immunolocalization in AZ neurons (yellow box). (C1) The enlarged fragment outlined by a yellow box in C and bodies of HuCD+ neurons (red arrows). (D) Co-localization of GFP and HuCD in AZ neurons (green box). (D1) The enlarged fragment outlined by a green box in D, DAPI-stained nuclei (white arrows), cytoplasmic colocalization of GFP/HuCD+ neurons (yellow arrows), and GFP+ granules (green arrowheads). Laser scanning confocal microscopy. Scale bar: (A) 100 µm, (A1,B,C,D) 50 µm, and (A2,C1,D1) 50 µm. (E) One-way ANOVA showing the relative distribution of GFP, HuCD, and GFP/HuCD immunolabeled cells of the dorso-medial region of the cerebellum of juvenile O. keta; data are presented as mean ± standard deviation (M ± SD). Significant intergroup differences were found in the group of GCaMP6m-GFP and HuCD+ cells (# <0.05) (n = 5 in each group).
Figure 2
Figure 2
Results of the control immunolabeling experiments for HuCD and GFP in the dorsal part of the cerebellar body in the absence of primary antibodies. (A) GFP; (B) HuCD; (C) DNPI + HuCD + GFP. Dorsal matrix zone (DMZ) is in the white dotted rectangle. ML, molecular layer. Laser scanning confocal microscopy. Scale bar: 100 µm.
Figure 3
Figure 3
Micrographs showing HuCD immunofluorescence in the ganglionic layer of the lateral region of the cerebellum in juvenile chum salmon, O. keta, at 90 days after a single injection of the rAAV into the cerebellar body. (A) DAPI staining with a pictogram showing the lateral region of the cerebellum (in a red box), clusters of DAPI-positive nuclei (outlined by a white box); ML, molecular layer; Grl, granular layer; Grnl, ganglionic layer. (B) Piriform Purkinje cells (PC) (indicated by a white asterisk) and eurydendroid cells (EDC) (indicated by red arrows in a red box). (B1) Intense immunofluorescence of HuCD in PC and EDC; for designations, see (B). (B2) Intensely labeled PCs and EDCs forming clusters of 2–3 (red inset); for designations, see (B). (B3) Isolated clusters of HuCD+ PCs and EDCs containing DAPI-stained nuclei and also proximal segments of ascending HuCD+ PC dendrites; for designations, see (B). (C) Single HuCD+ bipolar EDCs and pear-shaped PCs with proximal HuCD+ dendritic patches; for designations, see (B). Laser scanning confocal microscopy. Scale bar: (A,B) 100 µm; (B1,B2) 50 µm; (B3,C) 20 µm.
Figure 4
Figure 4
Z-stacks showing DAPI staining, localization of green fluorescent protein GFP and HuCD, and their co-localization in the lateral region of the cerebellum in juvenile chum salmon, O. keta, 90 days after a single injection of the rAAV into the cerebellar body. (A) DAPI staining with a pictogram showing the lateral region of the cerebellum (in a red box), clusters of DAPI-positive nuclei (outlined by the white box); ML, molecular layer. (A1) The enlarged fragment outlined by a white box in A; white dotted line outlines reactive neurogenic zones; single DAPI+ nuclei (white arrows). (B) GFP immunolocalization in cells of the lateral zone (in white box). (B1) The enlarged fragment outlined by a white box in B (GFP+ cells are indicated by green arrows). (C) HuCD immunolocalization in the lateral cerebellum (white box). (C1) An enlarged fragment outlined by a white box in C; HuCD+ cells (red arrows). (D) Co-localization of GFP and HuCD in cells of the lateral zone (in white box). (D1) The enlarged fragment in a white box. (D) Cells with co-localization (yellow arrows) are bordered by yellow dotted lines (inset); DAPI+ nuclei (white arrows). Laser scanning confocal microscopy. Scale bar: (A,B,C,D) 100 µm; (A1,B1,C1,D1) 50 µm; (E) One-way ANOVA showing the relative distribution of GFP and HuCD immunolabeled cells (M ± SD) in the lateral region of the cerebellum of juvenile chum salmon, O. keta. No significant intergroup differences in GCaMP6m-GFP and HuCD, GCaMP6m-GFP and GCaMP6m-GFP/HuCD+ were found (n = 5 in each group).
Figure 5
Figure 5
Z-stacks showing DAPI staining, localization of green fluorescent protein GFP and HuCD, and their co-localization in the basal region of the cerebellar body in juvenile chum salmon, O. keta, at 90 days after a single injection of the rAAV into the cerebellar body. (A) DAPI staining with a pictogram showing the basal region of the cerebellum (in a red box) and a cluster of DAPI-stained nuclei (in a white box); ML, molecular layer. (A1) The enlarged fragment outlined by a white rectangle in A; discrete clusters of nuclei and single nuclei (white arrows) are outlined by a white dotted line. (B) Expression of the green fluorescent protein GFP in the basal cerebellum (white box); Grl, granular layer. (B1) Enlarged view outlined by a white box in B; GFP+ cells (green arrows) and GFP+ granules (green arrowheads). (C) Immunofluorescence of HuCD+ neurons in the basal cerebellum (white box); inset (red dotted line) showing enlarged HuCD+ neurons (red dotted inset). (C1) The enlarged fragment outlined by a white box in C; HuCD+ neurons (red arrows). (D) Optical overlay of three channels DAPI, GFP, HuCD showing areas of GFP/HuCD co-localization in neurons (white box). (D1) The enlarged fragment outlined by a white box in D; GFP and HuCD co-localization neurons (yellow arrowheads), DAPI-stained nuclei (white arrowheads), and GFP+ granules (green arrowheads). Laser scanning confocal microscopy. Scale bar: (A,B,C,D) 100 µm; (A1,B1,C1,D1) 50 µm. (E) One-way ANOVA showing the relative distribution of GFP and HuCD immunolabeled cells (M ± SD) in the basal region of the cerebellar body of juvenile chum salmon, O. keta. No significant intergroup differences in GCaMP6m-GFP and HuCD, GCaMP6m-GFP and GCaMP6m-GFP/HuCD+ were found (n = 5 in each group).
Figure 6
Figure 6
Z-stacks showing DAPI staining, localization of green fluorescent protein GFP and HuCD, and their colocalization in the latero-caudal region of the tectum in juvenile chum salmon, O. keta, at 90 days after a single injection of the rAAV into the cerebellar body. (A) DAPI staining with a pictogram showing the latero-caudal region of the tectum in a red box; the white box outlines an accumulation of DAPI-stained nuclei in the tectum; ML, molecular layer. (A1) The enlarged fragment in A; white dotted line outlines a cluster of nuclei; DAPI+ single nuclei (white arrows). (B) Expression of the green fluorescent protein GFP in bipolar neurons (dashed yellow box). (B1) The enlarged fragment outlined by a yellow dotted box in B; GFP+ neurons (green arrows). (C) Immunofluorescence of the HuCD protein in neuronal populations of stratum grizerum centrale (SGC) and stratum grizerum et album periventriculare (SGAP). (C1) The enlarged fragment outlined by a red dotted box in C; HuCD+ neurons (red arrows). (D) Optical overlay of three DAPI, GFP; HuCD channels showing areas of GFP/HuCD co-localization in neurons (dashed yellow box). (D1) The enlarged fragment outlined by yellow dotted box in D; neurons with GFP and HuCD co-localization (yellow arrows), DAPI-stained nuclei (white arrows), HuCD+ neurons (red arrows), and a cluster of nuclei (outlined by white dotted oval). Laser scanning confocal microscopy. Scale bar: (A,B,C,D) 50 µm; (A1,B1,C1,D1) 20 µm. (E) One-way ANOVA showing the relative distribution of GFP and HuCD immunolabeled cells (M ± SD) in the latero-caudal region of the tectum in juvenile chum salmon, O. keta. No significant intergroup differences in GCaMP6m-GFP and HuCD, GCaMP6m-GFP and GCaMP6m-GFP/HuCD+ were found (n = 5 in each group).
Figure 7
Figure 7
Z-stacks showing DAPI staining, localization of green fluorescent protein GFP and HuCD, and their colocalization in the dorsal thalamus of juvenile chum salmon, O. keta, at 90 days after a single injection of the rAAV into the cerebellar body. (A) DAPI staining with a pictogram showing the dorsal thalamic region (in a red box), rounded nuclei (white arrows), elongated nuclei (red arrows); PVZ, periventricular zone; SVZ, subventricular zone; PZ, parenchymal zone. (B) Expression of green fluorescent protein GFP in dorsal thalamic cells (yellow dotted square). (B1) The enlarged fragment outlined by a dotted square in B1; GFP+ neurons (green arrowheads); GFP+ granules (green arrowheads). (C) HuCD immunofluorescence in dorsal neurons (red arrows) of thalamus (red dotted inset). (D) Optical overlay of three DAPI/GFP/HuCD staining channels showing areas of GFP/HuCD colocalization in neurons (yellow dotted box). (D1) The enlarged fragment outlined by a yellow dotted box in D; neurons co-expressing GFP and HuCD (yellow arrows), DAPI-stained nuclei (white arrows), GFP+ neurons (green arrows), and GFP+ granules (green arrowheads). Scanning confocal microscopy. Scale bar: (A,B,C,D) 50 µm; (B1,D1) 20 µm. (E) One-way ANOVA showing the relative distribution of GFP and HuCD immunolabeled cells (M ± SD) in the dorsal thalamus of juvenile chum salmon, O. keta. Significant intergroup differences were found in GCaMP6m-GFP and HuCD, GCaMP6m-GFP and GCaMP6m-GFP/HuCD+ (# <0.05) (n = 5 in each group), and HuCD and GCaMP6m-GFP/HuCD cells (## <0.01) (n = 5 in each group).
Figure 8
Figure 8
Z-stacks showing DAPI staining, localization of green fluorescent protein GFP and HuCD, and their co-localization in the epithalamus of juvenile chum salmon, O. keta, at 90 days after a single injection of the rAAV into the cerebellar body. (A) DAPI staining with a pictogram showing an area of epithalamus (in a red box); white box outlines the subventricular aggregation of DAPI-stained nuclei; PVZ, periventricular zone; SVZ, subventricular zone; PV, periventricular zone. (A1) The enlarged fragment outlined by a white box in A; heteromorphic DAPI-stained nuclei with nucleoli (white arrows). (B) GFP expression in populations of epithalamic neurons (1–5). (B1) The enlarged fragment outlined by a yellow box in B; GFP+ neurons (green arrows) and GFP+ granules (green arrowheads). (C) Immunofluorescence of the HuCD protein in populations of epithalamic neurons; the yellow dotted inset is an enlarged fragment of population 1. (C1) An enlarged fragment of population 2 (green box in C); HuCD+ neurons (red arrows). (D) Optical overlay of three DAPI/GFP/HuCD staining channels showing areas of GFP/HuCD co-localization in neurons (yellow dotted box). (D1) The enlarged fragment outlined by a yellow dotted box in D; neurons co-expressing GFP and HuCD (yellow arrows), DAPI-stained nuclei (white arrows), GFP+ neurons (green arrows), GFP+ granules (green arrowheads), population 1 co-localization areas (green inset), and population 2 (yellow inset). (D1) The enlarged fragment outlined by a white box in D, showing DAPI/GFP/HuCD co-localization in neurons (dashed yellow inset); single cell with colocalization (yellow arrow), DAPI-stained nuclei (white arrows), and GFP+ granules (green arrowheads). Laser scanning confocal microscopy. Scale bar: (A,B,C,D) 100 µm; (A1,B1,C1,D1) 50 µm. (E) Results of the one-way ANOVA showing the comparative distribution of GFP and HuCD immunolabeled cells (M ± SD) in the epithalamus of juvenile chum salmon, O. keta. Significant intergroup differences were found in the GCaMP6m-GFP and HuCD groups, and also in HuCD and GCaMP6m-GFP/HuCD (## <0.01) (n = 5 in each group).
Figure 9
Figure 9
Z-stacks showing DAPI staining, localization of green fluorescent protein GFP and HuCD, and their colocalization in the epiphysis of juvenile chum salmon, O. keta, at 90 days after a single injection of the rAAV into the cerebellar body. (A) DAPI staining with a pictogram showing the area of the epiphysis (in a red box); the dotted white box outlines a cluster of DAPI-stained nuclei. (A1) The enlarged fragment outlined by a white dotted box in A; single DAPI-stained nuclei (white arrows). (B) Expression of the green fluorescent protein GFP in pineal cells (green dotted square). (B1) The enlarged fragment outlined by green dashed square in B; arrows indicate GFP+ neurons; GFP+ granules (green arrowheads). (C) Immunofluorescence of HuCD in pineal cells (in a red dashed square). (C1) The enlarged fragment (in a red dashed square) in C; HuCD+ cells (red arrows). (D) Optical overlay of three DAPI/GFP/HuCD staining channels showing areas of GFP/HuCD co-localization in pineal cells (yellow dotted box). (D1) The enlarged fragment outlined by a yellow dotted box in D; cells co-expressing GFP and HuCD (yellow arrowheads), DAPI-stained nuclei (white arrowheads), HuCD+ cells (red arrowheads), and GFP+/HuCD+ granules (green arrowheads). Laser scanning confocal microscopy. Scale bar: (A,B,C,D) 200 µm; (A1,B1,C1,D1) 50 µm. (E) One-way ANOVA showing the relative distribution of GFP and HuCD immunolabeled cells (M ± SD) in the epiphysis of juvenile chum salmon, O. keta. Significant intergroup differences were found in the GCaMP6m-GFP and GCaMP6m-GFP/HuCD (# <0.05) (n = 5 in each group) and HuCD and GCaMP6m-GFP/HuCD (## <0.01) groups (n = 5 in each group).
Figure 10
Figure 10
Z-stacks showing DAPI staining, localization of GFP and HuCD, and their co-localization in the posterior tubercle of juvenile chum salmon, O. keta, at 90 days after a single injection of the rAAV into the cerebellar body. (A) DAPI staining with a pictogram showing the posterior tuberculum pars posterium (PTp) area in a red box; a dotted white box outlines the accumulation of DAPI-stained posterior tuberculum nuclei; PVZ, periventricular zone; SVZ, subventricular zone; PV, periventricular zone. (A1) The enlarged fragment outlined by a white dotted box in A; stained nuclei (white arrows). (B) Expression of the green fluorescent protein GFP in populations of neurons (1–6) of the posterior tuberculum. Insets 4 and 5 show the enlarged fragments of the corresponding populations. (B1) The enlarged fragments of populations 1, 2 and 3 (insets) in B; GFP+ cells (green arrows) and GFP+ granules (green arrowheads). (C) Immunofluorescence of HuCD in neuronal populations 1 and 2 (red arrows), population 3 (red inset). (C1) The enlarged fragment of population 2 inn C; HuCD+ cells (red arrows). (D) Optical overlay of three DAPI/GFP/HuCD staining channels showing areas of GFP/HuCD co-localization in neurons (dashed yellow square). (D1) The enlarged fragment outlined by a yellow dotted box in D, showing co-localization of GFP and HuCD (yellow arrows in inset), HuCD+ neurons (red arrows), DAPI-stained nuclei (white arrows), and GFP+ neurons (green arrows). Laser scanning confocal microscopy. Scale bar: (A,B,C,D) 100 µm; (A1,B1,C1,D1) 50 µm. (E) One-way ANOVA showing the relative distribution of GFP and HuCD immunolabeled cells (M ± SD) in the posterior tuberculum region of juvenile chum salmon, O. keta. Significant intergroup differences were found in GCaMP6m-GFP and GCaMP6m-GFP/HuCD (# <0.05) (n = 5 in each group) and in HuCD and GCaMP6m-GFP/HuCD (## <0.01) groups (n = 5 in each group).
Figure 11
Figure 11
Z-stacks showing DAPI staining, localization of GFP and HuCD, and their colocalization in the nucleus rotundus of juvenile chum salmon, O. keta, at 90 days after a single injection of the rAAV into the cerebellar body. (A) DAPI staining with a pictogram showing the nucleus rotundus area in a red box; the dotted white square outlines a cluster of DAPI-stained nuclei; the white dotted oval outlines the fragments of DAPI-stained vessels. (A1) The enlarged fragment outlined by a white dotted box in A; DAPI-stained nuclei (white arrows); nR, nucleus rotundus. (B) Expression of GFP in the populations (1–3) of neurons and nucleus rotundus granules. (B1) The enlarged fragment outlined by a yellow dotted box in B; GFP+ neurons (green arrows) and GFP+ granules (green arrowheads). (C) Immunofluorescence of HuCD protein in populations of nucleus rotundus neurons; inset for population 2 with a red dotted line. (C1) The enlarged fragment outlined by a yellow dotted oval in C; HuCD+ neurons (red arrows). (D) Optical overlay of three DAPI/GFP/HuCD staining channels showing areas of GFP/HuCD co-localization in neurons (yellow arrows) and in GFP+ granules, DAPI-stained nuclei (white arrows); enlarged neurons in the population are outlined by yellow dotted lines (inset). (D1) The enlarged fragment outlined by a green dotted oval; for designations, see (D). Laser scanning confocal microscopy. Scale bar: (A,B,C,D) 50 µm; (A1,B1,C1,D1) 20 µm. (E) One-way ANOVA showing the relative distribution of GFP and HuCD immunolabeled cells (M ± SD) in the nucleus rotundus in juvenile chum salmon, O. keta. No significant intergroup differences in GCaMP6m-GFP and HuCD, GCaMP6m-GFP and GCaMP6m-GFP/HuCD+ were found (n = 5 in each group).
Figure 12
Figure 12
Z-stacks showing DAPI staining, localization of green fluorescent protein GFP and HuCD, and their co-localization in the corpus geniculatum of juvenile chum salmon, O. keta, at 90 days after a single injection of the rAAV into the cerebellar ody. (A) DAPI staining with a pictogram showing the geniculate region (in a red box); the white box outlines a cluster of DAPI-stained nuclei; CG, corpus geniculatum. (A1) The enlarged fragment outlined by a white dotted box in A; DAPI-stained heteromorphic nuclei with nucleoli (white arrows). (B) Expression of green fluorescent protein GFP in geniculate cells (in dotted box). (B1) The enlarged fragment outlined by a yellow dotted box in B; GFP+ cells (green arrows) and GFP+ granules (green arrowheads). (C) Immunofluorescence of the HuCD protein in populations (1–3) of geniculate neurons. For population 3, the inset shows an enlarged fragment. (C1) The enlarged fragment outlined by a yellow box in C; HuCD+ neurons (red arrows). (D) Optical overlay of three DAPI/GFP/HuCD staining channels showing areas of GFP/HuCD co-localization in neurons (green dotted box). (D1) The enlarged fragment outlined by a green dotted box in D; cells co-expressing GFP and HuCD (yellow arrowheads), DAPI-stained nuclei with nucleoli (white arrowheads), and GFP+ granules (green arrowheads). Scale bar: (A,B,C,D) 50 µm; (A1,B1,C1,D1) 20 µm. (E) Results of one-way ANOVA showing the relative distribution of GFP and HuCD immunolabeled cells (M ± SD) in the corpus geniculatum region of juvenile chum salmon, O. keta. Significant intergroup differences were found in the GCaMP6m-GFP and HuCD groups and also in HuCD and GCaMP6m-GFP/HuCD (# <0.05) (n = 5 in each group).

Similar articles

Cited by

References

    1. Lewis T.B., Glasgow J.N., Glandon A.M., Curiel D.T., Standaert D.G. Transduction of brain dopamine neurons by adenoviral vectors is modulated by CAR expression: Rationale for tropism modified vectors in PD gene therapy. PLoS ONE. 2010;5:e12672. doi: 10.1371/journal.pone.0012672. - DOI - PMC - PubMed
    1. Jan A., Richner M., Vægter C.B., Nyengaard J.R., Jensen P.H. Gene transfer in rodent nervous tissue following hindlimb intramuscular delivery of recombinant adeno-associated virus serotypes AAV2/6, AAV2/8, and AAV2/9. Neurosci. Insights. 2019;14:1179069519889022. doi: 10.1177/1179069519889022. - DOI - PMC - PubMed
    1. Gray S.J., Woodard K.T., Samulski R.J. Viral vectors and delivery strategies for CNS gene therapy. Ther. Deliv. 2010;1:517–534. doi: 10.4155/tde.10.50. - DOI - PMC - PubMed
    1. Ugolini G. Transneuronal transfer of herpes-simplex virus type-1 (HSV-1) from mixed limb nerves to the CNS. 1. Sequence of transfer from sensory, motor, and sympathetic-nerve fibers to the spinal-cord. J. Comp. Neurol. 1992;326:527–548. doi: 10.1002/cne.903260404. - DOI - PubMed
    1. Ohka S., Yang W.X., Terada E., Iwasaki K., Nomoto A. Retrograde transport of intact poliovirus through the axon via the fast transport system. Virology. 1998;250:67–75. doi: 10.1006/viro.1998.9360. - DOI - PubMed

LinkOut - more resources