

Revealing the Immune Heterogeneity between Systemic Lupus Erythematosus and Rheumatoid Arthritis Based on Multi-Omics Data Analysis
- PMID: 35563556
- PMCID: PMC9101622
- DOI: 10.3390/ijms23095166
Revealing the Immune Heterogeneity between Systemic Lupus Erythematosus and Rheumatoid Arthritis Based on Multi-Omics Data Analysis
Abstract
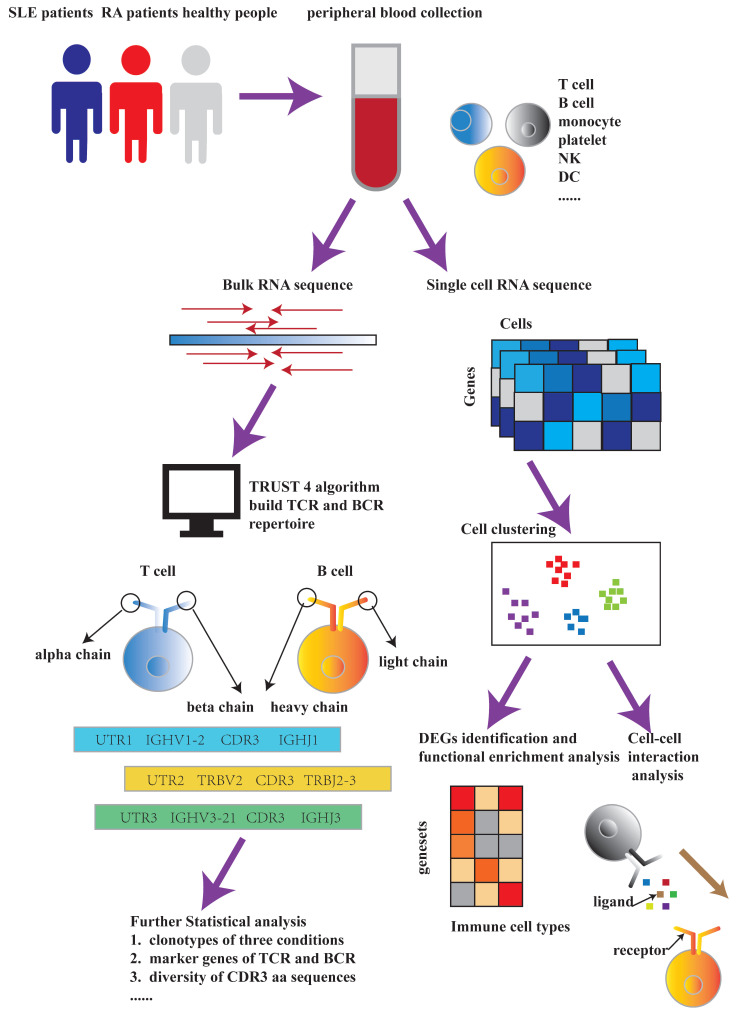
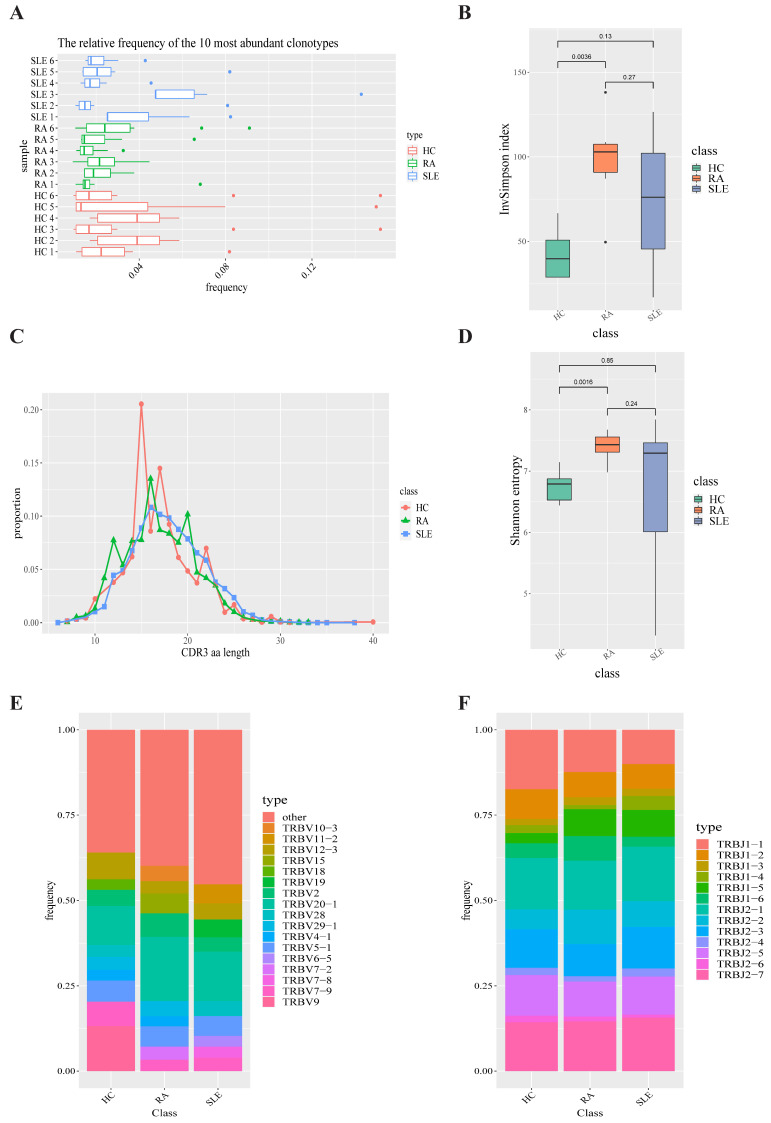
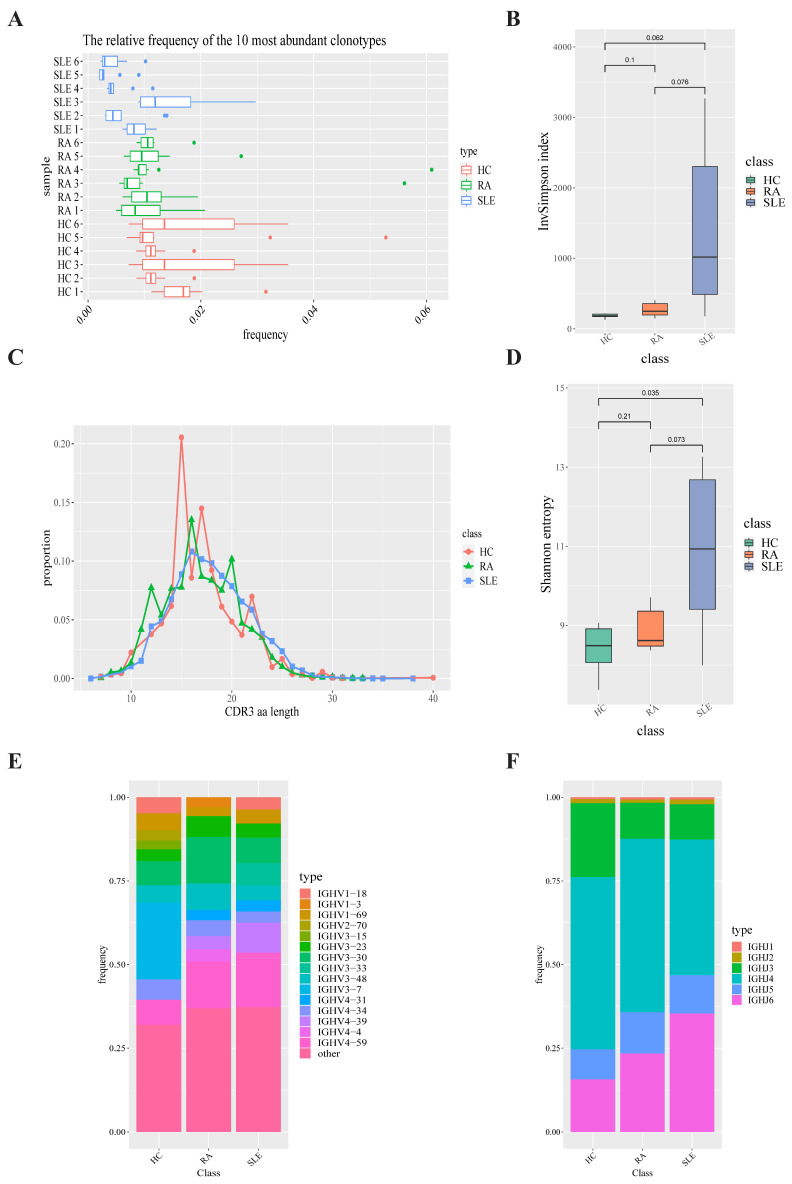
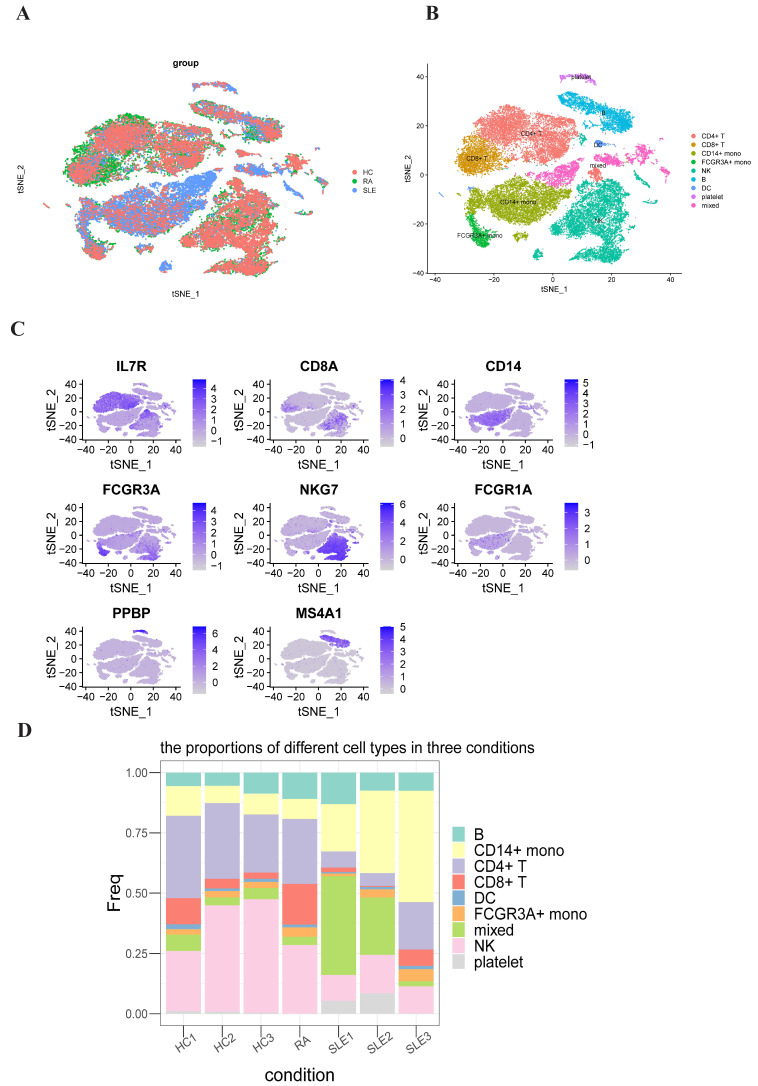
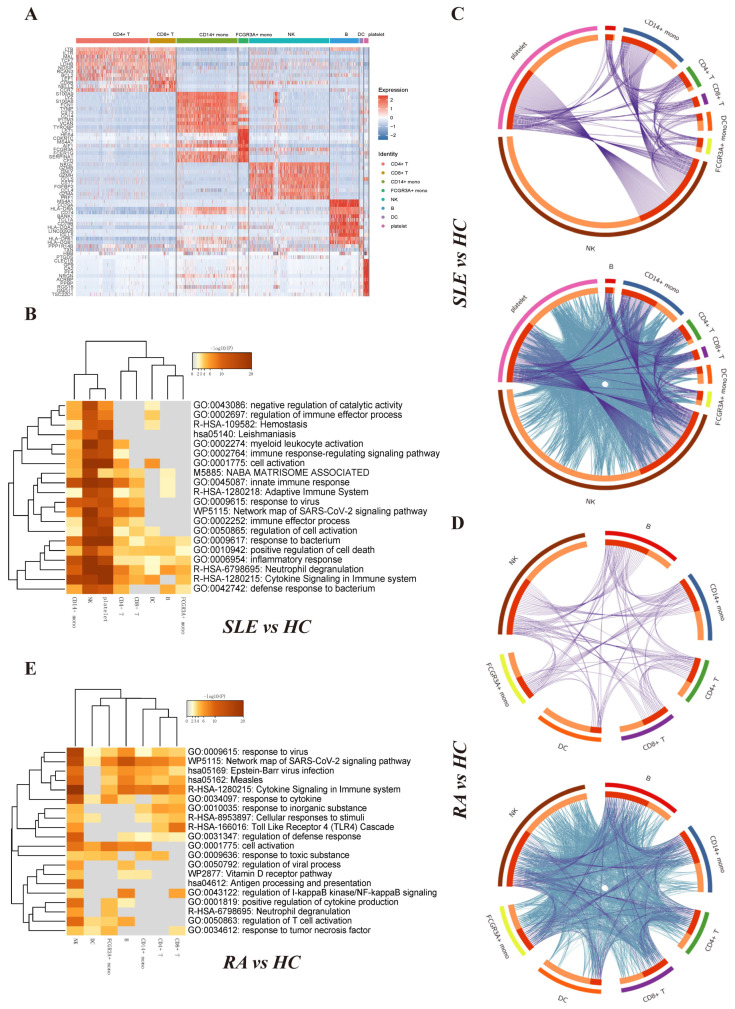
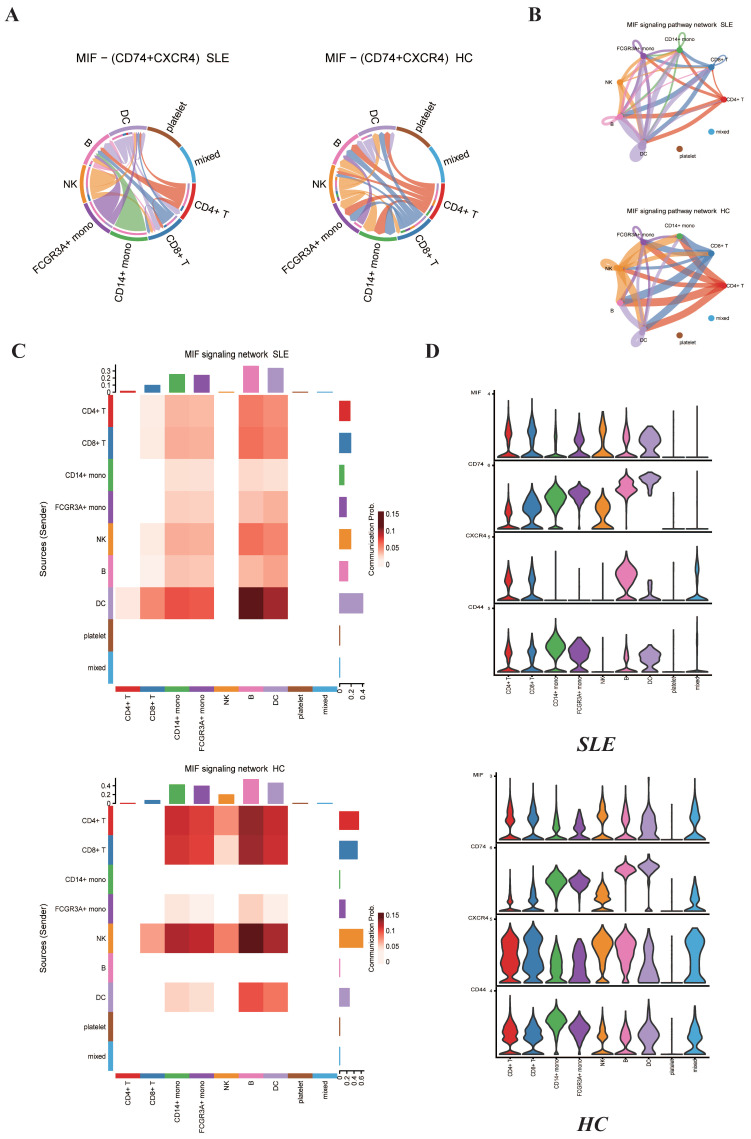
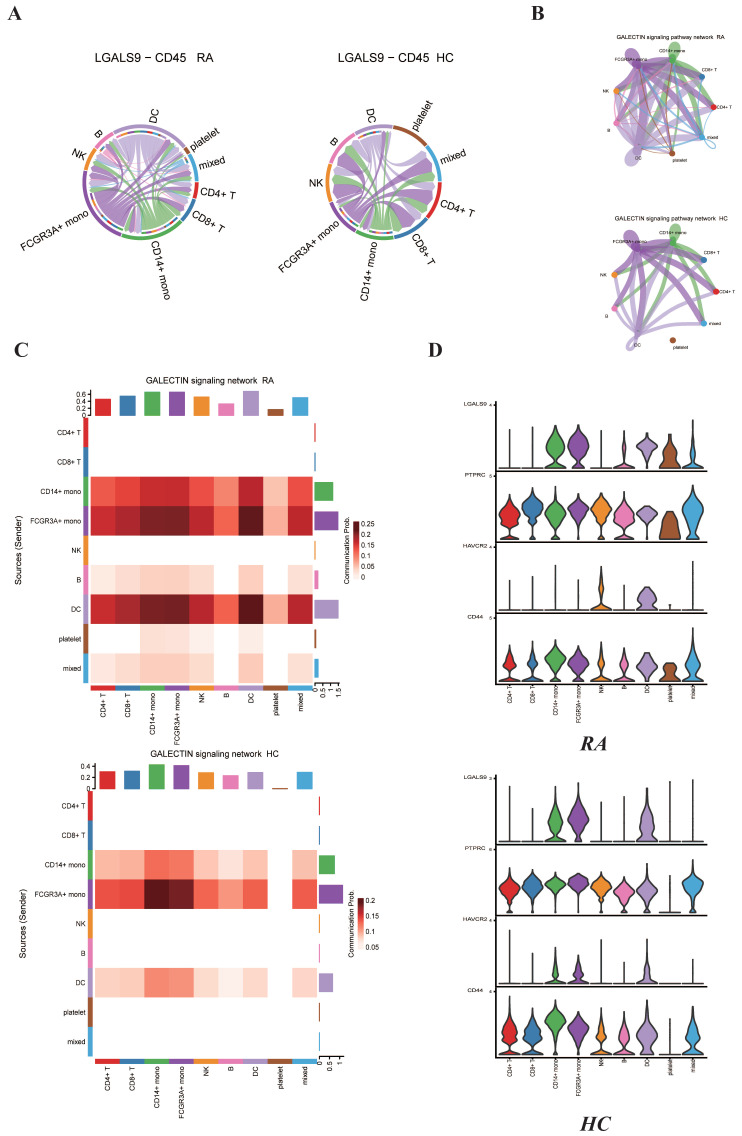
The pathogenesis of systemic lupus erythematosus (SLE) and rheumatoid arthritis (RA) are greatly influenced by different immune cells. Nowadays both T-cell receptor (TCR) and B-cell receptor (BCR) sequencing technology have emerged with the maturity of NGS technology. However, both SLE and RA peripheral blood TCR or BCR repertoire sequencing remains lacking because repertoire sequencing is an expensive assay and consumes valuable tissue samples. This study used computational methods TRUST4 to construct TCR repertoire and BCR repertoire from bulk RNA-seq data of both SLE and RA patients' peripheral blood and analyzed the clonality and diversity of the immune repertoire between the two diseases. Although the functions of immune cells have been studied, the mechanism is still complicated. Differentially expressed genes in each immune cell type and cell-cell interactions between immune cell clusters have not been covered. In this work, we clustered eight immune cell subsets from original scRNA-seq data and disentangled the characteristic alterations of cell subset proportion under both SLE and RA conditions. The cell-cell communication analysis tool CellChat was also utilized to analyze the influence of MIF family and GALECTIN family cytokines, which were reported to regulate SLE and RA, respectively. Our findings correspond to previous findings that MIF increases in the serum of SLE patients. This work proved that the presence of LGALS9, PTPRC and CD44 in platelets could serve as a clinical indicator of rheumatoid arthritis. Our findings comprehensively illustrate dynamic alterations in immune cells during pathogenesis of SLE and RA. This work identified specific V genes and J genes in TCR and BCR that could be used to expand our understanding of SLE and RA. These findings provide a new insight inti the diagnosis and treatment of the two autoimmune diseases.
Keywords: cell–cell interaction; immune repertoire; rheumatoid arthritis; single-cell RNA sequencing technology; systemic lupus erythematosus.
Conflict of interest statement
The authors declare no conflict of interest.
Figures
Similar articles
-
T cell receptor β repertoires as novel diagnostic markers for systemic lupus erythematosus and rheumatoid arthritis.Ann Rheum Dis. 2019 Aug;78(8):1070-1078. doi: 10.1136/annrheumdis-2019-215442. Epub 2019 May 17. Ann Rheum Dis. 2019. PMID: 31101603
-
Immune cell and TCR/BCR repertoire profiling in systemic lupus erythematosus patients by single-cell sequencing.Aging (Albany NY). 2021 Nov 12;13(21):24432-24448. doi: 10.18632/aging.203695. Epub 2021 Nov 12. Aging (Albany NY). 2021. PMID: 34772824 Free PMC article.
-
Characterisation of T and B cell receptor repertoire in patients with systemic lupus erythematosus.Clin Exp Rheumatol. 2023 Nov;41(11):2216-2223. doi: 10.55563/clinexprheumatol/1rjr4s. Epub 2023 May 15. Clin Exp Rheumatol. 2023. PMID: 37199164
-
B-Cell Receptor Repertoire: Recent Advances in Autoimmune Diseases.Clin Rev Allergy Immunol. 2024 Feb;66(1):76-98. doi: 10.1007/s12016-024-08984-6. Epub 2024 Mar 9. Clin Rev Allergy Immunol. 2024. PMID: 38459209 Review.
-
B cell receptor repertoire abnormalities in autoimmune disease.Front Immunol. 2024 Jan 31;15:1326823. doi: 10.3389/fimmu.2024.1326823. eCollection 2024. Front Immunol. 2024. PMID: 38361948 Free PMC article. Review.
Cited by
-
Immune Repertoires in Various Dermatologic and Autoimmune Diseases.Genes (Basel). 2024 Dec 11;15(12):1591. doi: 10.3390/genes15121591. Genes (Basel). 2024. PMID: 39766858 Free PMC article. Review.
-
Integrating transcriptomics, eQTL, and Mendelian randomization to dissect monocyte roles in severe COVID-19 and gout flare.Front Genet. 2024 Sep 25;15:1385316. doi: 10.3389/fgene.2024.1385316. eCollection 2024. Front Genet. 2024. PMID: 39385934 Free PMC article.
-
Inhibition of IL-17 signaling in macrophages underlies the anti-arthritic effects of halofuginone hydrobromide: Network pharmacology, molecular docking, and experimental validation.BMC Complement Med Ther. 2024 Feb 27;24(1):105. doi: 10.1186/s12906-024-04397-2. BMC Complement Med Ther. 2024. PMID: 38413973 Free PMC article.
-
Causal association between systemic lupus erythematosus and the risk of dementia: A Mendelian randomization study.Front Immunol. 2022 Dec 8;13:1063110. doi: 10.3389/fimmu.2022.1063110. eCollection 2022. Front Immunol. 2022. PMID: 36569847 Free PMC article.
-
A Peripheral Blood Signature of Increased Th1 and Myeloid Cells Combined with Serum Inflammatory Mediators Is Associated with Response to Abatacept in Rheumatoid Arthritis Patients.Cells. 2023 Dec 9;12(24):2808. doi: 10.3390/cells12242808. Cells. 2023. PMID: 38132128 Free PMC article.
References
MeSH terms
Substances
Grants and funding
LinkOut - more resources
Full Text Sources
Medical
Research Materials
Miscellaneous
