. 2022 May 5;23(9):5173.
doi: 10.3390/ijms23095173.

Continuous Ingestion of Lacticaseibacillus rhamnosus JB-1 during Chronic Stress Ensures Neurometabolic and Behavioural Stability in Rats

Affiliations

Continuous Ingestion of Lacticaseibacillus rhamnosus JB-1 during Chronic Stress Ensures Neurometabolic and Behavioural Stability in Rats

Agata Chudzik et al. Int J Mol Sci. .

Abstract

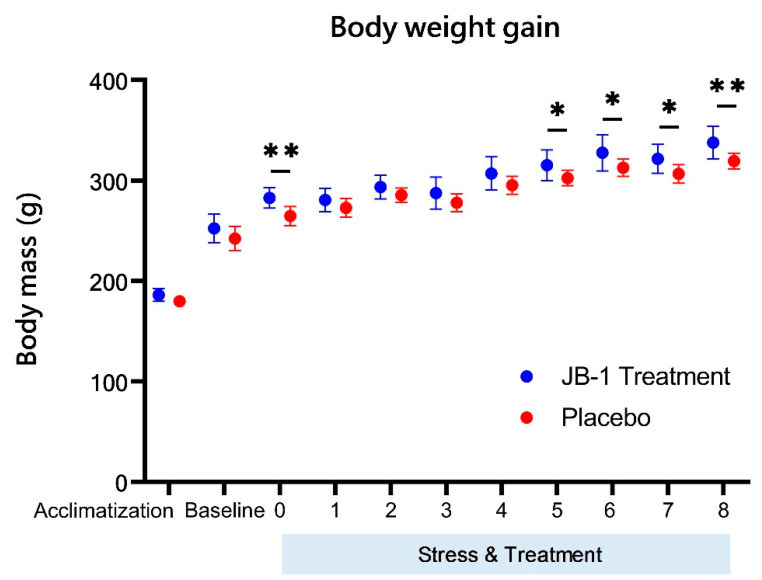
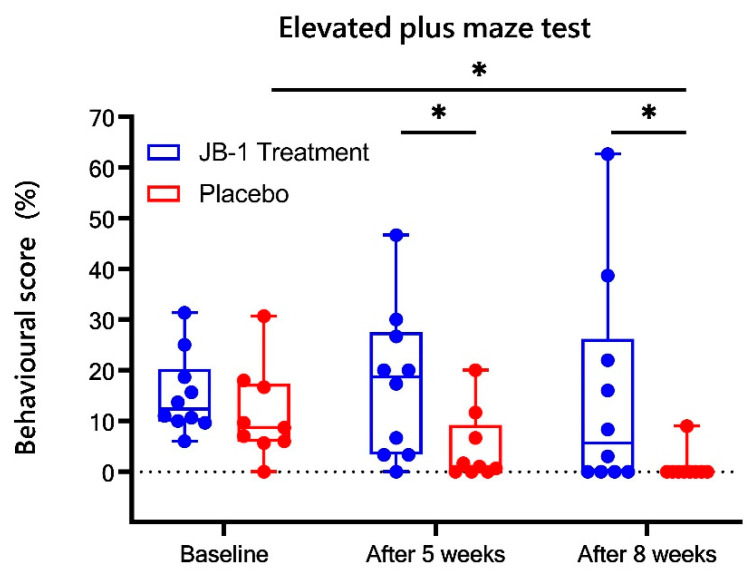
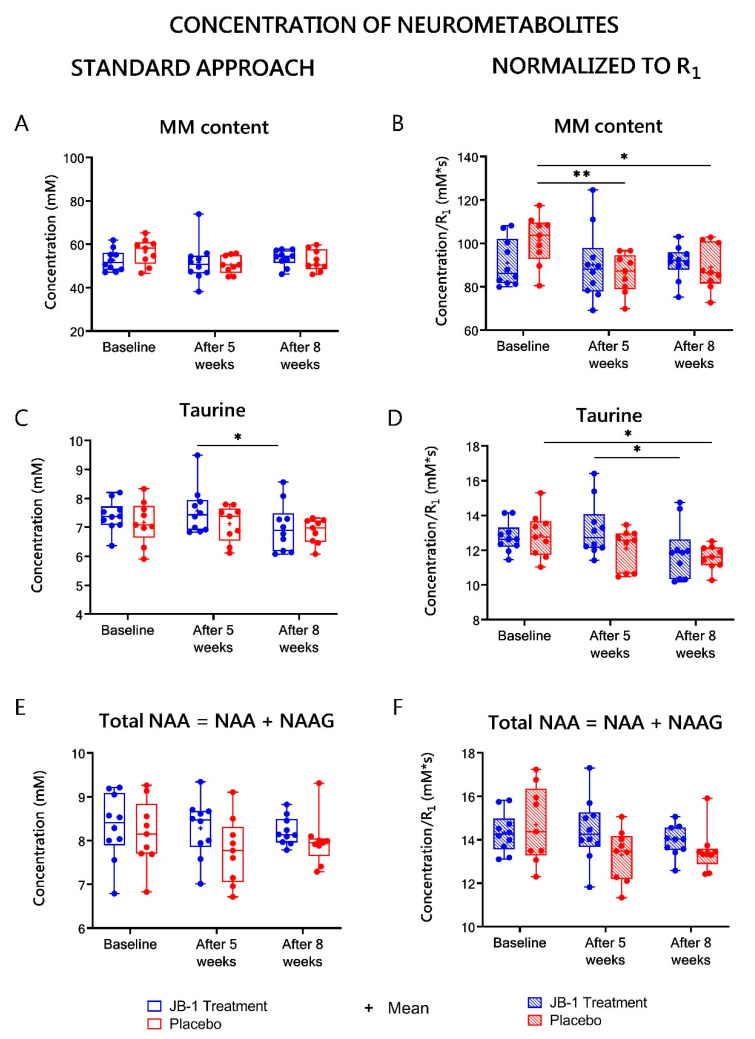
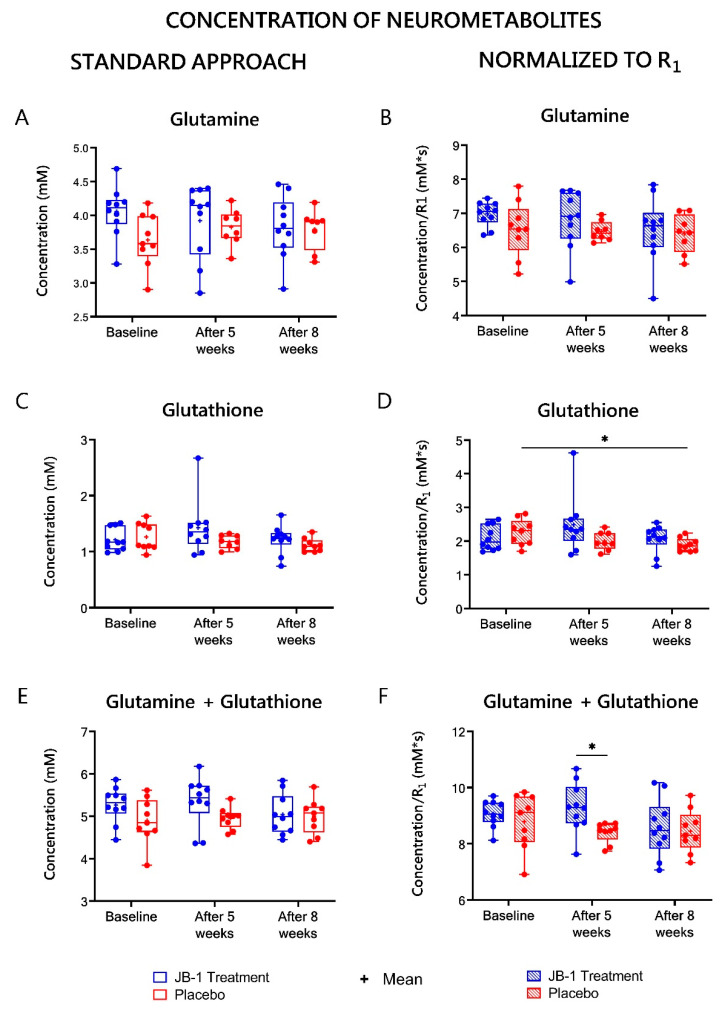
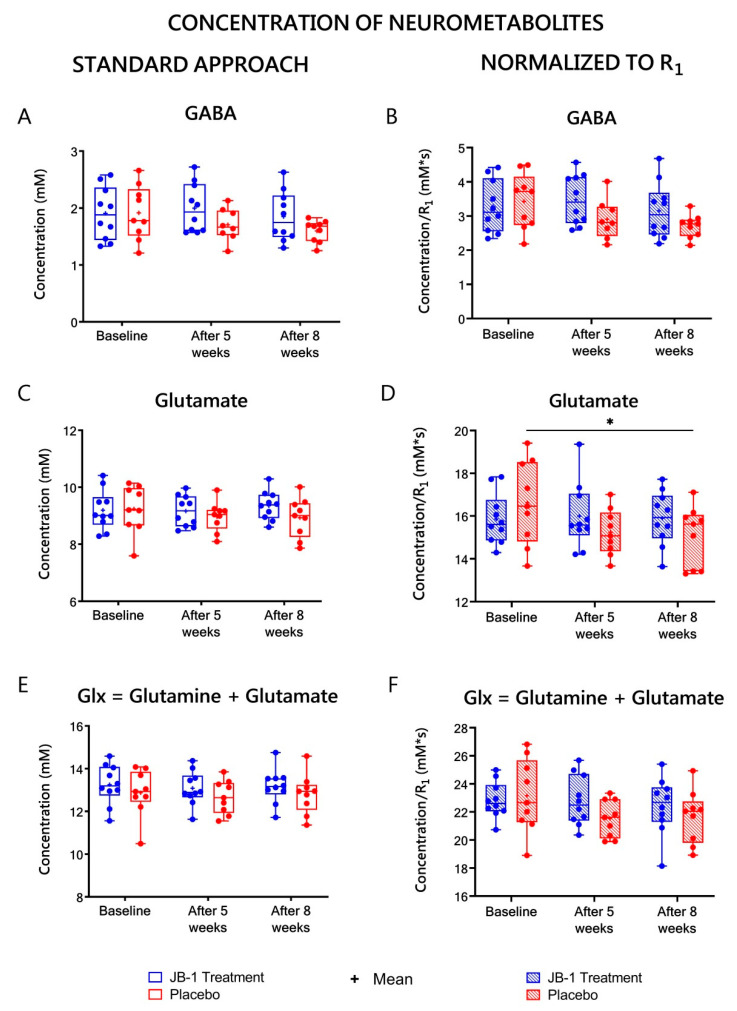
The intestinal microbiome composition and dietary supplementation with psychobiotics can result in neurochemical alterations in the brain, which are possible due to the presence of the brain-gut-microbiome axis. In the present study, magnetic resonance spectroscopy (MRS) and behavioural testing were used to evaluate whether treatment with Lacticaseibacillus rhamnosus JB-1 (JB‑1) bacteria alters brain metabolites' levels and behaviour during continuous exposure to chronic stress. Twenty Wistar rats were subjected to eight weeks of a chronic unpredictable mild stress protocol. Simultaneously, half of them were fed with JB-1 bacteria, and the second half was given a daily placebo. Animals were examined at three-time points: before starting the stress protocol and after five and eight weeks of stress onset. In the elevated plus maze behavioural test the placebo group displayed increased anxiety expressed by almost complete avoidance of exploration, while the JB-1 dietary supplementation mitigated anxiety which resulted in a longer exploration time. Hippocampal MRS measurements demonstrated a significant decrease in glutamine + glutathione concentration in the placebo group compared to the JB-1 bacteria-supplemented group after five weeks of stress. With the progression of stress the decrease of glutamate, glutathione, taurine, and macromolecular concentrations were observed in the placebo group as compared to baseline. The level of brain metabolites in the JB-1-supplemented rats were stable throughout the experiment, with only the taurine level decreasing between weeks five and eight of stress. These data indicated that the JB-1 bacteria diet might stabilize levels of stress-related neurometabolites in rat brain and could prevent the development of anxiety/depressive-like behaviour.

Keywords: Lacticaseibacillus rhamnosus JB-1; brain–gut–microbiome axis; chronic unpredictable mild stress; depression; magnetic resonance spectroscopy.


Conflict of interest statement

The authors declare that they have no conflict of interest. The funders had no role in the design of the study; in the collection, analyses, or interpretation of data; in the writing of the manuscript, or in the decision to publish the results.

Figures

Figure 1
Figure 1
Rats body weight measured at the start of acclimatization, at baseline (before first MRI + MRS scanning), at week 0 (the start point of stress and feeding, after one week of MRI + MRS scanning) and every week during the stress protocol and the administration of JB-1 (N = 10) or placebo (N = 9). Data are represented as means ± SD. * p < 0.05; ** p < 0.01, two-way ANOVA analysis for repeated measures with post-hoc Duncan’s test.
Figure 2
Figure 2
A ratio of time spent in the open arms of the maze (%) as a quantitative measure of behavioural score in the Elevated Plus Maze (EPM) behavioural test results in JB-1 treatment (N = 10) and placebo (N = 9) groups at baseline and after five and eight weeks of the stress protocol. Data are presented as median ± min/max. * p < 0.05, two-way ANOVA analysis for repeated measures with post-hoc Duncan’s test.
Figure 3
Figure 3
Longitudinal relaxation rate R1 in JB-1 (N = 10) treatment and placebo (N = 9) groups at baseline and after five and eight weeks stress protocol. Data are presented as median ± min/max. * p < 0.05, one-way Friedman’s ANOVA (χ2 statistic) analysis for determination of time effect.
Figure 4
Figure 4
Correlations between neurometabolites quantified in vivo by MRS.
Figure 5
Figure 5
Hippocampal MM content (A), taurine (C), tNAA (E) levels calculated using typical water referencing (standard approach)—left column. Hippocampal MM content (B), taurine (D), tNAA (F) levels normalized to R1—right column. Neurometabolites’ concentrations were assessed by MRS in JB-1 treatment and placebo groups at baseline and after five and eight weeks stress protocol. Data are presented as median ± min/max. * p < 0.05; ** p < 0.01, two-way ANOVA analysis for repeated measures with post-hoc Duncan’s test.
Figure 6
Figure 6
Hippocampal glutamine (A), glutathione (C), and glutamine + glutathione (E) levels calculated using typical water referencing (standard approach)—left column. Hippocampal glutamine (B), glutathione (D), and glutamine + glutathione (F) levels normalized to R1—right column. Neurometabolites’ concentrations were assessed by MRS in JB-1 treatment and placebo groups at baseline and after five and eight weeks stress protocol. Data are presented as median ± min/max. * p < 0.05; two-way ANOVA analysis for repeated measures with a post-hoc Duncan’s test.
Figure 7
Figure 7
Hippocampal GABA (A), glutamate (C), and Glx (E) levels calculated using typical water referencing (standard approach) are shown in the left column. Hippocampal GABA (B), glutamate (D), and Glx (F) levels normalized to R1—are shown in the right column. Neurometabolites’ concentrations were assessed by MRS in the JB-1 treatment and placebo groups at baseline and after five and eight weeks stress protocol. Data are presented as median ± min/max. * p < 0.05; two-way ANOVA analysis for repeated measures with post-hoc Duncan’s test.

Similar articles

Cited by

References

    1. Forsythe P., Sudo N., Dinan T., Taylor V.H., Bienenstock J. Mood and Gut Feelings. Brain Behav. Immun. 2010;24:9–16. doi: 10.1016/j.bbi.2009.05.058. - DOI - PubMed
    1. Bravo J.A., Julio-Pieper M., Forsythe P., Kunze W., Dinan T.G., Bienenstock J., Cryan J.F. Communication between Gastrointestinal Bacteria and the Nervous System. Curr. Opin. Pharmacol. 2012;12:667–672. doi: 10.1016/j.coph.2012.09.010. - DOI - PubMed
    1. Mittal R., Debs L.H., Patel A.P., Nguyen D., Patel K., O’Connor G., Grati M., Mittal J., Yan D., Eshraghi A.A., et al. Neurotransmitters: The Critical Modulators Regulating Gut-Brain Axis: Role of Serotonin and Catecholamines in Gut/Brain Axis. J. Cell. Physiol. 2017;232:2359–2372. doi: 10.1002/jcp.25518. - DOI - PMC - PubMed
    1. Winter G., Hart R.A., Charlesworth R.P.G., Sharpley C.F. Gut Microbiome and Depression: What We Know and What We Need to Know. Rev. Neurosci. 2018;29:629–643. doi: 10.1515/revneuro-2017-0072. - DOI - PubMed
    1. Foster J.A., McVey Neufeld K.-A. Gut–Brain Axis: How the Microbiome Influences Anxiety and Depression. Trends Neurosci. 2013;36:305–312. doi: 10.1016/j.tins.2013.01.005. - DOI - PubMed

LinkOut - more resources