. 2022 May 5;23(9):5175.
doi: 10.3390/ijms23095175.

Tissue Transglutaminase Knock-Out Preadipocytes and Beige Cells of Epididymal Fat Origin Possess Decreased Mitochondrial Functions Required for Thermogenesis

Affiliations

Tissue Transglutaminase Knock-Out Preadipocytes and Beige Cells of Epididymal Fat Origin Possess Decreased Mitochondrial Functions Required for Thermogenesis

Kinga Lénárt et al. Int J Mol Sci. .

Abstract

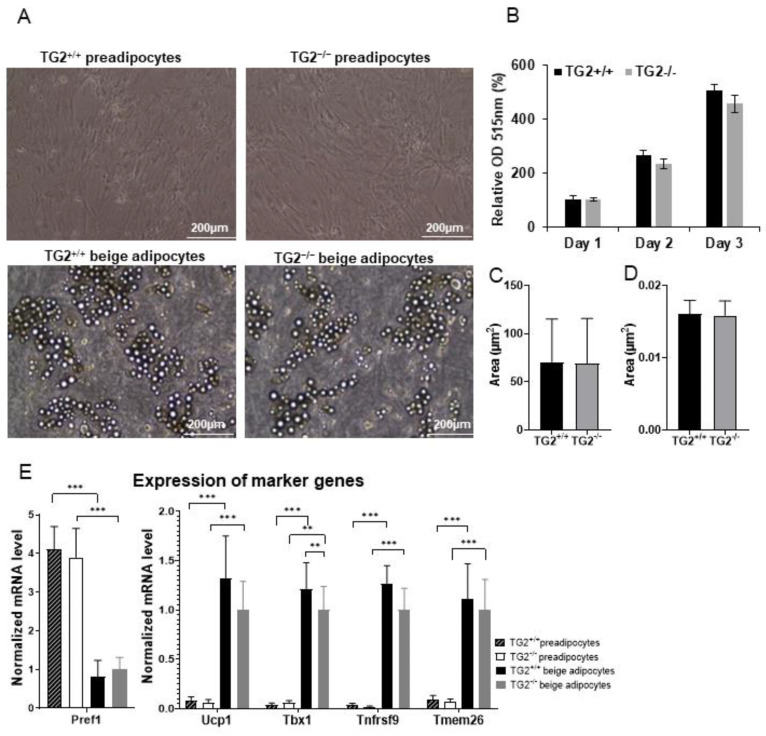
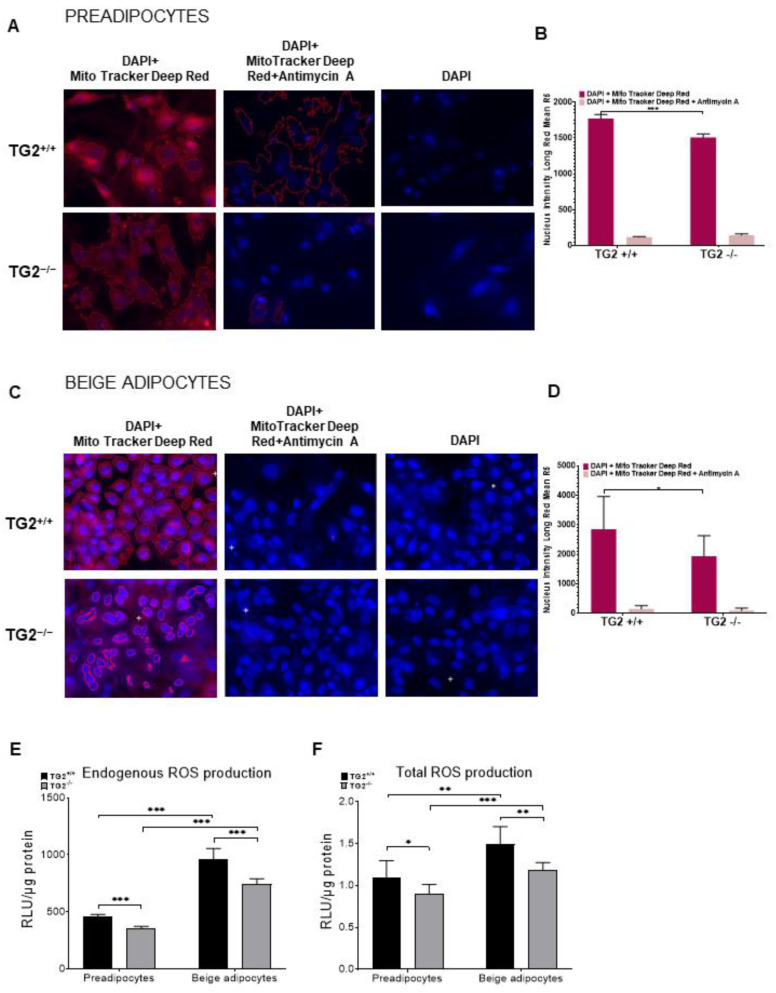
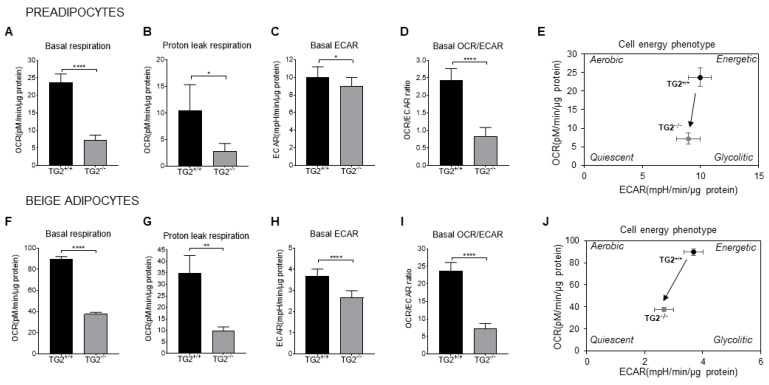
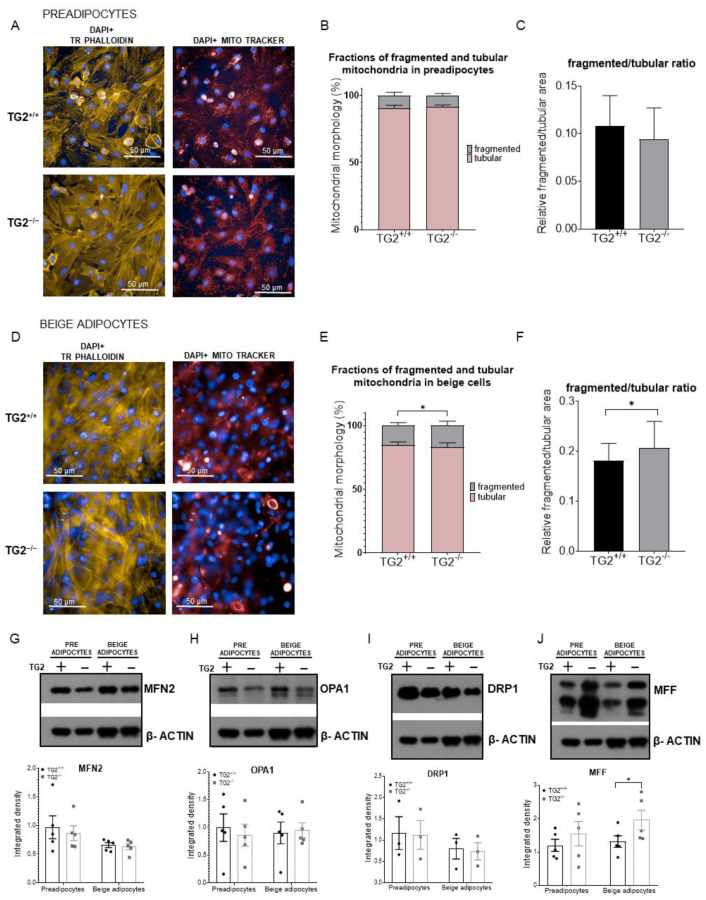
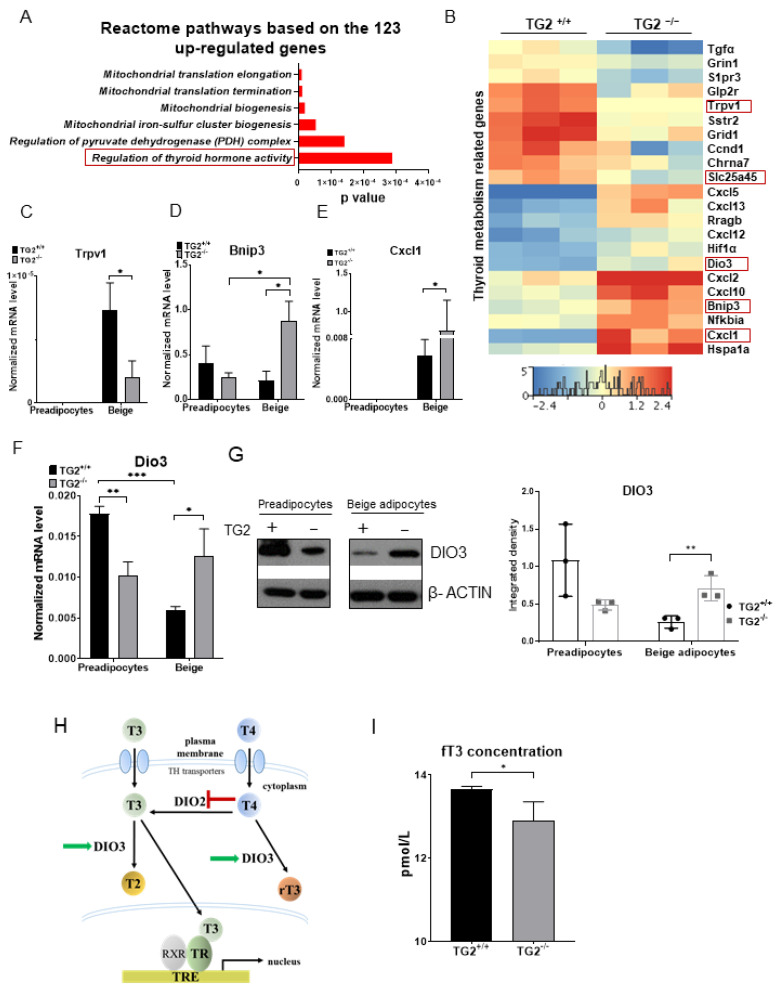
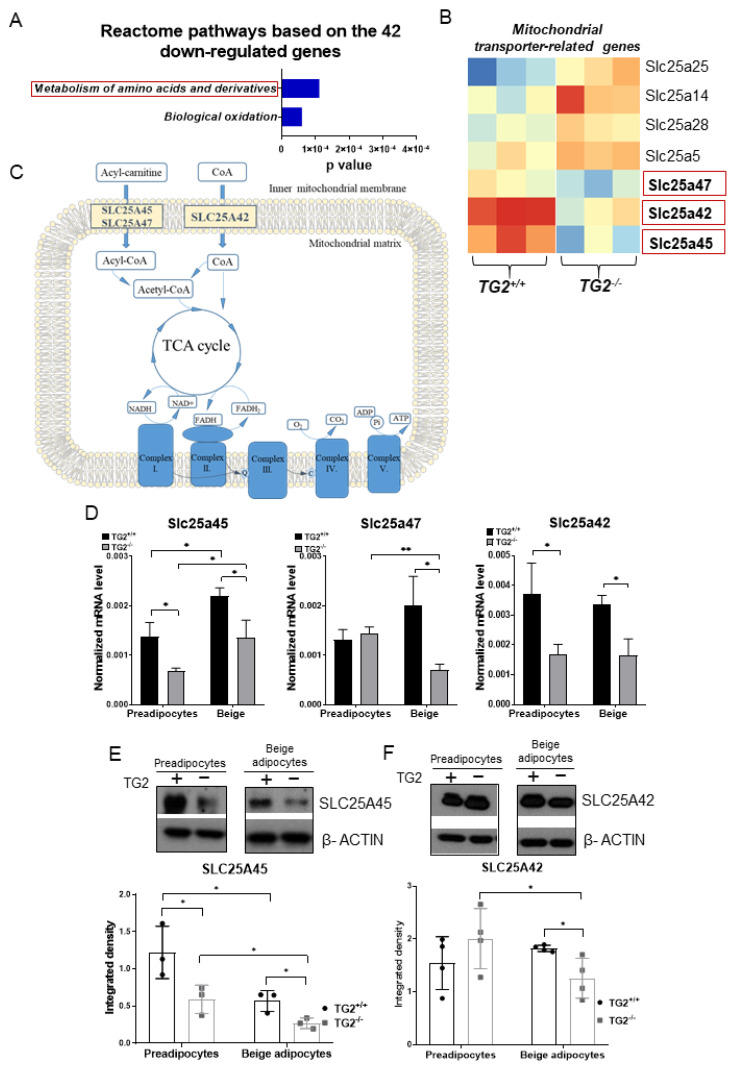
Beige adipocytes with thermogenic function are activated during cold exposure in white adipose tissue through the process of browning. These cells, similar to brown adipocytes, dissipate stored chemical energy in the form of heat with the help of uncoupling protein 1 (UCP1). Recently, we have shown that tissue transglutaminase (TG2) knock-out mice have decreased cold tolerance in parallel with lower utilization of their epididymal adipose tissue and reduced browning. To learn more about the thermogenic function of this fat depot, we isolated preadipocytes from the epididymal adipose tissue of wild-type and TG2 knock-out mice and differentiated them in the beige direction. Although differentiation of TG2 knock-out preadipocytes is phenotypically similar to the wild-type cells, the mitochondria of the knock-out beige cells have multiple impairments including an altered electron transport system generating lower electrochemical potential difference, reduced oxygen consumption, lower UCP1 protein content, and a higher portion of fragmented mitochondria. Most of these differences are present in preadipocytes as well, and the differentiation process cannot overcome the functional disadvantages completely. TG2 knock-out beige adipocytes produce more iodothyronine deiodinase 3 (DIO3) which may inactivate thyroid hormones required for the establishment of optimal mitochondrial function. The TG2 knock-out preadipocytes and beige cells are both hypometabolic as compared with the wild-type controls which may also be explained by the lower expression of solute carrier proteins SLC25A45, SLC25A47, and SLC25A42 which transport acylcarnitine, Co-A, and amino acids into the mitochondrial matrix. As a consequence, the mitochondria in TG2 knock-out beige adipocytes probably cannot reach the energy-producing threshold required for normal thermogenic functions, which may contribute to the decreased cold tolerance of TG2 knock-out mice.

Keywords: DIO3; SLC25A45; beige adipocytes; browning; uncoupling protein-1.


Conflict of interest statement

The authors declare no conflict of interest.

Figures

Figure 1
Figure 1
Differentiation of beige cells from TG2+/+ and TG2−/− preadipocytes isolated from the epidydimal fat depots: (A) Typical microscopic view of confluent preadipocytes and differentiated beige cells, images were taken using EVOS FL Cell Imaging System, scale bars represent 200 μm; (B) proliferation capacity of TG2+/+ and TG2−/− preadipocytes, cell density values were determined using Sulforhodamine B assays (n = 3); (C) average size of lipid droplets in beige cells; (D) total lipid content in beige cells; (E) gene expression value of the preadipocyte marker (Pref1) and beige marker genes (Ucp1, Tbx1, Tnfrsf9, and Tmem26) in preadipocytes and beige cells (n = 3). Columns represent the mean values ± SD. Statistical analyses were carried out using GraphPad Prism 7.0 version, by two-way ANOVA (Tukey’s multiple comparison test and Student’s t-test. ** p < 0.01, *** p < 0.001.
Figure 2
Figure 2
Detection of UCP1 and mitochondrial complex proteins and the levels of NADH and ATP in TG2+/+ and TG2−/− cells together with PGC1α and pAMPK expressions: (A) Representative Western blots of UCP1, II-SDHB, III-UQCRC2, V-ATPSA of beige cells (n = 3); (B) quantitative analyses of Western blots of UCP1, II-SDHB, III-UQCRC2, and V-ATPSA proteins (n = 3); (C) representative Western blots of UCP1, II-SDHB, III-UQCRC2, and V-ATPSA of preadipocytes (n = 3); (D) quantitative analyses of Western blots of UCP1, II-SDHB, III-UQCRC2, and V-ATPSA proteins of preadipocytes; (E) mitochondrial dehydrogenases activity levels in preadipocytes and differentiated beige cells (MTT assays, n = 3); (F) NADH and (G) ATP content of preadipocytes and beige cells; (H) representative Western blots and quantitative analyses of phospho-AMPKα and PGC-1α in preadipocytes and beige cells. β-ACTIN was used as a loading control. Columns represent the mean values ± SD. Statistical analyses were performed using Student’s t-test. *, **, and *** indicate statistically significant differences at p < 0.05, p < 0.01, or p < 0.001, respectively. n = 3.
Figure 3
Figure 3
Mitochondrial membrane potential levels and ROS production in TG2+/+ and TG2−/− cells: (A) Representative laser scanning cytometry images of TG2+/+ and TG2−/− preadipocytes; (B) quantitative analyses of mitochondrial membrane potential in preadipocytes; (C) representative laser scanning cytometry images of TG2+/+ and TG2−/− beige cells; (D) quantitative analysis of mitochondrial membrane potential in beige cells, DAPI staining was used to determine the number of cell nuclei, cells were stained with Mito Tracker Deep Red either in the absence or the presence of 10 μM antimycin; (E) endogenous and (F) total ROS production of preadipocytes and beige cells. Columns represent the mean values ± SD. Statistical analyses were performed using Student’s t-test. n = 4. * p < 0.05, ** p < 0.01, *** p < 0.001).
Figure 4
Figure 4
The bioenergetic profiles of TG2+/+ and TG2−/− preadipocytes and beige cells: (A) Mitochondrial basal oxygen consumption rate (OCR); (B) proton leak OCR detected after addition of oligomycin; (C) basal extracellular acidification rate (ECAR); (D) OCR/ECAR ratio under basal conditions; (E) the energy phenotype profile (EPP) of preadipocytes; (F) mitochondrial basal OCR; (G) proton leak OCR detected after addition of oligomycin; (H) basal extracellular acidification rate (ECAR); (I) OCR/ECAR ratio under basal conditions; (J) the energy phenotype profile (EPP) of beige cells. OCR and ECAR were simultaneously measured using a Seahorse Bioscience XF-96 analyzer. Columns represent the mean values ± SD. Statistical analyses were performed using Student’s t-test. n = 4, * p < 0.05, ** p < 0.01, **** p < 0.0001.
Figure 5
Figure 5
High content screening of the preadipocytes and beige cells, and detection of mitochondrial fission- and fusion-related proteins: (A) Representative high content screening images showing mitochondrial morphology in TG2+/+ and TG2−/− preadipocytes, scale bars represent 50 μm; (B) fractions of fragmented and tubular mitochondrial morphology in preadipocytes (%); (C) quantitative analysis of mitochondrial morphology in preadipocytes; (D) representative high content screening images showing mitochondrial morphology in TG2+/+ and TG2−/− beige cells; (E) fractions of fragmented and tubular mitochondrial morphology in beige cells (%); (F) quantitative analysis of mitochondrial morphology in beige cells, DAPI staining was used to determine the number of nuclei, the mitochondria were stained with Mito Tracker Deep Red either in the absence or presence of 10 μM antimycin A, Texas Red-X phalloidin was used to stain actin filaments for the detection of cell shapes (n = 3); (GJ) representative Western blot analyses and quantitative analyses of the mitochondrial fusion proteins (MFN2, OPA1) and mitochondrial fission proteins (DRP1, MFF) in preadipocytes and differentiated beige cells. β-ACTIN was used as a loading control. Columns represent the mean values ± SD. Statistical analyses were performed using Student’s t-test. n = 5. * p < 0.05.
Figure 6
Figure 6
Upregulated mitochondrion-related genes in TG2−/− beige cells as compared with TG2+/+: (A) Upregulated reactome pathways in the TG2−/− beige samples, based on the gene ontology (GO, Reactome pathway) analysis; (B) heatmap of the thyroid metabolism-related genes in beige adipocytes, framed genes were selected for validation; (CF) validation of the selected thyroid metabolism-related genes using RT-qPCR analyses; (G) representative Western blot analysis and quantitative analyses of DIO3 in preadipocytes and differentiated beige cells, β-ACTIN was used as loading control; (H) schematic representation of DIO3 in thyroid hormone inactivation, the panel is a modification of a figure from [40]; (I) fT3 concentration in the differentiation medium of the beige cells. Columns represent the mean values ± SD. Statistical analyses were performed using Student’s t-test. n = 3. * p < 0.05, ** p < 0.01, *** p < 0.001.
Figure 7
Figure 7
Downregulated mitochondrion-related genes in TG2−/− beige cells as compared with TG2+/+: (A) Downregulated Reactome pathways in the TG2−/− beige samples based on the gene ontology (GO, Reactome pathway) analysis; (B) heatmap of differentially expressed mitochondrial transporter genes in beige adipocytes, the framed genes were selected for validation; (C) schematic illustration of the roles of selected SLC transporters, the panel is a modification of a figure from [47]; (D) validation of the selected mitochondrial transporter genes using RT-qPCR analyses; (E) representative Western blot of SLC25A45 and quantitative analysis in preadipocytes and differentiated beige cells; (F) representative Western blot of SLC25A42 and quantitative analysis in preadipocytes and differentiated beige cells. Columns represent the mean values ± SD. Statistical analyses were performed using Student’s t-test. n = 3. * p < 0.05, ** p < 0.01.

Similar articles

Cited by

References

    1. Eckert R.L., Kaartinen M.T., Nurminskaya M., Belkin A.M., Colak G., Johnson G.V., Mehta K. Transglutaminase regulation of cell function. Physiol. Rev. 2014;94:383–417. doi: 10.1152/physrev.00019.2013. - DOI - PMC - PubMed
    1. Fesus L., Piacentini M. Transglutaminase 2: An enigmatic enzyme with diverse functions. Trends Biochem. Sci. 2002;10:534–539. doi: 10.1016/S0968-0004(02)02182-5. - DOI - PubMed
    1. Katt W.P., Antonyak M.A., Cerione R.A. Opening up about Tissue Transglutaminase: When Conformation Matters More than Enzymatic Activity. Med One. 2018;3:e180011. - PMC - PubMed
    1. Folk J.E., Finlayson J.S. The epsilon-(gamma-glutamyl) lysine crosslink and the catalytic role of transglutaminases. Adv. Protein Chem. 1977;31:1–133. - PubMed
    1. Lee K.N., Birckbichler P.J., Patterson M.K. GTP hydrolysis by guinea pig liver transglutaminase. Biochem. Biophys. Res. Commun. 1989;162:1370–1375. doi: 10.1016/0006-291X(89)90825-5. - DOI - PubMed

MeSH terms

Substances