. 2022 May 6;23(9):5184.
doi: 10.3390/ijms23095184.

Mechanisms of Resistance to Spot Blotch in Yunnan Iron Shell Wheat Based on Metabolome and Transcriptomics

Affiliations

Mechanisms of Resistance to Spot Blotch in Yunnan Iron Shell Wheat Based on Metabolome and Transcriptomics

Xuesong Zhang et al. Int J Mol Sci. .

Abstract

Spot blotch (SB) is a fungal disease that threatens wheat yield and quality. Presently, the molecular mechanism against SB is unclear. In this study, the resistant variety Zhenkang iron shell wheat (Yunmai 0030) and susceptible variety Lincang iron shell wheat (Yunmai 0608) were selected by identifying SB of Yunnan iron shell wheat. The metabolome and transcriptome of leaves of two varieties at different positions were detected using the systemic acquired resistance theory to investigate the molecular and physiological changes in Yunnan iron shell wheat under SB stress. We found that the genes and metabolites related to benzoxazinoid biosynthesis and arginine and proline metabolism were highly enriched after infection with leaf blight. The enriched differential metabolites mainly included phenolic acids, alkaloids, and flavonoids. We further observed that DIBOA- and DIMBOA-glucoside positively affected iron shell wheat resistance to leaf blight and proline and its derivatives were important for plant self-defense. Furthermore, we confirmed that the related metabolites in benzoxazinoid biosynthesis and arginine and proline metabolism positively affected Triticum aestivum ssp. resistance to SB. This study provides new insights into the dynamic physiological changes of wheat in response to SB, helps us better understand the mechanism of resistance to SB, and contributes to the breeding and utilization of resistant varieties.

Keywords: Triticum aestivum ssp.; benzoxazinoid biosynthesis; metabolome; spot blotch; transcriptome.


Conflict of interest statement

The authors declare that they have no conflict of interest.

Figures

Figure 1
Figure 1
Tic overlap diagram of quality control (QC) sample mass spectrometry detection: (a) positive ion mode, (b) negative ion mode, (c) principal component analysis (PCA) score diagram of all samples, and (d) correlation diagram between samples. Note: PC1 represents the first principal component, PC2 represents the second principal component, and the percentage represents the interpretation rate of the principal component to the data set; each point in the figure represents a sample, and the samples of the same group are represented by the same color.
Figure 1
Figure 1
Tic overlap diagram of quality control (QC) sample mass spectrometry detection: (a) positive ion mode, (b) negative ion mode, (c) principal component analysis (PCA) score diagram of all samples, and (d) correlation diagram between samples. Note: PC1 represents the first principal component, PC2 represents the second principal component, and the percentage represents the interpretation rate of the principal component to the data set; each point in the figure represents a sample, and the samples of the same group are represented by the same color.
Figure 2
Figure 2
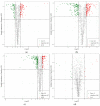
Differential metabolite volcano maps: (a) L-K vs. L-G, (b) N-G vs. L-G, (c) N-K vs. L-K, and (d) N-K vs. N-G. Each point in the volcano map represents a metabolite, in which the green points represent downregulated differential metabolites, the red points represent upregulated differential metabolites, and the gray points represent the detected but insignificant metabolites. The abscissa represents the logarithm (log2FC) of the quantitative difference multiples of a metabolite in two samples. The greater the absolute value of the abscissa the greater the differential expression. (e) Differental metabolite K-means diagram, (f) Venn diagram, wherein each circle represents a comparison group. The number of circles and overlapping parts represents the number of common differential metabolites between the comparison groups and the number without overlapping parts represents the number of unique differential metabolites in the comparison group.
Figure 2
Figure 2
Differential metabolite volcano maps: (a) L-K vs. L-G, (b) N-G vs. L-G, (c) N-K vs. L-K, and (d) N-K vs. N-G. Each point in the volcano map represents a metabolite, in which the green points represent downregulated differential metabolites, the red points represent upregulated differential metabolites, and the gray points represent the detected but insignificant metabolites. The abscissa represents the logarithm (log2FC) of the quantitative difference multiples of a metabolite in two samples. The greater the absolute value of the abscissa the greater the differential expression. (e) Differental metabolite K-means diagram, (f) Venn diagram, wherein each circle represents a comparison group. The number of circles and overlapping parts represents the number of common differential metabolites between the comparison groups and the number without overlapping parts represents the number of unique differential metabolites in the comparison group.
Figure 3
Figure 3
KEGG enrichment bubble. (a) L-K vs. L-G. (b) N-G vs. L-G. (c) N-K vs. L-K. The abscissa represents the Rich Factor corresponding to each pathway, and the ordinate represents the pathway name. The color of points reflects the p-value size, and the redder indicates the more significant enrichment. The size of the dot represents the number of enriched differential metabolites.
Figure 4
Figure 4
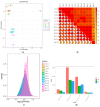
Note: in (a), PCA diagram, PC1 represents the first principal component, PC2 represents the second principal component, and the percentage represents the interpretation rate of the principal component to the data set; each point in the figure represents a sample, and the samples of the same group are represented by the same color. In the (b), Correlation heat map, r2 is to 1, the stronger the correlation between the two repeated samples is. Curves in different colors in (c) represent different samples. Expression density distribution. The abscissa of points on the curve represents the log value of the FPKM of the corresponding sample, and the ordinate of points represents the probability density. (d) represents the number of differentially down-regulated genes in different combinations. Differential gene histogram. In the Venn diagram (e), Venn diagram, the non-overlapping region represents the unique differential genes of the differential group and the overlapping region represents the common differential genes of several overlapping differential groups.
Figure 4
Figure 4
Note: in (a), PCA diagram, PC1 represents the first principal component, PC2 represents the second principal component, and the percentage represents the interpretation rate of the principal component to the data set; each point in the figure represents a sample, and the samples of the same group are represented by the same color. In the (b), Correlation heat map, r2 is to 1, the stronger the correlation between the two repeated samples is. Curves in different colors in (c) represent different samples. Expression density distribution. The abscissa of points on the curve represents the log value of the FPKM of the corresponding sample, and the ordinate of points represents the probability density. (d) represents the number of differentially down-regulated genes in different combinations. Differential gene histogram. In the Venn diagram (e), Venn diagram, the non-overlapping region represents the unique differential genes of the differential group and the overlapping region represents the common differential genes of several overlapping differential groups.
Figure 5
Figure 5
(a) L-K vs. L-G. (b) N-G vs. L-G. (c) N-K vs. L-K. (d) L-K vs. L-G. (e) N-G vs. L-G. (f) N-K vs. L-K. Histogram of GO enrichment entries (ac) and KEGG enrichment scatter diagram (df).
Figure 5
Figure 5
(a) L-K vs. L-G. (b) N-G vs. L-G. (c) N-K vs. L-K. (d) L-K vs. L-G. (e) N-G vs. L-G. (f) N-K vs. L-K. Histogram of GO enrichment entries (ac) and KEGG enrichment scatter diagram (df).
Figure 6
Figure 6
RT-qPCR Verification results.
Figure 7
Figure 7
(a) Network diagram of differential genes and metabolites in Benzoxazinoid biosynthesis; (b) network diagram of differential genes and metabolites in arginine and proline metabolism; (c) biosynthesis mechanism of Benzoxazinoid in different combinations, blue and red colors represent the up-regulation and down-regulation of gene expression and metabolites, respectively.
Figure 8
Figure 8
Links between metabolic pathways.
Figure 9
Figure 9
Four groups of leaf samples with three repetitions.

References

    1. Wang X., Dong L., Hu J., Pang Y., Hu L., Xiao G., Ma X., Kong X., Jia J., Wang H., et al. Dissecting genetic loci affecting grain morphological traits to improve grain weight via nested association mapping. Theor. Appl. Genet. 2019;132:3115–3128. doi: 10.1007/s00122-019-03410-4. - DOI - PMC - PubMed
    1. Li J., Jiang Y., Yao F., Long L., Wang Y., Wu Y., Li H., Wang J., Jiang Q., Kang H., et al. Genome-Wide Association Study Reveals the Genetic Architecture of Stripe Rust Resistance at the Adult Plant Stage in Chinese Endemic Wheat. Front. Plant Sci. 2020;11:625. doi: 10.3389/fpls.2020.00625. - DOI - PMC - PubMed
    1. Dong Y., Zheng D., Qiao D., Zeng X., En Z., Chen X. Expedition and investigation of Yunnan wheat (Triticum aestivum ssp. yunnanense King) Acta Agronom. Sin. 1981;7:145–152. (In Chinese)
    1. Dong Y.S., Zheng D.S. Chinese Wheat Genetic Resources. China Agriculture Press; Beijing, China: 1999. pp. 53–56.
    1. Zhang X.Y., Pang B.S., You G.X., Wang L.F., Jia J.Z., Dong Y.C. Allelic Variation and Genetic Diversity at Glu-1 Loci in Chinese Wheat (Triticum aestivum L.) Germplasms. Agric. Sci. China. 2002;1:1074–1082.

LinkOut - more resources