. 2022 May 6;23(9):5207.
doi: 10.3390/ijms23095207.

Polysialylation in a DISC1 Mutant Mouse

Affiliations

Polysialylation in a DISC1 Mutant Mouse

Yuka Takahashi et al. Int J Mol Sci. .

Abstract

Schizophrenia is a serious psychiatric disorder that affects the social life of patients. Psychiatric disorders are caused by a complex combination of genetic (G) and environmental (E) factors. Polysialylation represents a unique posttranslational modification of a protein, and such changes in neural cell adhesion molecules (NCAMs) have been reported in postmortem brains from patients with psychiatric disorders. To understand the G × E effect on polysialylated NCAM expression, in this study, we performed precise measurements of polySia and NCAM using a disrupted-in-schizophrenia 1 (DISC1)-mutant mouse (G), a mouse model of schizophrenia, under acute stress conditions (E). This is the first study to reveal a lower number and smaller length of polySia in the suprachiasmatic nucleus of DISC1 mutants relative to those in wild-type (WT) mice. In addition, an analysis of polySia and NCAM responses to acute stress in five brain regions (olfactory bulb, prefrontal cortex, suprachiasmatic nucleus, amygdala, and hippocampus) revealed that the pattern of changes in these responses in WT mice and DISC1 mutants differed by region. These differences could indicate the vulnerability of DISC1 mutants to stress.

Keywords: DISC1; NCAM; acute stress; environmental factor; genetic factor; mental disorder; polysialic acid; polysialyltransferase; schizophrenia; tail suspension test.


Conflict of interest statement

The authors declare no conflict of interest.

Figures
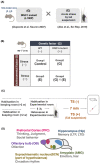
Figure 1
Figure 1
Experimental design of this study. (A) Interaction between genetic factor (G) and environmental factor (E), G × E. In this study, a schizophrenia mouse model (DISC1 mutant mice, L100P) was used as a contributing genetic factor. The environmental factor was established by exposing the mice to an acute stress condition, tail suspension. (B) Experimental design. Mice were divided into the control, G, E, and G × E groups, with five male mice per group. (C) Tail suspension test. Before this, pre-habituated mice (at least 2 weeks before experiment) were habituated for 1 h in the experimental room. Immediately after the end of the experiment, serum collection and brain extraction were performed. (D) Brain regions used in this study. The extraction was performed as described by Abe et al.
Figure 2
Figure 2
Comparison between WT and DISC1 mutant mice. (A) Immobility ratio. The immobility ratio of the mice (n = 5, 8 weeks, male) was measured during a tail suspension test. Error bars indicate the SEM (**: p < 0.01). (B) Concentration of corticosterone. The concentration of corticosterone, which is a marker of stress exposure, in serum was analyzed in the four groups of mice. DISC1 indicates DISC1 mutant mice and TS indicates the tail suspension. The concentration of corticosterone was determined using ELISA. Error bars indicate the SEM (**: p < 0.01).
Figure 3
Figure 3
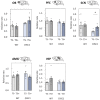
Measurement of the amounts of polySia by ELISA (12E3 antibody). PolySia expression levels in the five brain regions collected from the four groups of mice were analyzed. The samples were added to the wells of a 96-well plate (250 ng as protein), and the amounts of polySia were determined using the 12E3 anti-polySia antibody. The same sample was treated with endo-N, and subtraction was performed for specific polySia measurements. All data points represent averages of the three assays. The average in group 1 [WT, TS-] was set to 1. Error bars indicate the SEM (n = 5). OB: olfactory bulb, PFC: prefrontal cortex, SCN: suprachiasmatic nucleus, AMG: amygdala, HIP: hippocampus. *: p < 0.05, **: p < 0.01.
Figure 4
Figure 4
Measurement of polySia levels by ELISA (735 antibody). PolySia expression levels in the five brain regions collected from the four groups of mice were analyzed. The samples were added to the wells of a 96-well plate (250 ng as protein), and the amounts of polySia were determined using the 735 anti-polySia antibody. The same sample was treated with endo-N, and subtraction was performed for specific polySia measurements. All data points represent averages of the three assays. The average in group 1 [WT, TS-] was set to 1. Error bars indicate the SEM (n = 5). OB: olfactory bulb, PFC: prefrontal cortex, SCN: suprachiasmatic nucleus, AMG: amygdala, HIP: hippocampus. *: p < 0.05, **: p < 0.01.
Figure 4
Figure 4
Measurement of polySia levels by ELISA (735 antibody). PolySia expression levels in the five brain regions collected from the four groups of mice were analyzed. The samples were added to the wells of a 96-well plate (250 ng as protein), and the amounts of polySia were determined using the 735 anti-polySia antibody. The same sample was treated with endo-N, and subtraction was performed for specific polySia measurements. All data points represent averages of the three assays. The average in group 1 [WT, TS-] was set to 1. Error bars indicate the SEM (n = 5). OB: olfactory bulb, PFC: prefrontal cortex, SCN: suprachiasmatic nucleus, AMG: amygdala, HIP: hippocampus. *: p < 0.05, **: p < 0.01.
Figure 5
Figure 5
Measurement of NCAM levels using ELISA. NCAM expression levels in the five brain regions collected from the four groups of mice were analyzed. The samples were added to the wells of a 96-well plate (250 ng as protein) and treated with endo-N to determine the NCAM protein levels. NCAM was measured using the anti-CD56 antibody. All data points (each mouse) represent the average of the three assays. The average in group 1 [WT, TS-] was set to 1. Error bars indicate the SEM (n = 5). OB: olfactory bulb, PFC: prefrontal cortex, SCN: suprachiasmatic nucleus, AMG: amygdala, HIP: hippocampus. *: p < 0.05.
Figure 6
Figure 6
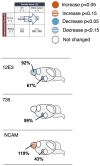
Effect of a genetic factor (DISC1 mutant) on the expression of polySia and NCAM. Heat map of changes observed using the 12E3, 735, and NCAM antibodies. [WT, TS−] (group 1) was set to 100%.
Figure 7
Figure 7
Effect of an environmental factor (acute stress) on the expression of polySia and NCAM. Heat map of changes observed using the 12E3, 735, and NCAM antibodies. [WT, TS−] (group 1) was set to 100%.

References

    1. van Os J., Kapur S. Schizophrenia. Lancet. 2009;374:635–645. doi: 10.1016/S0140-6736(09)60995-8. - DOI - PubMed
    1. Koszła O., Targowska-Duda K.M., Kędzierska E., Kaczor A.A. In Vitro and In Vivo Models for the Investigation of Potential Drugs Against Schizophrenia. Biomolecules. 2020;10:160. doi: 10.3390/biom10010160. - DOI - PMC - PubMed
    1. Schizophrenia Working Group of the Psychiatric Genomics Consortium Biological insights from 108 schizophrenia-associated genetic loci. Nature. 2014;511:421–427. doi: 10.1038/nature13595. - DOI - PMC - PubMed
    1. Sato C., Kitajima K. Polysialylation and disease. Mol. Aspects Med. 2021;79:100892. doi: 10.1016/j.mam.2020.100892. - DOI - PubMed
    1. Sato C., Kitajima K. Disialic. oligosialic and polysialic acids: Distribution, functions and related disease. J. Biochem. 2013;154:115–136. doi: 10.1093/jb/mvt057. - DOI - PubMed