. 2022 Apr 19;11(9):1377.
doi: 10.3390/cells11091377.

miR-324-5p and miR-30c-2-3p Alter Renal Mineralocorticoid Receptor Signaling under Hypertonicity

Affiliations

miR-324-5p and miR-30c-2-3p Alter Renal Mineralocorticoid Receptor Signaling under Hypertonicity

Thi An Vu et al. Cells. .

Abstract

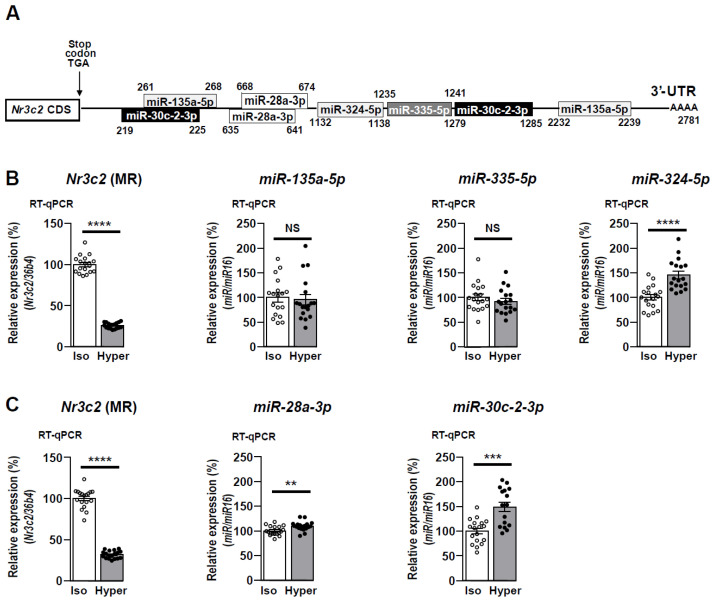
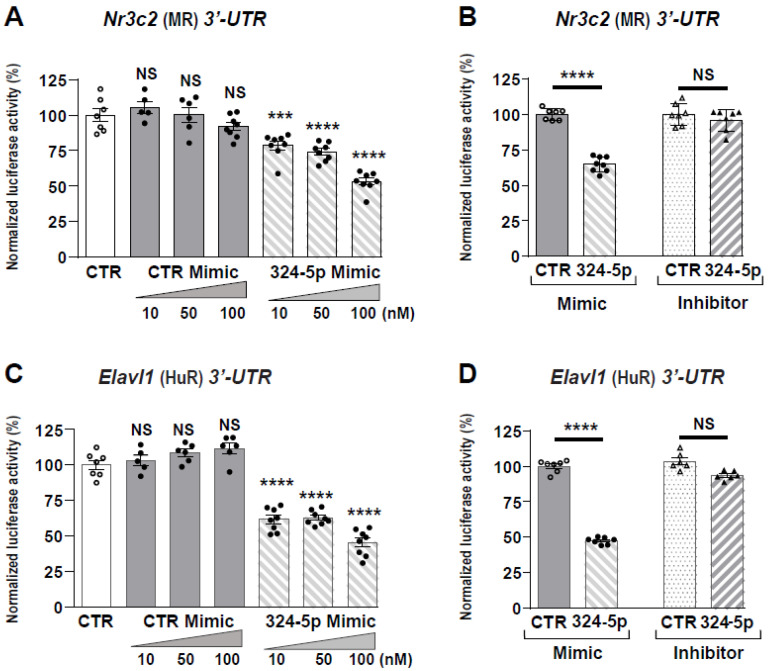
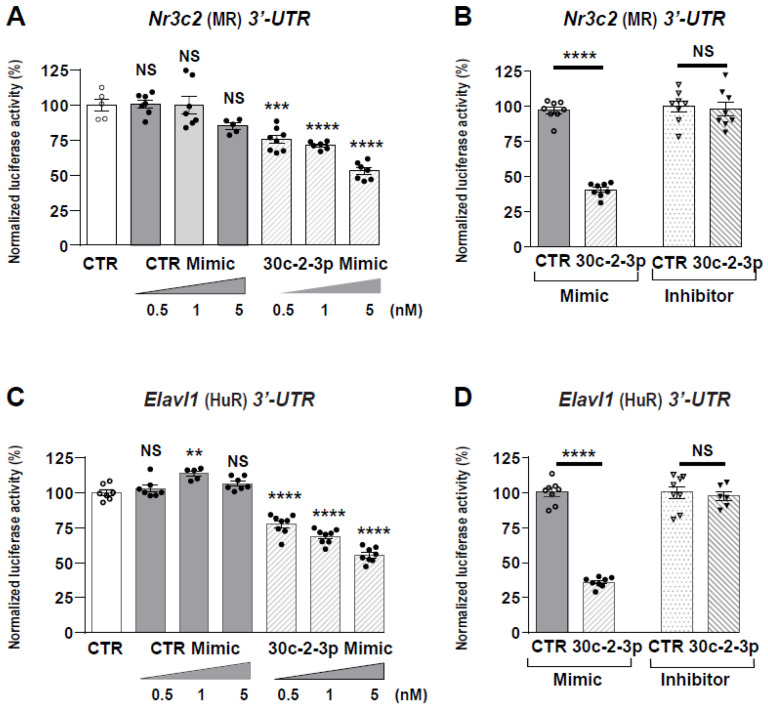
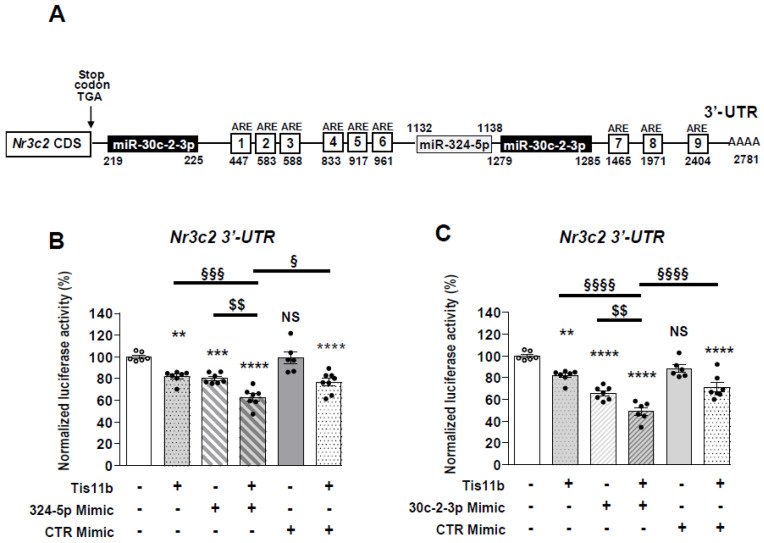
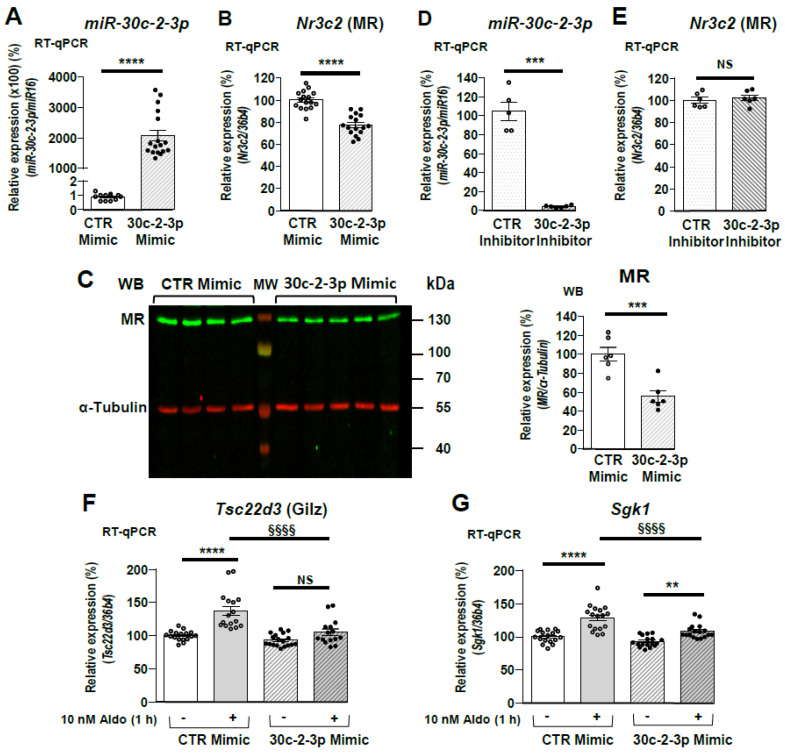
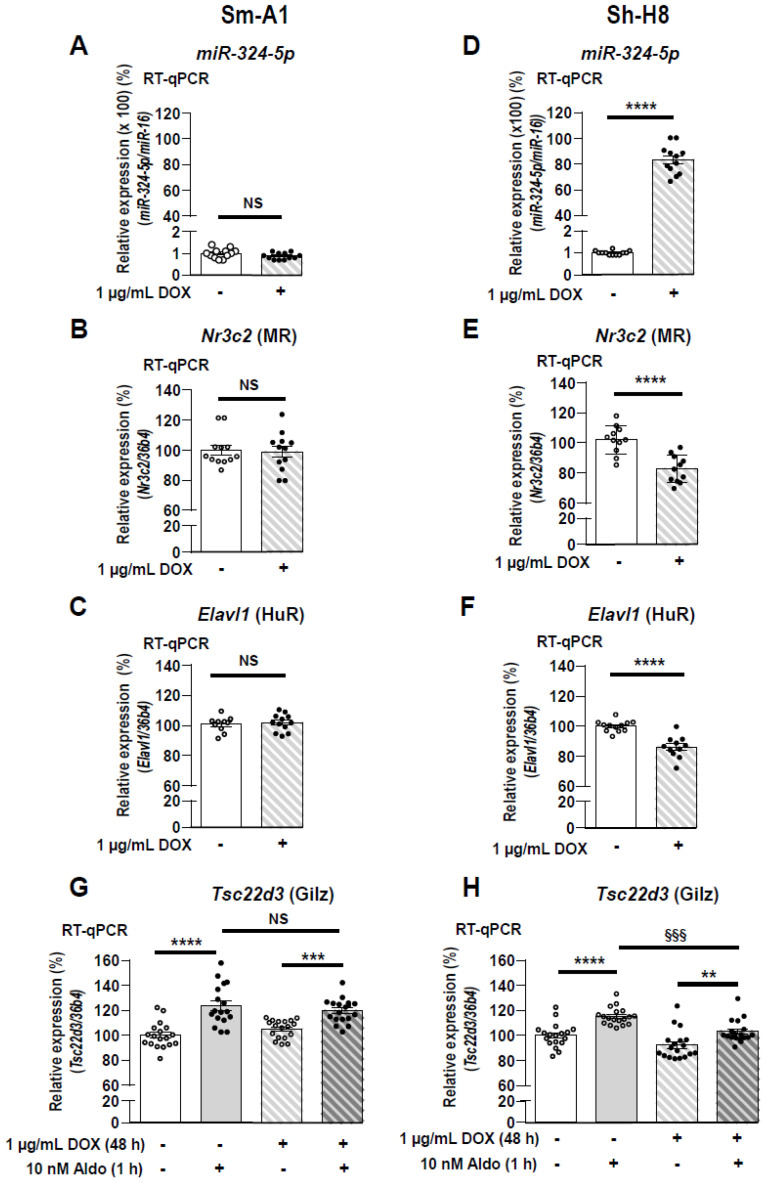
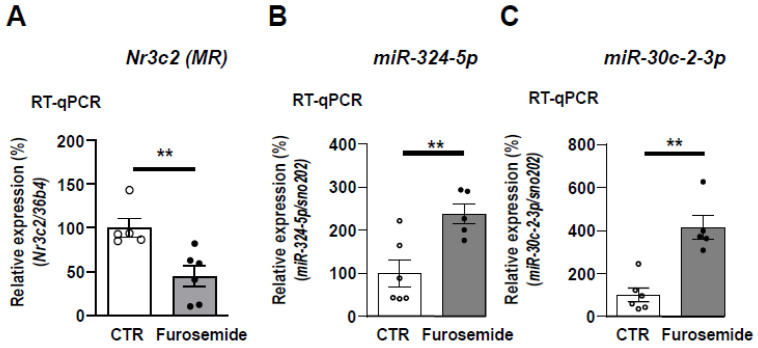
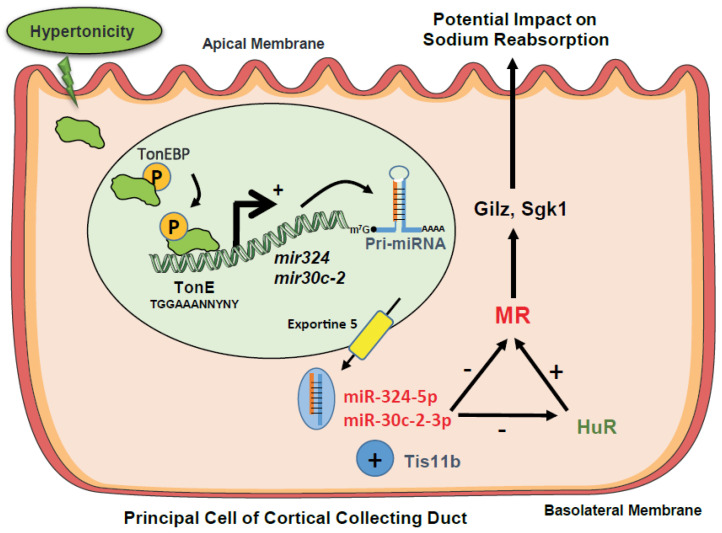
The Mineralocorticoid Receptor (MR) mediates the sodium-retaining action of aldosterone in the distal nephron, but mechanisms regulating MR expression are still poorly understood. We previously showed that RNA Binding Proteins (RBPs) regulate MR expression at the post-transcriptional level in response to variations of extracellular tonicity. Herein, we highlight a novel regulatory mechanism involving the recruitment of microRNAs (miRNAs) under hypertonicity. RT-qPCR validated miRNAs candidates identified by high throughput screening approaches and transfection of a luciferase reporter construct together with miRNAs Mimics or Inhibitors demonstrated their functional interaction with target transcripts. Overexpression strategies using Mimics or lentivirus revealed the impact on MR expression and signaling in renal KC3AC1 cells. miR-324-5p and miR-30c-2-3p expression are increased under hypertonicity in KC3AC1 cells. These miRNAs directly affect Nr3c2 (MR) transcript stability, act with Tis11b to destabilize MR transcript but also repress Elavl1 (HuR) transcript, which enhances MR expression and signaling. Overexpression of miR-324-5p and miR-30c-2-3p alter MR expression and signaling in KC3AC1 cells with blunted responses in terms of aldosterone-regulated genes expression. We also confirm that their expression is increased by hypertonicity in vivo in the kidneys of mice treated with furosemide. These findings may have major implications for the pathogenesis of renal dysfunctions, sodium retention, and mineralocorticoid resistance.

Keywords: aldosterone; hypertonicity; microRNAs; mineralocorticoid receptor; post-transcriptional regulation; sodium reabsorption.


Conflict of interest statement

The authors declare they have no competing interests.

Figures

Figure 1
Figure 1
Schematic representation of Nr3c2 (MR) 3′-UTR, expression of Nr3c2 (MR) and miRNA candidates in renal KC3AC1 cells under hypertonicity. (A) Location of predicted binding sites for miRNAs in the murine Nr3c2 (MR) 3′-UTR, 2.78 kbp, positioned after the stop codon TGA, arbitrarily set at +1. (B,C) RT-qPCR analyses of renal MR and expression of miRNA candidates from TLDA (B) and miRNAs-seq (C) approaches. KC3AC1 cells were grown for 7 days in complete medium then cells were exposed to isotonicity (Iso) or hypertonicity (Hyper) for 6 h. Nr3c2 (MR) transcript and miRNA levels under hypertonicity are expressed as a percentage of Nr3c2 (MR) mRNA or miRNA levels under isotonicity (arbitrarily set at 100%). Data are means ± SEMs from three independent experiments performed in six replicates (n = 18); isotonic condition (open circle, o), hypertonic condition (black circle, •). NS = not significant, ** p < 0.01, *** p < 0.001, **** p < 0.0001.
Figure 2
Figure 2
miR-324-5p functionally interacts with Nr3c2 (MR) and Elavl1 (HuR) 3′-UTR. The murine Nr3c2 (MR) and Elavl1 (HuR) 3′-UTR were cloned downstream of the pMIR-REPORT luciferase vector. (A,C) HEK 293T cells were transiently transfected, as described in Materials and Methods Section, with pMIR-luciferase plasmid (pMIR-Luc) fused to Nr3c2 (MR) or Elavl1 (HuR) 3′-UTR (40 ng/well of 96-well plates) and incubated with increasing concentrations (10, 50, 100 nM) of negative control Mimics (CTR Mimic) or of 324-5p Mimics. Luciferase activities were measured 24 h after transfection and normalized to β-galactosidase activities. (B,D) HEK 293T cells were transiently transfected with pMIR-Luc fused to Nr3c2 (MR) or Elavl1 (HuR) 3′-UTR (40 ng/well of 96-well plates) and 100 nM of CTR or 324-5p Mimics or with 100 nM of CTR or 324-5p Inhibitors. Luciferase activities were measured 24 h after transfection and normalized to β-galactosidase activities. Data are means ± SEMs (n = 8). NS = not significant, *** p < 0.001, **** p < 0.0001 compared to luciferase activity of pMIR-Luc fused to Nr3c2 (MR) or Elavl1 (HuR) 3′-UTR without Mimics (A,C) or with CTR Mimic or CTR inhibitor (B,D), arbitrarily set at 100%.
Figure 3
Figure 3
miR-30c-2-3p functionally interacts with Nr3c2 (MR) and Elavl1 (HuR) 3′-UTR. The murine Nr3c2 (MR) and Elavl1 (HuR) 3′-UTR were cloned downstream of the pMIR-REPORT luciferase vector. (A,C) HEK 293T cells were transiently transfected, as described in Materials and Methods Section, with pMIR-luciferase plasmid (pMIR-Luc) fused to Nr3c2 (MR) or Elavl1 (HuR) 3′-UTR (40 ng/well of 96-well plates) and incubated with increasing concentrations (0.5, 1, 5 nM) of negative control Mimics (CTR Mimic) or 30c-2-3p Mimics. Luciferase activities were measured 24 h after transfection and normalized to β-galactosidase activities. (B,D) HEK 293T cells were transiently transfected with pMIR-Luc fused to Nr3c2 (MR) or Elavl1 (HuR) 3′-UTR (40 ng/well of 96-well plates) and 10 nM of control (CTR) or 30c-2-3p Mimics and with 10 nM of control (CTR) or 30c-2-3p Inhibitors. Luciferase activities were measured 24 h after transfection and normalized to β-galactosidase activities. Data are means ± SEMs (n = 8). NS = not significant, ** p <0.01, *** p <0.001, **** p <0.0001 compared to luciferase activity of pMIR-Luc fused to Nr3c2 (MR) or Elavl1 (HuR) 3′-UTR without Mimics (A,C) or with CTR Mimics or CTR Inhibitors (B,D), arbitrarily set at 100%.
Figure 4
Figure 4
Cooperativity between miR-324-5p or miR-30c-2-3p and Tis11b on Nr3c2 (MR) 3′-UTR. (A) Location of A-U rich response elements (ARE) motifs [18] and of putative binding sites for miR-324-5p and miR-30c-2-3p in mouse Nr3c2 (MR) 3′-UTR, positioned after the stop codon TGA, arbitrarily set at +1. HEK 293T cells were transiently transfected, as described in Materials and Methods Section, with pMIR-luciferase plasmid (pMIR-Luc) fused to Nr3c2 (MR) 3′-UTR (40 ng/well of 96-well plates) with or without a Tis11b-encoding plasmid (10 ng/well) and in the absence or presence of 10 nM Control Mimics (CTR mimic) or of 10 nM 324-5p Mimics (B) or 0.5 nM 30c-2-3p Mimics (C). Luciferase activities were measured 24 h after transfection and normalized to β-galactosidase activities. Data are means ± SEMs (n = 8). NS = not significant, ** p < 0.01, *** p < 0.001, **** p < 0.0001 compared to luciferase activity of pMIR-Luc fused to Nr3c2 (MR) without Mimics, Tis11b or with CTR Mimics (CTR Mimic), arbitrarily set at 100%. § p < 0.05, §§ p < 0.01, §§§ p < 0.001 and §§§§ p < 0.0001 between the two conditions indicated by line.
Figure 5
Figure 5
miR-30c-2-3p overexpression decreases MR expression in renal KC3AC1 cells and compromises MR-mediated target gene expression. Renal KC3AC1 cells were transfected with 10 nM Mimics or 10 nM negative Control Mimics (CTR mimic). (A) Specific overexpression of miR-30c-2-3p in renal KC3AC1 cells was confirmed by RT-qPCR. (B) Quantitative RT-qPCR of endogenous Nr3c2 (MR) expression, analyzed 18 h after transfection. Data are means ± SEM from three independent experiments performed in 4–6 replicates (n = 12–18). NS = not significant, **** p < 0.0001 compared to CTR Mimics, arbitrarily set at 100%. (C) Western blot analysis of MR expression, 48 h following transfection of CTR Mimics or 30c-2-3p Mimics (left panel) and quantification of the corresponding signals (right panel) in which MR expression with CTR Mimics was arbitrarily set at 100%. Data are means ± SEMs (n = 6). (D,E) Renal KC3AC1 cells were transfected with 10 nM Inhibitors or negative Control Inhibitors (CTR inhibitor). (D) Specific overexpression of miR-30c-2-3p in renal KC3AC1 cells was confirmed by RT-qPCR. (E) Quantitative RT-qPCR of endogenous Nr3c2 (MR) expression, analyzed 18 h after transfection. Data are means ± SEMs (n = 6). NS = not significant, *** p < 0.001, **** p < 0.0001 compared to CTR inhibitor, arbitrarily set at 100%. (F,G) Overexpression of miR-30c-2-3p prevented aldosterone-induced expression of Tsc22d3 (Gilz) (F) or of Sgk1 (G) in renal KC3AC1 cells. KC3AC1 cells were deprived for 24 h in minimal medium then cells were transfected with 10 nM CTR Mimics or 10 nM 30c-2-3p Mimics. Eighteen hours later, cells were stimulated with 10 nM Aldosterone for 1 h then Tsc22d3 (Gilz) or Sgk1 expression was measured by RT-qPCR. Data are means ± SEM from three independent experiments performed in six replicates (n = 18). NS = not significant, ** p < 0.01, **** p < 0.0001 compared to condition without aldosterone stimulation. §§§§ p < 0.0001 between the 2 conditions indicated by line.
Figure 6
Figure 6
Impairment of MR signaling in KC3AC1 cells stably expressing miR-324-5p. miR-324-5p (A,D), Nr3c2 (MR) (B,E) and Elavl1 (HuR) (C,F) expression were determined by RT-qPCR, 48 h after doxycycline induction (1 µg/mL) in KC3AC1 clones stably transduced with lentiviral particles expressing inducible scrambled miRNAs (Sm-A1 clone, left panels) or miR-324-5p (Sh-H8 clone, right panels). Data are means ± SEMs from two independent experiments performed in six replicates (n = 12). NS = not significant, *** p < 0.001, **** p < 0.0001 compared to the condition in absence of doxycycline, arbitrarily set at 100%. (G,H) Sm-A1 and Sh-H8 clones were deprived in minimal medium for 48 h and incubated for 48 h with 1 µg/mL doxycycline. Thereafter, Sm-A1 and Sh-H8 clones were stimulated for 1 h with 10 nM aldosterone and Tsc22d3 (Gilz) expression (G,H) was quantified by RT-qPCR where basal Gilz expression in renal cells, in the absence of DOX and aldosterone, was arbitrarily set at 100%. Data are means ± SEMs from three independent experiments performed in six replicates per condition (n = 18). NS = not significant. ** p < 0.01 *** p < 0.001 **** p < 0.0001 compared to the condition without aldosterone stimulation, arbitrarily set at 100%. §§§ indicate p < 0.001 between the two conditions indicated by line.
Figure 7
Figure 7
Treatment of mice with furosemide increases renal miR-324-5p and miR-30c-2-3p expression in vivo. Furosemide (40 mg/kg), an NKCC2 inhibitor, was administrated for 4 h before sacrifice to induce a relative luminal hypertonicity. RT-qPCR of Nr3c2 (MR) (A), miR-324-5p (B), and miR-30c-2-3p (C) expression in the kidneys of treated-mice compared to control mice, arbitrarily set at 100%. Data are means ± SEMs (n = 5–6 animals). ** p < 0.01 compared to control mice.
Figure 8
Figure 8
Proposed model for the post-transcriptional control of renal MR expression by miRNAs under hypertonicity and its impact on MR signaling. Under hypertonicity, the transcription factor TonEBP binds TonE elements located in the regulatory regions of mir324 and mir30c2 genes which encode miR-324-5p and miR-30c-2-3p, respectively. Hypertonicity stimulates transcription of pri-miRNAs of miR-324-5p and of miR-30c-2-3p and their maturation. Thereafter, these miRNAs can repress MR expression directly by interacting with Nr3c2 (MR) 3′-UTR or indirectly by interacting with Elavl1 (HuR), an RNA Binding Protein, which was shown to stabilize Nr3c2 (MR) transcript under hypotonicity [19]. Moreover, these miRNAs can cooperate with Tis11b, an RNA Binding Protein, which was previously shown to accelerate destabilization of MR transcripts [18]. Thus, hypertonicity may compromise MR signaling.

References

    1. Viengchareun S., Le Menuet D., Martinerie L., Munier M., Tallec L.P.-L., Lombès M. The Mineralocorticoid Receptor: Insights into Its Molecular and (Patho)Physiological Biology. Nucl. Recept Signal. 2007;5:nrs.05012. doi: 10.1621/nrs.05012. - DOI - PMC - PubMed
    1. Masilamani S., Kim G.-H., Mitchell C., Wade J.B., Knepper M.A. Aldosterone-Mediated Regulation of ENaC α, β, and γ Subunit Proteins in Rat Kidney. J. Clin. Invest. 1999;104:R19–R23. doi: 10.1172/JCI7840. - DOI - PMC - PubMed
    1. Loffing J., Korbmacher C. Regulated Sodium Transport in the Renal Connecting Tubule (CNT) via the Epithelial Sodium Channel (ENaC) Pflug. Arch.-Eur J. Physiol. 2009;458:111–135. doi: 10.1007/s00424-009-0656-0. - DOI - PubMed
    1. Nesterov V., Dahlmann A., Krueger B., Bertog M., Loffing J., Korbmacher C. Aldosterone-Dependent and -Independent Regulation of the Epithelial Sodium Channel (ENaC) in Mouse Distal Nephron. AJP Ren. Physiol. 2012;303:F1289–F1299. doi: 10.1152/ajprenal.00247.2012. - DOI - PubMed
    1. Pearce D. The Role of SGK1 in Hormone-Regulated Sodium Transport. Trends Endocrinol. Metab. 2001;12:341–347. doi: 10.1016/S1043-2760(01)00439-8. - DOI - PubMed

Publication types

LinkOut - more resources