

Mitochondria Bioenergetic Functions and Cell Metabolism Are Modulated by the Bergamot Polyphenolic Fraction
- PMID: 35563707
- PMCID: PMC9099917
- DOI: 10.3390/cells11091401
Mitochondria Bioenergetic Functions and Cell Metabolism Are Modulated by the Bergamot Polyphenolic Fraction
Abstract
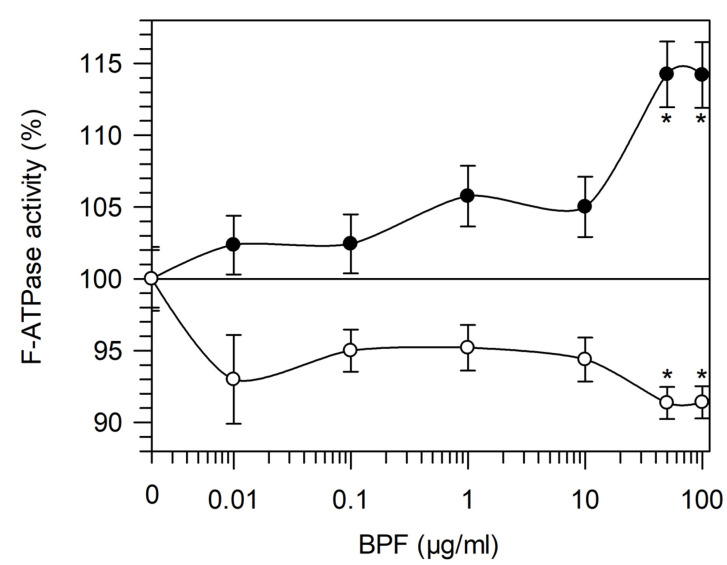
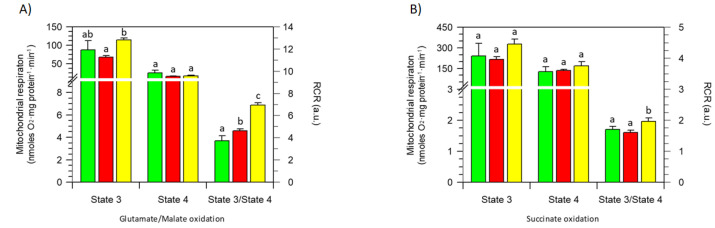
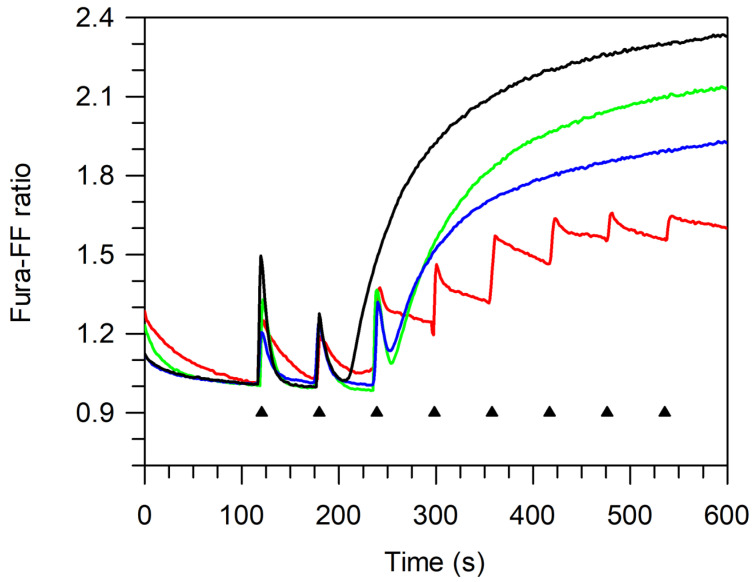
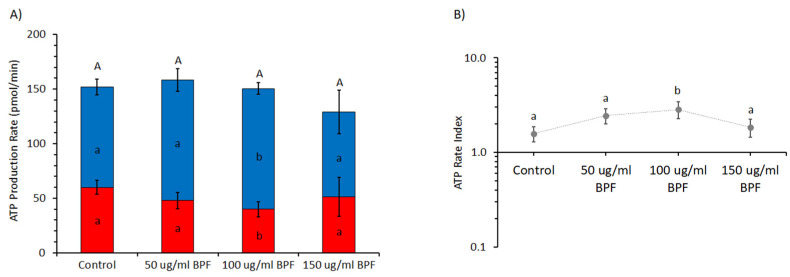
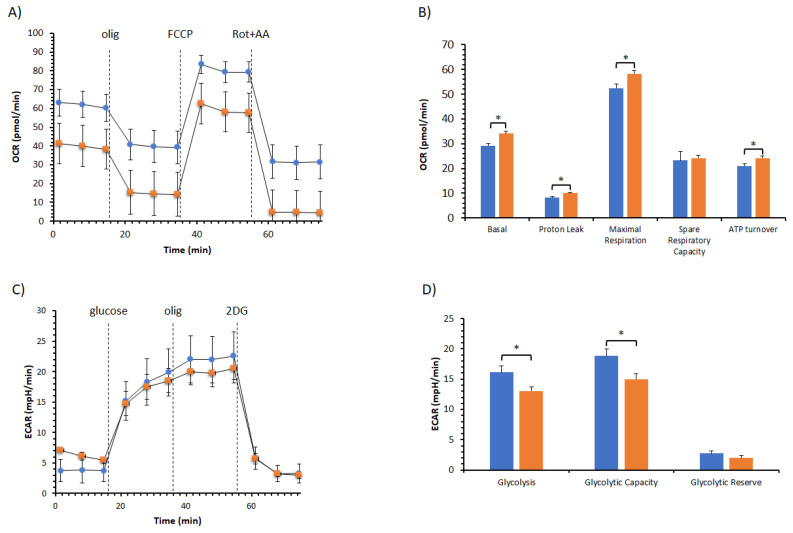
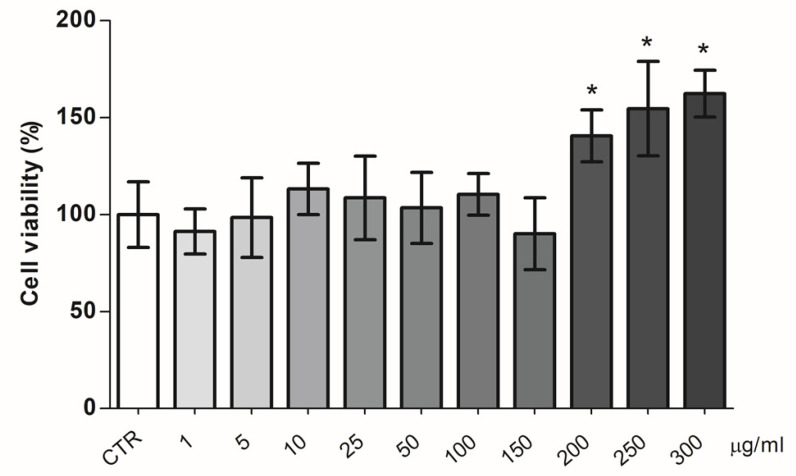
The bergamot polyphenolic fraction (BPF) was evaluated in the F1FO-ATPase activity of swine heart mitochondria. In the presence of a concentration higher than 50 µg/mL BPF, the ATPase activity of F1FO-ATPase, dependent on the natural cofactor Mg2+, increased by 15%, whereas the enzyme activity in the presence of Ca2+ was inhibited by 10%. By considering this opposite BPF effect, the F1FO-ATPase activity involved in providing ATP synthesis in oxidative phosphorylation and triggering mitochondrial permeability transition pore (mPTP) formation has been evaluated. The BPF improved the catalytic coupling of oxidative phosphorylation in the presence of a substrate at the first phosphorylation site, boosting the respiratory control ratios (state 3/state 4) by 25% and 85% with 50 µg/mL and 100 µg/mL BPF, respectively. Conversely, the substrate at the second phosphorylation site led to the improvement of the state 3/state 4 ratios by 15% only with 100 µg/mL BPF. Moreover, the BPF carried out its beneficial effect on the mPTP phenomenon by desensitizing the pore opening. The acute effect of the BPF on the metabolism of porcine aortica endothelial cells (pAECs) showed an ATP rate index greater than one, which points out a prevailing mitochondrial oxidative metabolism with respect to the glycolytic pathway, and this ratio rose by about three times with 100 µg/mL BPF. Consistently, the mitochondrial ATP turnover, in addition to the basal and maximal respiration, were higher in the presence of the BPF than in the controls, and the MTT test revealed an increase in cell viability with a BPF concentration above 200 µg/mL. Therefore, the molecule mixture of the BPF aims to ensure good performance of the mitochondrial bioenergetic parameters.
Keywords: F1FO-ATPase; bergamot polyphenolic fraction; cell metabolism; mitochondria; mitochondrial permeability transition pore; porcine aortic endothelial cells.
Conflict of interest statement
The authors declare no conflict of interest.
Figures
Similar articles
-
The Impairment of Cell Metabolism by Cardiovascular Toxicity of Doxorubicin Is Reversed by Bergamot Polyphenolic Fraction Treatment in Endothelial Cells.Int J Mol Sci. 2022 Aug 11;23(16):8977. doi: 10.3390/ijms23168977. Int J Mol Sci. 2022. PMID: 36012238 Free PMC article.
-
Sulfide affects the mitochondrial respiration, the Ca2+-activated F1FO-ATPase activity and the permeability transition pore but does not change the Mg2+-activated F1FO-ATPase activity in swine heart mitochondria.Pharmacol Res. 2021 Apr;166:105495. doi: 10.1016/j.phrs.2021.105495. Epub 2021 Feb 15. Pharmacol Res. 2021. PMID: 33600941
-
1,5-disubstituted-1,2,3-triazoles counteract mitochondrial dysfunction acting on F1FO-ATPase in models of cardiovascular diseases.Pharmacol Res. 2023 Jan;187:106561. doi: 10.1016/j.phrs.2022.106561. Epub 2022 Nov 21. Pharmacol Res. 2023. PMID: 36410676
-
A Therapeutic Role for the F1FO-ATP Synthase.SLAS Discov. 2019 Oct;24(9):893-903. doi: 10.1177/2472555219860448. Epub 2019 Jul 2. SLAS Discov. 2019. PMID: 31266411 Review.
-
From the Ca2+-activated F1FO-ATPase to the mitochondrial permeability transition pore: an overview.Biochimie. 2018 Sep;152:85-93. doi: 10.1016/j.biochi.2018.06.022. Epub 2018 Jun 28. Biochimie. 2018. PMID: 29964086 Review.
Cited by
-
Plant molecules reinforce bone repair: Novel insights into phenol-modified bone tissue engineering scaffolds for the treatment of bone defects.Mater Today Bio. 2023 Dec 21;24:100920. doi: 10.1016/j.mtbio.2023.100920. eCollection 2024 Feb. Mater Today Bio. 2023. PMID: 38226013 Free PMC article. Review.
-
The Impairment of Cell Metabolism by Cardiovascular Toxicity of Doxorubicin Is Reversed by Bergamot Polyphenolic Fraction Treatment in Endothelial Cells.Int J Mol Sci. 2022 Aug 11;23(16):8977. doi: 10.3390/ijms23168977. Int J Mol Sci. 2022. PMID: 36012238 Free PMC article.
-
Beneficial Effects of Citrus Bergamia Polyphenolic Fraction on Saline Load-Induced Injury in Primary Cerebral Endothelial Cells from the Stroke-Prone Spontaneously Hypertensive Rat Model.Nutrients. 2023 Mar 9;15(6):1334. doi: 10.3390/nu15061334. Nutrients. 2023. PMID: 36986064 Free PMC article.
-
Protective Role of an Extract Waste Product from Citrus bergamia in an In Vitro Model of Neurodegeneration.Plants (Basel). 2023 May 27;12(11):2126. doi: 10.3390/plants12112126. Plants (Basel). 2023. PMID: 37299105 Free PMC article.
-
Studies on the Comparative Response of Fibers Obtained from the Pastazzo of Citrus bergamia and Cladodes of Opuntia ficus-indica on In Vitro Model of Neuroinflammation.Plants (Basel). 2024 Aug 1;13(15):2123. doi: 10.3390/plants13152123. Plants (Basel). 2024. PMID: 39124241 Free PMC article.
References
-
- Niu Y., Moghimyfiroozabad S., Safaie S., Yang Y., Jonas E.A., Alavian K.N. Phylogenetic Profiling of Mitochondrial Proteins and Integration Analysis of Bacterial Transcription Units Suggest Evolution of F1Fo ATP Synthase from Multiple Modules. J. Mol. Evol. 2017;85:219–233. doi: 10.1007/s00239-017-9819-3. - DOI - PMC - PubMed
Publication types
MeSH terms
Substances
LinkOut - more resources
Full Text Sources
Miscellaneous
