. 2022 Apr 24;11(9):1437.
doi: 10.3390/cells11091437.

Obesity Affects the Proliferative Potential of Equine Endometrial Progenitor Cells and Modulates Their Molecular Phenotype Associated with Mitochondrial Metabolism

Affiliations

Obesity Affects the Proliferative Potential of Equine Endometrial Progenitor Cells and Modulates Their Molecular Phenotype Associated with Mitochondrial Metabolism

Agnieszka Smieszek et al. Cells. .

Abstract

The study aimed to investigate the influence of obesity on cellular features of equine endometrial progenitor cells (Eca EPCs), including viability, proliferation capacity, mitochondrial metabolism, and oxidative homeostasis. Eca EPCs derived from non-obese (non-OB) and obese (OB) mares were characterized by cellular phenotype and multipotency. Obesity-induced changes in the activity of Eca EPCs include the decline of their proliferative activity, clonogenic potential, mitochondrial metabolism, and enhanced oxidative stress. Eca EPCs isolated from obese mares were characterized by an increased occurrence of early apoptosis, loss of mitochondrial dynamics, and senescence-associated phenotype. Attenuated metabolism of Eca EPCs OB was related to increased expression of pro-apoptotic markers (CASP9, BAX, P53, P21), enhanced expression of OPN, PI3K, and AKT, simultaneously with decreased signaling stabilizing cellular homeostasis (including mitofusin, SIRT1, FOXP3). Obesity alters functional features and the self-renewal potential of endometrial progenitor cells. The impaired cytophysiology of progenitor cells from obese endometrium predicts lower regenerative capacity if used as autologous transplants.

Keywords: cellular metabolism; endometrial progenitor cells; obesity; self-renewal potential.


Conflict of interest statement

The authors declare no conflict of interest.

Figures

Figure 1
Figure 1
Phenotype of Eca EPCs. The RT-qPCR analysis aimed to determine relative transcript levels of cell surface markers (a). The mRNA expression was established for MSCs markers (CD29, CD44, CD90, CD105), perivascular markers (NG2, CD146), epithelial marker (MUC-1) and smooth muscle markers (ACTA2, CNN1, MHY11). The mRNA expression for hematopoietic markers (CD34, CD45) was not included on the graphs due to the lack of a specific signal. The PCR products were analyzed using electrophoresis (b). The cellular phenotype was tested using immunocytochemistry. The scale bar indicated on merged figures is equal to 30 μm (c). All results are shown as mean ± SD. Columns with bars represent means ± SD. * p-value < 0.05, **** p-value < 0.0001, while ns symbol refers to non-significant differences.
Figure 1
Figure 1
Phenotype of Eca EPCs. The RT-qPCR analysis aimed to determine relative transcript levels of cell surface markers (a). The mRNA expression was established for MSCs markers (CD29, CD44, CD90, CD105), perivascular markers (NG2, CD146), epithelial marker (MUC-1) and smooth muscle markers (ACTA2, CNN1, MHY11). The mRNA expression for hematopoietic markers (CD34, CD45) was not included on the graphs due to the lack of a specific signal. The PCR products were analyzed using electrophoresis (b). The cellular phenotype was tested using immunocytochemistry. The scale bar indicated on merged figures is equal to 30 μm (c). All results are shown as mean ± SD. Columns with bars represent means ± SD. * p-value < 0.05, **** p-value < 0.0001, while ns symbol refers to non-significant differences.
Figure 2
Figure 2
The analysis of Eca EPCs multipotency. Tissue-specific differentiation extracellular matrix features were documented (a). Cultures were maintained under osteogenic, chondrogenic and adipogenic conditions. Calcium deposits formed under osteogenic conditions were detected using Alizarin Red staining, while chondrogenic nodules were stained with Safranin-O dye. The lipid-rich vacuoles after adipogenic stimulation were detected with Oil Red O. The staining efficiency was measured to compare the differentiation potential of Eca EPCs non-OB with Eca EPCs OB (bd). Columns with bars represent means ± SD. **** p-value < 0.0001, while ns symbol refers to non-significant differences.
Figure 3
Figure 3
The proliferative capacity of equine endometrial progenitor cells (Eca EPCs) isolated from non-obese mares (non-OB) and obese mares (OB), expressed by colony formation capability (a,b), migratory efficiency (cf), population doubling time (g), metabolic activity (h). Columns with bars represent mean ± SD. * p-value < 0.05, ** p-value < 0.01, *** p-value < 0.001 and **** p-value < 0.0001, while ns symbol refers to non-significant differences.
Figure 4
Figure 4
The proliferative capacity of equine endometrial progenitor cells (Eca EPCs) isolated from non-obese mares (non-OB) and obese mares (OB) evaluated based on Ki67 expression (ac), distribution of cells within the cell cycle (de), and levels of particular let7 family members: let7a (f), let7b (g) and let7c (h). Columns with bars represent means ± SD. * p-value < 0.05, ** p-value < 0.01 and *** p-value < 0.001, while ns symbol refers to non-significant differences.
Figure 5
Figure 5
Morphology, ultrastructure, the growth pattern of equine endometrial progenitor cells (Eca EPCs) isolated from non-obese mares (non-OB) and obese mares (OB), and analysis of transcripts associated with a cytoskeletal network. The cultures were imaged with a confocal microscope to determine ultrastructure. Growth pattern of cell cultures was monitored under a phase-contrast microscope. Scale bars are indicated in the representative photographs (a,b). Additionally, RT-qPCR was performed to determine the mRNA expression of vimentin (VIM); (c) and levels of miR-29a-3p and miR-181-5p (d,e). Moreover, the senescence-associated β-Galactosidase (SA β-gal) was detected in cultures (f). Results are presented as a column with bars representing means ± SD. ** p-value < 0.01 and *** p-value < 0.001.
Figure 6
Figure 6
Mitochondrial network, numbers, and morphology of equine endometrial progenitor cells (Eca EPCs) isolated from non-obese mares (non-OB) and obese mares (OB). Imaging of Eca EPCs with high magnification allowed assessment of the mitochondrial net and its dynamics (a,b), the number of mitochondria per cell (c) and classification of mitochondrial morphology (dh). Mean ± SD is presented as columns and bars. *** p-value < 0.001.
Figure 7
Figure 7
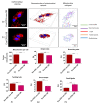
The mitochondrial membrane potential (MMP) determined in equine endometrial progenitor cells (Eca EPCs) isolated from non-obese mares (non-OB) and obese mares (OB) The representative graphs show the distribution of cells, taking into account their viability and mitochondrial membrane depolarisation (a,b). The cells were counterstained with cationic and lipophilic dye to detect changes in MMP and 7-AAD. The gating strategy allowed us to evaluate contribution of four populations of cells, i.e., (i) healthy cells with high MMP (live—bottom right corner); (ii) live cells with low MMP (depolarized/live—bottom left corner), (iii) dead (late apoptotic cells) with depolarized mitochondrial membrane (depolarized/dead—upper left corner) and necrotic (dead—upper right corner). Comparative analysis was performed to determine differences between EPCs non-OB and OB in terms of viability (c) and mitochondrial activity (d). Mean ± SD. *** p-value < 0.001.
Figure 8
Figure 8
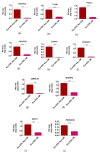
Transcript levels for genes associated with mitochondria homeostasis determined for equine endometrial progenitor cells (Eca EPCs) isolated from non-obese mares (non-OB) and obese mares (OB). The analysis was performed usi, bng RT-qPCR technologies. The following genes were measured: ubiquinol-cytochrome c reductase core protein 2 (UQCRC2, (a)), transcription factor A, mitochondrial (TFAM, (b)), pseudouridylate synthase-like 1 (PUSL1, (c)), NADH: ubiquinone oxidoreductase subunit A9 (NDUFA9, (d)), cytochrome c oxidase subunit 4I1 (COX4I1, (e)), PIGB opposite strand 1 (PIGBOS1, (f)), mitochondrial ribosomal protein L24 (MRPL24, (g)), mitochondrial transcription termination factor 4 (MTERF4, (h)), mitochondrial inner membrane protein (OXA1L, (i)) and PPARG coactivator 1 beta (PPARGC1β, (j)). Obtained data were normalized to the expression of the reference gene and expressed as using RQ (max) algorithm. Results are presented as columns with bars representing means ± SD. *** p-value < 0.001.
Figure 9
Figure 9
The expression profile of molecular markers associated with mitochondrial dynamics determined for equine endometrial progenitor cells (Eca EPCs) isolated from non-obese mares (non-OB) and obese mares (OB). Parkin RBR E3 ubiquitin-protein ligase (PARKIN), PTEN-induced kinase 1 (PINK1) and mitofusin 1 (MFN1) were determined based on mRNA (b,d,f) and protein levels (a)—representative blots; (c,e,g)—graphs reflecting the expression of proteins normalized to the β-actin/ACTB), additionally transcript levels for fission (FIS) were determined (h). Means ± SD. * p-value < 0.05, ** p-value < 0.01 and *** p-value < 0.001.
Figure 10
Figure 10
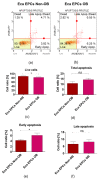
The apoptosis profile determined in equine endometrial progenitor cells (Eca EPCs) isolated from non-obese mares (non-OB) and obese mares (OB). The representative graphs show the distribution of cells, taking into account their viability (a,b). The viable cells are noted in the left bottom corner (Live), early apoptotic cells are located in the right bottom corner. Late apoptotic cells are visible in the right upper corner, while necrotic cells (dead) are in the left upper corner. The total apoptotic cells percentage reflects the sum of early and late apoptotic cells. Comparative analysis was performed to determine differences between Eca EPCs non-OB and OB for viability (c) total cell apoptosis (d) early apoptosis (e) and late apoptosis (f). Means ± SD. * p-value < 0.05, while ns symbol refers to non-significant differences.
Figure 11
Figure 11
The expression profile of genes associated with apoptosis determined in equine endometrial progenitor cells (Eca EPCs) isolated from non-obese mares (non-OB) and obese mares (OB). The transcript levels were determined using RT-qPCR and normalized to the expression of GAPDH (glyceraldehyde-3-phosphate dehydrogenase) and spike control. The tested apoptotic markers were Bcl-2-associated X protein (BAX, (a)) and B-cell lymphoma 2 (BCL-2, (b)) which levels were used for determination of BAX/BCL-2 ratio (c). Moreover, mRNA levels were established for caspase 9 (CASP9, (d)), cellular tumor antigen p53 (P53, (e)) and cyclin-dependent kinase inhibitor 1A (P21, (f)). The relative values of gene expression were established using RQMAX algorithm. Means ± SD, ** p-value < 0.01 and *** p-value < 0.001.
Figure 12
Figure 12
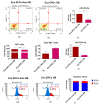
The analysis of the oxidative status in equine endometrial progenitor cells (Eca EPCs) isolated from non-obese mares (non-OB) and obese mares (OB). Representative dot plots show the distribution of cells based on intracellular accumulation of nitric oxide—NO (a,b), while column graphs show statistical analyses (d,e). The cells located in the left bottom corner of dot-plot graphs did not accumulate NO (Live), while viable cells that accumulated NO are located in the right bottom corner. Dead cells are located in the upper part of dot-plot—in the left corner NO negative cells (NO) while in the right NO positive cells (NO+). The increased overall percentage of NO positive cells noted in EPCs OB corresponds with the lowered expression of miR-20a (c) and miR-133b (f). The distribution of cells based on reactive oxygen species (ROS) accumulation is visible on histograms (g,h). Cells that did not accumulate intracellular ROS are marked with a blue gate, while ROS positive cells are marked with a red gate. The comparative analysis confirmed oxidative stress in Eca EPCs OB (i). Means ± SD. * p-value < 0.05 and ** p-value < 0.01.
Figure 13
Figure 13
Expression of forkhead box P3 (FOXP3), sirtuin 1 (SIRT1) and osteopontin (OPN) determined in equine endometrial progenitor cells (Eca EPCs) isolated from non-obese mares (non-OB) and obese mares (OB). The protein levels were normalized to β-actin (ACTB). Protein expression was detected using Western blot technique (a), while RT-qPCR (bd) was used to establish the mRNA level for genes of interest. The densitometry measurements of membranes were performed to compare the expression of proteins between EPCs non-OB and OB (ej). Significant differences were calculated for normalized values and shown as means ± SD. * p-value < 0.05 and ** p-value < 0.01 and *** p-value < 0.001.
Figure 14
Figure 14
Expression of Pi3K/AKT determined and compared between EPCs non-OB and OB. The intracellular accumulation of AKT and PI3K was visualized using immunocytochemistry (ICC, a,b) and determined with Western blot (c). RT-qPCR (di) was used to establish mRNA levels for genes of interest. Densitometry measurements of membranes were performed to compare expression of proteins between EPCs non-OB and OB. The protein levels were normalized to β-actin /ACTB (ei). Significant differences were calculated for normalized values and shown as means ± SD. ** p-value < 0.01 and *** p-value < 0.001, while ns indicates non-significant difference.

Similar articles

Cited by

References

    1. Rhee J.S., Saben J.L., Mayer A.L., Schulte M.B., Asghar Z., Stephens C., Chi M.M.-Y., Moley K.H. Diet-Induced Obesity Impairs Endometrial Stromal Cell Decidualization: A Potential Role for Impaired Autophagy. Hum. Reprod. 2016;31:1315–1326. doi: 10.1093/humrep/dew048. - DOI - PMC - PubMed
    1. Das M., Sauceda C., Webster N.J.G. Mitochondrial Dysfunction in Obesity and Reproduction. Endocrinology. 2021;162:bqaa158. doi: 10.1210/endocr/bqaa158. - DOI - PMC - PubMed
    1. Robles M., Nouveau E., Gautier C., Mendoza L., Dubois C., Dahirel M., Lagofun B., Aubrière M.-C., Lejeune J.-P., Caudron I., et al. Maternal Obesity Increases Insulin Resistance, Low-Grade Inflammation and Osteochondrosis Lesions in Foals and Yearlings until 18 Months of Age. PLoS ONE. 2018;13:e0190309. doi: 10.1371/journal.pone.0190309. - DOI - PMC - PubMed
    1. Johnson P.J., Wiedmeyer C.E., Messer N.T., Ganjam V.K. Medical Implications of Obesity in Horses—Lessons for Human Obesity. J. Diabetes Sci. Technol. 2009;3:163–174. doi: 10.1177/193229680900300119. - DOI - PMC - PubMed
    1. Kosolofski H.R., Gow S.P., Robinson K.A. Prevalence of Obesity in the Equine Population of Saskatoon and Surrounding Area. Can. Vet. J. 2017;58:967–970. - PMC - PubMed

Publication types