. 2022 Apr 25;11(9):1446.
doi: 10.3390/cells11091446.

Generation of Isogenic hiPSCs with Targeted Edits at Multiple Intronic SNPs to Study the Effects of the Type 2 Diabetes Associated KCNQ1 Locus in American Indians

Affiliations

Generation of Isogenic hiPSCs with Targeted Edits at Multiple Intronic SNPs to Study the Effects of the Type 2 Diabetes Associated KCNQ1 Locus in American Indians

Anup K Nair et al. Cells. .

Abstract

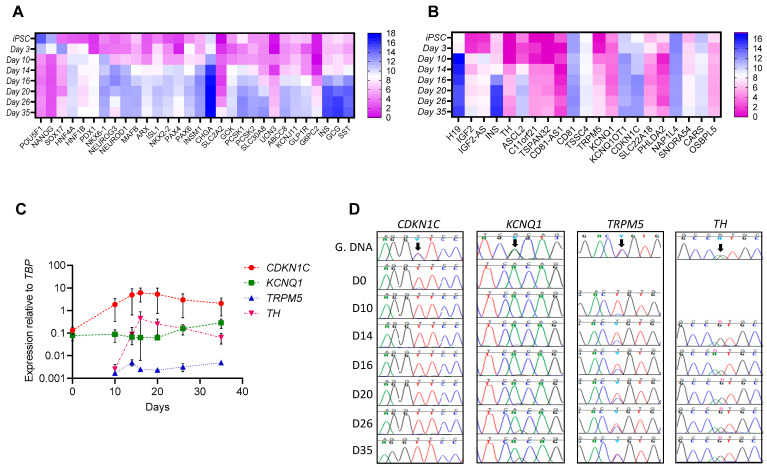
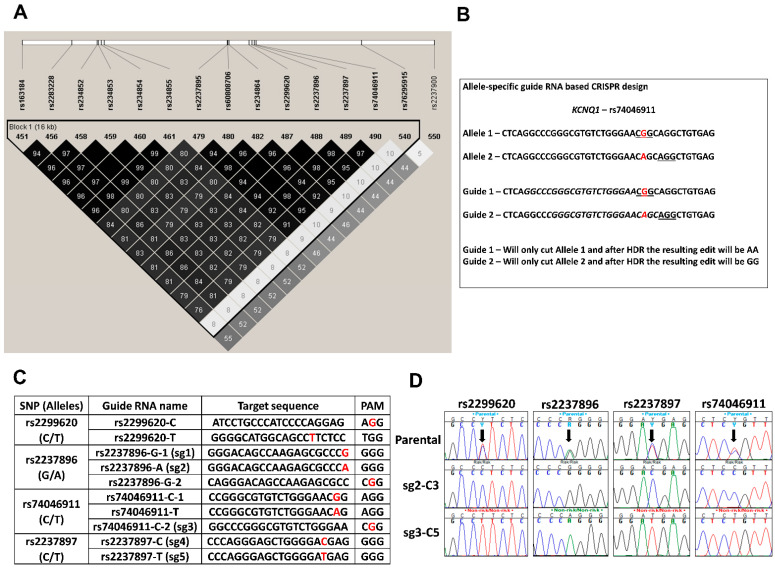
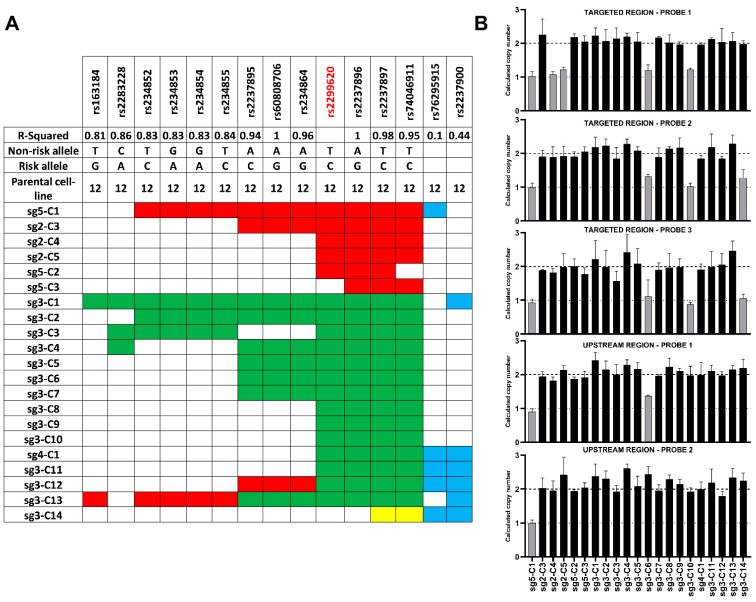
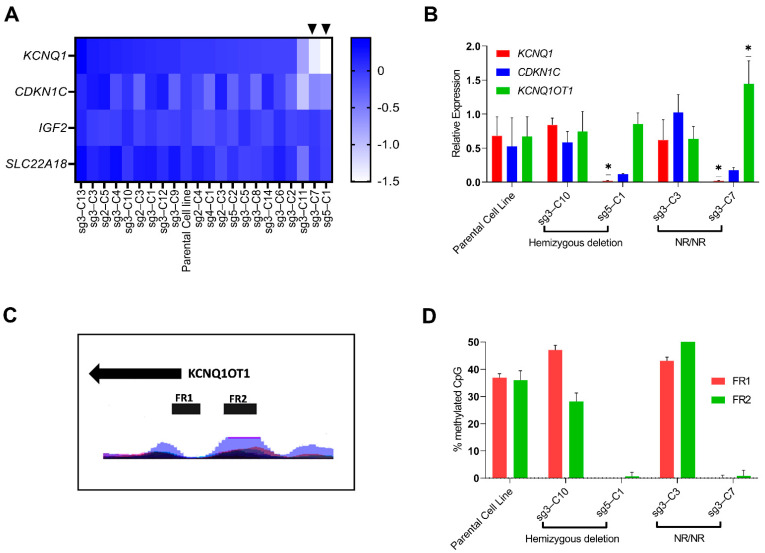
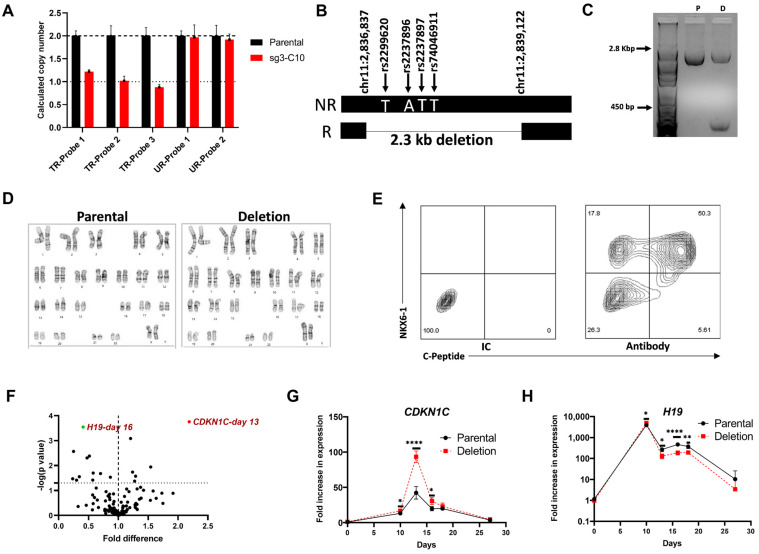
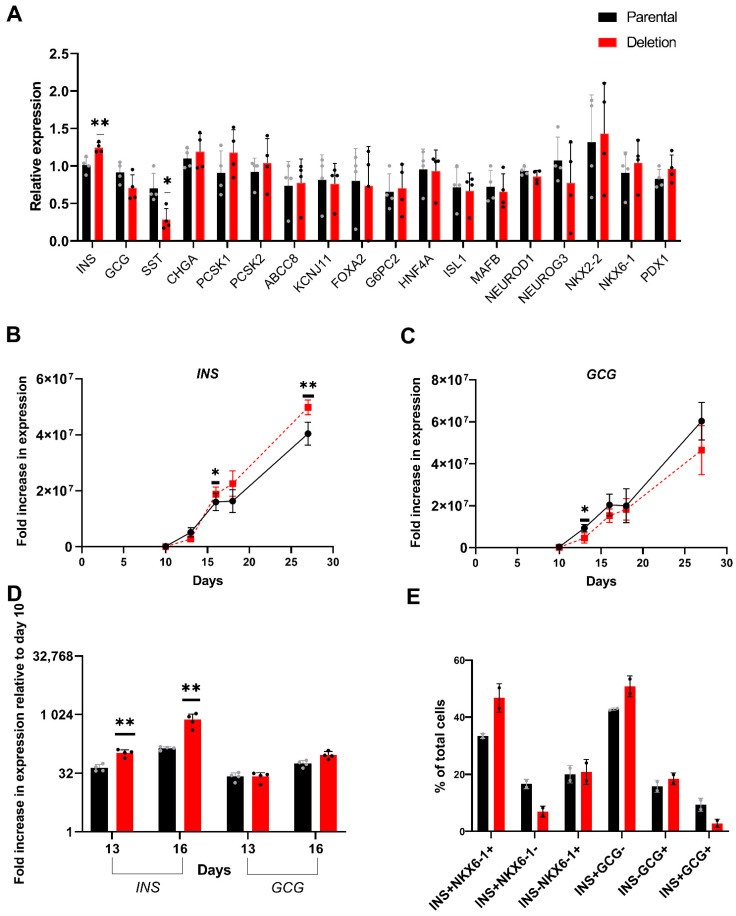
The top genetic association signal for type 2 diabetes (T2D) in Southwestern American Indians maps to intron 15 of KCNQ1, an imprinted gene. We aim to understand the biology whereby variation at this locus affects T2D specifically in this genomic background. To do so, we obtained human induced pluripotent stem cells (hiPSC) derived from American Indians. Using these iPSCs, we show that imprinting of KCNQ1 and CDKN1C during pancreatic islet-like cell generation from iPSCs is consistent with known imprinting patterns in fetal pancreas and adult islets and therefore is an ideal model system to study this locus. In this report, we detail the use of allele-specific guide RNAs and CRISPR to generate isogenic hiPSCs that differ only at multiple T2D associated intronic SNPs at this locus which can be used to elucidate their functional effects. Characterization of these isogenic hiPSCs identified a few aberrant cell lines; namely cell lines with large hemizygous deletions in the putative functional region of KCNQ1 and cell lines hypomethylated at the KCNQ1OT1 promoter. Comparison of an isogenic cell line with a hemizygous deletion to the parental cell line identified CDKN1C and H19 as differentially expressed during the endocrine progenitor stage of pancreatic-islet development.

Keywords: CDKN1C; H19; KCNQ1; allele-specific guide RNA; hiPSCs; pancreatic-beta like cells; type 2 diabetes.


Conflict of interest statement

The authors declare no conflict of interest. The funders had no role in the design of the study; in the collection, analyses, or interpretation of data; in the writing of the manuscript, or in the decision to publish the results.

Figures

Figure 1
Figure 1
Gene expression and imprinting at the KCNQ1 locus during beta-like cell development from hiPSCs. (A,B). Heatmap showing average deseq2 normalized counts from RNA sequencing of different stages of beta-like cell differentiation from three different American Indian hiPSCs for (A) selected stage specific differentiation markers and (B) genes in a 1.1 mb region at the KCNQ1 locus. (C). Expression of KCNQ1, CDKN1C, TRPM5 and TH during different stages of beta-like cell differentiation relative to the expression of TBP (housekeeping gene) from the same stage (n = 2). (D). Chromatograms showing a heterozygous coding SNP (arrow) in KCNQ1, CDKN1C, TRPM5 and TH in genomic DNA (G.DNA) from hiPSCs and either monoallelic or biallelic expression (as seen by either one peak or two peak) in cDNA from different stages of differentiation. D0—iPSCs, D10—Pancreatic progenitors, D14 and D16—Endocrine progenitors, D20—immature beta-like cells, D26 and D35—mature beta-like cells.
Figure 2
Figure 2
Experimental design and generation of genome-edited isogenic hiPSCs with edits at multiple SNPs. (A). Linkage disequilibrium at the T2D associated KCNQ1 locus in Southwestern American Indians. Selected SNPs in strong LD with the T2D associated lead SNP (rs2299620) at the KCNQ1 locus identified using whole-genome sequencing data from 296 American Indian subjects. (B). A representative example showing allele-specific guide RNA design to target the T2D associated rs74046911 SNP (highlighted in red) at the KCNQ1 locus. DNA repair following CRIPSR will lead to loss of heterozygosity at nearby SNPs as well. Red—SNP, underline—PAM site, Italics—20 bp target sequence upstream of the PAM site. (C). Allele-specific Guide RNA design showing the targeted SNPs, target sequence (protospacer) and the PAM site. SNP site is indicated in red. (D). Generation of isogenic cells lines using allele specific CRISPR sgRNAs. Chromatograms showing successful edits at the four putative functional SNPs (arrows) from two representative clonal cell lines compared to the parental cell line.
Figure 3
Figure 3
Extended genotyping of the clonal cell lines and identification of CRISPR induced large deletions. (A). Extended genotyping of the established clonal cell lines by sequencing to identify stretch of homozygosity. Parental cell line was heterozygous (12) for all of the SNPs. Red—homozygous for risk allele, green—homozygous for the non-risk allele, no fill—heterozygous (no edit), blue—homozygosity outside the LD block, yellow—deletion. The lead SNP is indicated in red. (B). CNV assay for identification of large deletions. Results of CNV assay using multiple probes in clonal cell lines. Results from the parental cell line was used as the calibrator for analysis. Y-axes represent the calculated copy number. Grey bars indicate a copy number of 1 suggestive of a hemizygous deletion. Assays were done in triplicate and the error bars indicate calculated copy number range.
Figure 4
Figure 4
Identification of clonal cell lines with hypomethylation at the KCNQ1OT1 promoter region resulting in downregulation of KCNQ1. (A). Heat map showing expression (logFC) of KCNQ1, CDKN1C, IGF2 and SLC22A18 in the clonal cell lines relative to expression in the parental cell line. Data is using RNA from a single passage. Arrows heads show cell lines with downregulation of KCNQ1. (B). Relative expression of KCNQ1, CDKN1C and KCNQ1OT1 in selected clonal cell lines. Clones sg3-C10 and sg5-C1 had hemizygous deletions in different alleles and of different size and clones sg3-C3 and sg3-C7 had edits resulting in homozygous non-risk alleles at the KCNQ1 locus. Relative expression was normalized to the expression of TBP. RNA from three different passages were used for the experiment. Error bars show SD and results were compared using t-test, * p < 0.05. (C). Layered H3K27Ac marks in 7 cell lines from ENCODE in the region captured by FR1 and FR2 used for bisulfite sequencing to analyze methylation at the KCNQ1OT1 promoter. (D). Average methylation across 49 CpG sites in the KCNQ1OT1 promoter region assessed by bisulphite sequencing. Two different regions were assessed, FR1 (23 CpG sites) and FR2 (26 CpG sites). Error bars show SD.
Figure 5
Figure 5
Stage specific differential expression of CDKN1C and H19 in cells with a 2.3 kb hemizygous deletion in KCNQ1 intron 15 that spans the four putative functional SNPs. (AD). Characterization of a clonal cell line with a 2.3 kb hemizygous deletion at the KCNQ1 locus. (A). Copy number assay (CNV) showing hemizygous deletion in sg3-C10 (deletion cell line). TR probes—CNV probes mapping to the CRISPR targeted region. UR probes—CNV probes mapping to the upstream region. Data shown is part of Figure 3B. (B). Figure showing the 2.3 kb deletion in the allele with the risk haplotype for the four putative functional SNPs at the KCNQ1 locus. (C). Confirmation of the hemizygous deletion by agarose gel electrophoresis of the PCR amplicon generated by long PCR using primers spanning the deletion. P = parental cell line, D = deletion cell line (sg3-C10). (D). Karyotyping by G-banding of the parental and deletion cell line. (E). Representative flow cytometry data of islet-like cells generated by differentiating the deletion cell line using differentiation protocol 2 showing staining for INS (C-peptide) and the beta cell transcription factor NKX6-1. IC—isotype control. Data also shown in Figure S4. (FH). Stage specific differential expression of CDKN1C and H19 during islet-like cell differentiation from hiPSCs. (F). Statistical significance and fold difference in the expression of 20 genes at the KCNQ1 locus in the cells with the deletion relative to the parental cells during days 0, 10, 13, 16, 18 and 27 of differentiation. The x-axis shows the fold difference in expression and the y-axis show the -log(p-value). The dashed horizontal line indicates a p = 0.05. Results are from four independent differentiations and expression was calculated relative to expression in the parental cells from experiment 1 from the respective days. Results were compared using t-test. (G,H). Fold change in the expression of CDKN1C and H19 during differentiation of the deletion cell line and the parental cell line to pancreatic islet-like cells relative to the expression in hiPSCs. Results are from four independent differentiations; the error bars show SD and results were compared using t-test. Expression was calculated relative to expression in parental hiPSC from experiment 1. * p < 0.05, ** p < 0.01, **** p < 0.0005.
Figure 6
Figure 6
Stage specific differential increase in INS gene expression in cells with the 2.3 kb hemizygous deletion (A). Expression of islet specific genes in day 27 islet-like cells generated from hiPSC with the deletion relative to expression in day 27 islet-like cells generated from the parental hiPSC. Results are from four independent differentiations and the error bars show SD. Expression was calculated relative to expression in islet-like cells generated from the parental hiPSC in experiment 1 and results were compared using t-test. (B,C). Fold increase in the expression of INS and GCG expression during differentiation of the deletion iPS cell line and the parental iPS cell line towards pancreatic islet-like cells relative to the expression in hiPSCs. Results are from four independent differentiations and the error bars show SD. Expression was calculated relative to expression in parental hiPSC from experiment 1 and results were compared using t-test. (D). Fold increase in INS and GCG expression during the endocrine progenitor stage (day 13 and 16) relative to expression in pancreatic progenitors (day 10) from the parental and deletion cell lines. (E). Flow cytometry analysis of day 27 islet-like cells. Results are from two independent differentiations and error bars show SD. * p < 0.05, ** p < 0.01.

References

    1. Morris A.P., Voight B.F., Teslovich T.M., Ferreira T., Segrè A.V., Steinthorsdottir V., Strawbridge R.J., Khan H., Grallert H., Mahajan A., et al. Large-scale association analysis provides insights into the genetic architecture and pathophysiology of type 2 diabetes. Nat. Genet. 2012;44:981–990. doi: 10.1038/ng.2383. - DOI - PMC - PubMed
    1. Spracklen C.N., Horikoshi M., Kim Y.J., Lin K., Bragg F., Moon S., Suzuki K., Tam C.H.T., Tabara Y., Kwak S.-H., et al. Identification of type 2 diabetes loci in 433,540 East Asian individuals. Nature. 2020;582:240–245. doi: 10.1038/s41586-020-2263-3. - DOI - PMC - PubMed
    1. Suzuki K., Akiyama M., Ishigaki K., Kanai M., Hosoe J., Shojima N., Hozawa A., Kadota A., Kuriki K., Naito M., et al. Identification of 28 new susceptibility loci for type 2 diabetes in the Japanese population. Nat. Genet. 2019;51:379–386. doi: 10.1038/s41588-018-0332-4. - DOI - PubMed
    1. Adeyemo A.A., Zaghloul N.A., Chen G., Doumatey A.P., Leitch C.C., Hostelley T.L., Nesmith J.E., Zhou J., Bentley A.R., Shriner D., et al. ZRANB3 is an African-specific type 2 diabetes locus associated with beta-cell mass and insulin response. Nat. Commun. 2019;10:3195. doi: 10.1038/s41467-019-10967-7. - DOI - PMC - PubMed
    1. Hanson R.L., Muller Y.L., Kobes S., Guo T., Bian L., Ossowski V., Wiedrich K., Sutherland J., Wiedrich C., Mahkee D., et al. A Genome-Wide Association Study in American Indians Implicates DNER as a Susceptibility Locus for Type 2 Diabetes. Diabetes. 2014;63:369–376. doi: 10.2337/db13-0416. - DOI - PMC - PubMed

Publication types

MeSH terms

Substances