. 2022 Apr 27;11(9):1478.
doi: 10.3390/cells11091478.

HSP90 Modulates T2R Bitter Taste Receptor Nitric Oxide Production and Innate Immune Responses in Human Airway Epithelial Cells and Macrophages

Affiliations

HSP90 Modulates T2R Bitter Taste Receptor Nitric Oxide Production and Innate Immune Responses in Human Airway Epithelial Cells and Macrophages

Ryan M Carey et al. Cells. .

Abstract

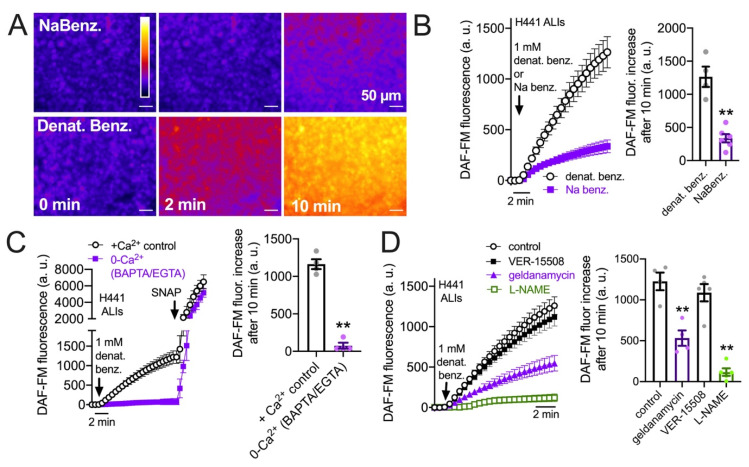
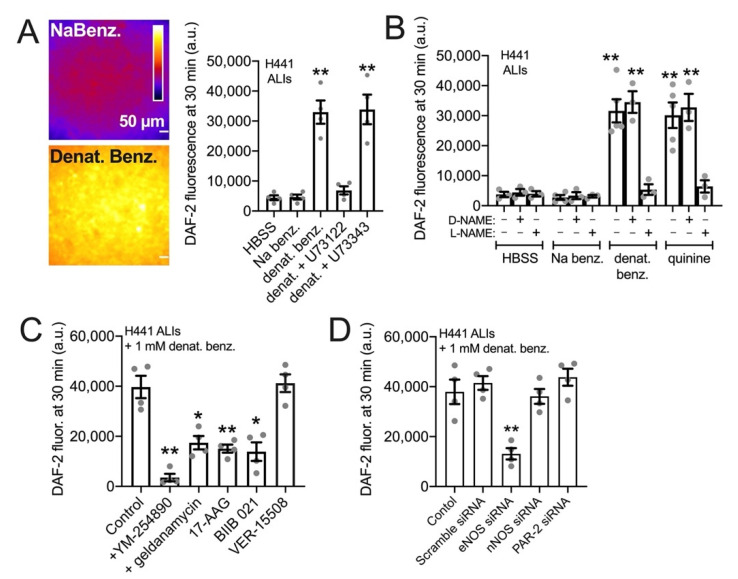
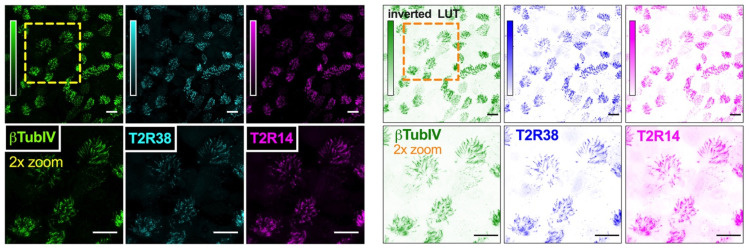
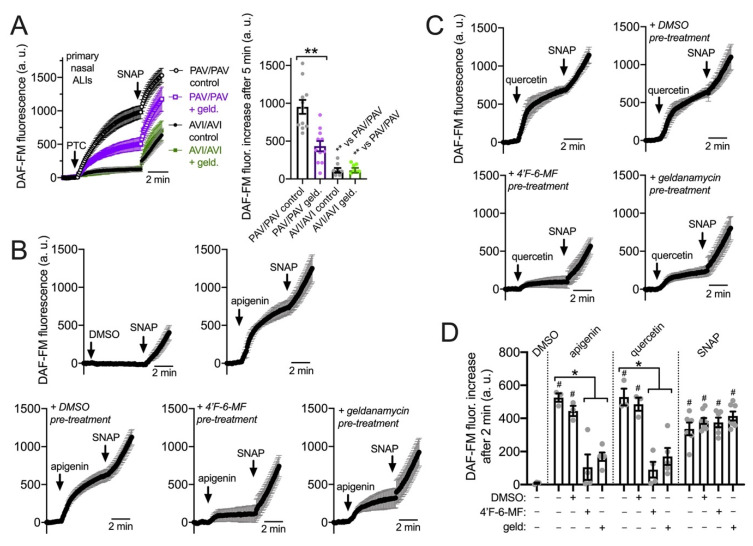
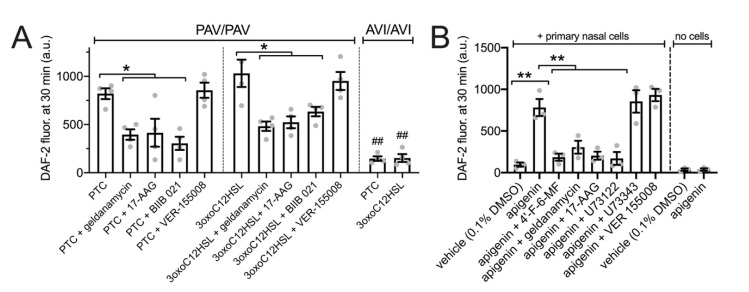
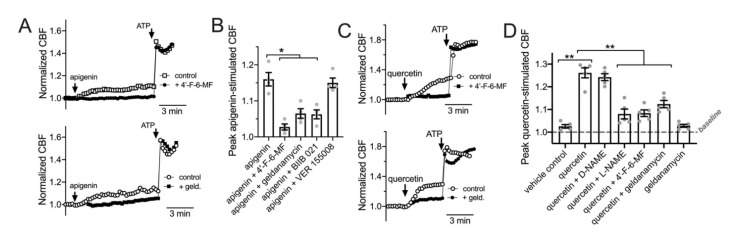
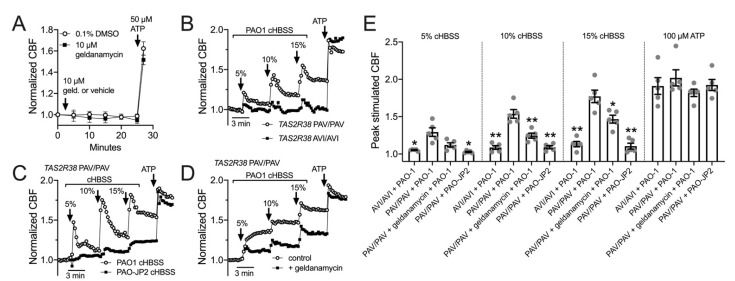
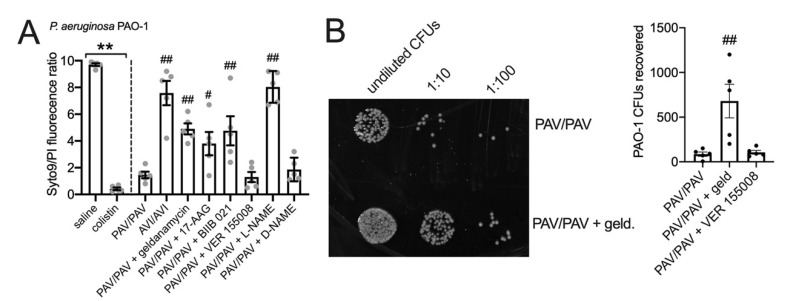
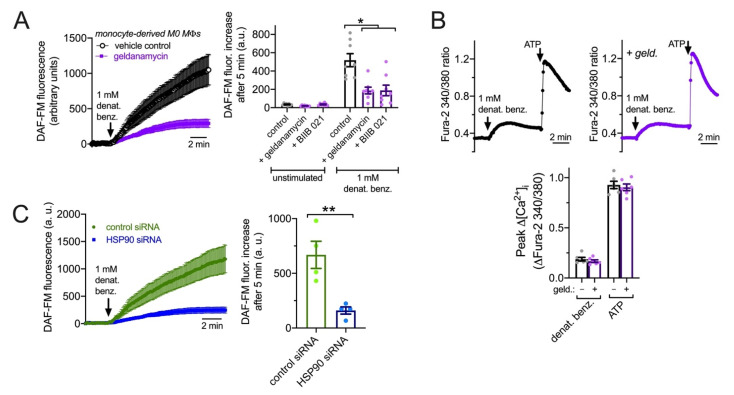
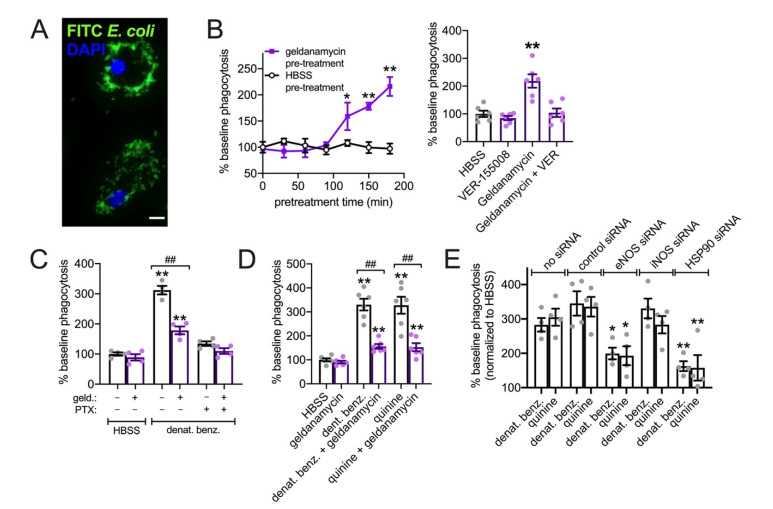
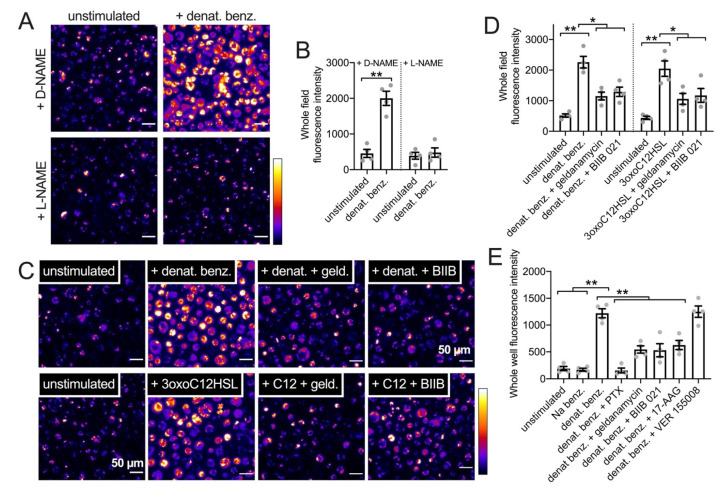
Bitter taste receptors (T2Rs) are G protein-coupled receptors (GPCRs) expressed in various cell types including ciliated airway epithelial cells and macrophages. T2Rs in these two innate immune cell types are activated by bitter products, including those secreted by Pseudomonas aeruginosa, leading to Ca2+-dependent activation of endothelial nitric oxide (NO) synthase (eNOS). NO enhances mucociliary clearance and has direct antibacterial effects in ciliated epithelial cells. NO also increases phagocytosis by macrophages. Using biochemistry and live-cell imaging, we explored the role of heat shock protein 90 (HSP90) in regulating T2R-dependent NO pathways in primary sinonasal epithelial cells, primary monocyte-derived macrophages, and a human bronchiolar cell line (H441). Immunofluorescence showed that H441 cells express eNOS and T2Rs and that the bitter agonist denatonium benzoate activates NO production in a Ca2+- and HSP90-dependent manner in cells grown either as submerged cultures or at the air-liquid interface. In primary sinonasal epithelial cells, we determined that HSP90 inhibition reduces T2R-stimulated NO production and ciliary beating, which likely limits pathogen clearance. In primary monocyte-derived macrophages, we found that HSP-90 is integral to T2R-stimulated NO production and phagocytosis of FITC-labeled Escherichia coli and pHrodo-Staphylococcus aureus. Our study demonstrates that HSP90 serves as an innate immune modulator by regulating NO production downstream of T2R signaling by augmenting eNOS activation without impairing upstream Ca2+ signaling. These findings suggest that HSP90 plays an important role in airway antibacterial innate immunity and may be an important target in airway diseases such as chronic rhinosinusitis, asthma, or cystic fibrosis.

Keywords: airway epithelium; bitter taste receptors; calcium; cilia; heat shock proteins; innate immunity; macrophages; nitric oxide; sinusitis.


Conflict of interest statement

The authors declare no conflict of interest. The funders had no role in the design of the study; in the collection, analyses, or interpretation of data; in the writing of the manuscript, or in the decision to publish the results.

Figures

Figure 1
Figure 1
HSP90 inhibition reduces T2R-stimulated intracellular NO production in H441 cells grown at the air–liquid interface (ALI). (A): Representative image of DAF-FM-loaded H441 ALIs stimulated for 10 min with 1 mM sodium benzoate (NaBenz.) or denatonium benzoate (denat benz.); fluorescence increased with denatonium benzoate but not sodium benzoate. (B): Average trace and bar graph (mean ± SEM) of four experiments as in (A). Significance determined by Student’s t-test; ** p < 0.01. (C): Average trace and bar graph (mean ± SEM of three experiments) showing response in cultures pre-loaded with BAPTA-AM and stimulated in the absence of extracellular Ca2+ (0-Ca2+o) vs. control cultures pre-incubated with 0.1% DMSO only and stimulated in the presence of extracellular Ca2+. (D): Denatonium-induced DAF-FM fluorescence increases in H441 ALIs were inhibited by pretreatment with geldanamycin or L-NAME but not HSP70 inhibitor VER-15508. Average trace and bar graph of results from four independent experiments are shown. Significance determined by one-way ANOVA with Dunnett’s post-test comparing all values to control (denatonium only); ** p < 0.01.
Figure 2
Figure 2
HSP90 inhibition reduces T2R-stimulated NO diffusion into the airway surface liquid (ASL) in H441 cells grown at the air–liquid interface (ALI) (A): Representative images and bar graph of 4 independent experiments of fluorescence at the apical plane of ALI when 100 µL of solution containing cell impermeable DAF-2 was placed on top (1.1 cm2 Transwell) either containing sodium benzoate (top) or denatonium benzoate (bottom). Cultures were either pretreated with 0.1% DMSO (vehicle control), 10 µM PLC inhibitor U73122, or 10 µM inactive analogue U73343 prior to the experiment. Significance determined by one-way ANOVA with Dunnett’s post-test comparing all values to HBSS only control. (B): Bar graph of experiments performed as in (A) but testing inhibition of denatonium-induced or quinine-induced ASL DAF-2 fluorescence ± NOS inhibitor L-NAME or inactive D-NAME (10 µM). Bar graph shows the mean ± SEM of 3–5 independent experiments imaged at identical conditions. Significance by one-way ANOVA with Bonferroni post-test comparing all values to respective HBSS control; ** p < 0.01. (C): Denatonium-stimulated H441 DAF-2 ASL fluorescence increases were reduced in the presence of GPCR signaling inhibitor YM254890 or HSP90 inhibitors geldanamycin, 17-AAG, or BIIB 021. HSP70 inhibitor VER-15508 had no effect. Bar graph shows the mean ± SEM of four independent experiments. Significance by one-way ANOVA with Dunnett’s post-test comparing all values to control (0.1% DMSO only); * p < 0.05 and ** p < 0.01. (D): H441s were treated with siRNA as described in the methods. ASL DAF-2 responses during denatonium stimulation were reduced by eNOS siRNA but not with scramble, nNOS, or PAR-2 siRNA. Bar graph shows the mean ± SEM of four independent experiments (separate siRNA transfections). Significance by one-way ANOVA with Dunnett’s post-test comparing all values to control; ** p < 0.01.
Figure 3
Figure 3
T2R bitter taste receptor expression in airway cell cilia. Representative images of cilia marker β-tubulin IV (green), T2R38 (cyan) and T2R14 (magenta) immunofluorescence in an apical confocal section of primary human sinonasal ALI. (Left) shows conventional look-up table (LUT) and (right) shows inverted LUT. Scale bar is 20 µm.
Figure 4
Figure 4
HSP90 inhibition reduces T2R-stimulated intracellular NO production in primary sinonasal epithelial cells grown at the air–liquid interface (ALI). (A): Intracellular DAF-FM increases were measured in response to T2R38-agonist PTC (1 mM) followed by NO donor SNAP (25 µM) as positive control. PTC stimulated NO production in ALIs from PAV/PAV (homozygous functional T2R38) but not AVI/AVI (homozygous non-functional T2R38) ALIs (nonfunctional T2R38) patients. Geldanamycin pretreatment inhibited the NO production in PAV/PAV ALIs. Trace and bar graph show the mean ± SEM of 8–10 experiments per condition using ALIs from 4–5 patients. Significance determined by one-way ANOVA with Tukey–Kramer post-test comparing all values; ** p < 0.01. (B): Traces of DAF-FM fluorescence in PAV/AVI (heterozygous T2R38) cultures stimulated with T2R14/39 agonist apigenin (100 µM) shown with 0.1% DMSO vehicle control. Pretreatment with T2R14/39 antagonist 4′-fluoro-6-methoxyflavanone (4′-F-6-MF) or HSP90 inhibitor geldanamycin but not 0.1% DMSO (inhibitor vehicle control) reduced apigenin-induced but not SNAP-induced DAF-FM fluorescence increases. (C): Traces of DAF-FM fluorescence in PAV/AVI (heterozygous T2R38) cultures stimulated with T2R14 agonist quercetin (50 µM). Pretreatment with T2R14/39 antagonist 4′-fluoro-6-methoxyflavanone (4′-F-6-MF) or HSP90 inhibitor geldanamycin but not 0.1% DMSO (inhibitor vehicle control) reduced quercetin-induced but not SNAP-induced DAF-FM fluorescence increases. (D): Bar graph of intracellular DAF-FM fluorescence increases after 2 min stimulation from experiments as in (C,D). Stimulation (DMSO vehicle control, apigenin, quercetin, or SNAP) listed on top and pretreatment (DMSO vehicle control, 4′-F-6-MF, or geldanamycin) listed on the bottom. Each data point is an independent experiment (n = 4–8 per condition). Significance by Bonferroni post-test; * p < 0.05 vs. bracketed bars; # p < 0.05 vs. DMSO alone.
Figure 5
Figure 5
HSP90 inhibition reduces T2R-stimulated NO diffusion into the airway surface liquid (ASL) in primary sinonasal epithelial cells grown at the air–liquid interface (ALI) Experiments were performed as in Figure 2 to measure NO diffusion into the ASL but with primary nasal ALIs. (A): PTC (500 µM) or 3oxoC12HSL (100 µM) stimulated extracellular DAF-2 fluorescence in PAV/PAV and AVI/AVI cultures, as indicated. PAV/PAV cultures were also pretreated with HSP90 inhibitors geldanamycin, 17-AAG, or BIIB 021 or HSP70 inhibitor VER-155008. (B): shows experiments with apigenin ± 4′-F-6-MF, geldanamycin, 17-AAG, or PLC inhibitor U73122 and inactive analogue U73343. Control Transwells containing no cells were similarly incubated with vehicle only or apigenin to test for any cell-independent reaction of apigenin with DAF-2. Significance by one way ANOVA with Bonferroni post-test; * p < 0.05 vs. bracketed bars; ** p < 0.01 vs. bracketed bars; ## p < 0.05 for the same condition in PAV/PAV vs AVI/AVI cultures.
Figure 6
Figure 6
HSP90 inhibition reduces T2R-stimulated ciliary beating in primary sinonasal epithelial cells. (A): Left shows representative normalized CBF responses (representative experiments shown) to T2R14/39 agonist apigenin in human primary sinonasal ALIs ± T2R14/39 inhibitor 4′-fluoro-6-methoxyflavanone. Right shows normalized CBF responses (representative experiments shown) to apigenin ± geldanamycin (10 µM; 5 min pretreatment). Mean baseline CBF was not with vehicle or 4′-fluoro-6-methoxyflavanone pretreatment (7.5 ± 1.1 Hz or 8.2 ± 0.9 Hz, respectively; not significant by Students’ t-test). Mean baseline CBF was also not different before or after vehicle or geldanamycin pretreatment (6.9 ± 1.7 Hz or 7.9 ± 1.2 Hz, respectively; not significant by Students’ t-test). (B): Bar graph of the mean ± SEM of CBF responses from five independent experiments as shown in (A) using ALIs from four different patients. Significance determined by one-way ANOVA with Bonferroni post-test; * p < 0.05. (C): Left shows representative normalized CBF responses (representative experiments shown) to T2R14/39 agonist quercetin in human ALIs ± T2R14/39 inhibitor 4′-fluoro-6-methoxyflavanone. Mean baseline CBF was not with vehicle or 4′-fluoro-6-methoxyflavanone pretreatment (7.3 ± 1.2 Hz or 7.9 ± 0.6 Hz, respectively; not significant by Students’ t-test). Right shows normalized CBF responses (representative experiments shown) to quercetin ± geldanamycin (10 µM; 5 min pretreatment). Mean baseline CBF was not different before or after vehicle or geldanamycin pretreatment (7.4 ± 1.3 Hz or 7.0 ± 0.9 Hz, respectively; not significant by Students’ t-test). (D): Bar graph of the mean ± SEM of CBF responses from five independent experiments as shown in C using ALIs from five different patients. Significance determined by one-way ANOVA with Bonferroni post-test; ** p < 0.01.
Figure 7
Figure 7
HSP90 inhibition reduces epithelial ciliary response to P. aeruginosa conditioned medium. (A): Graph shows real-time measurement of CBF (mean ± SEM of six independent experiments using ALIs from three patients) during prolonged geldanamycin treatment, followed by stimulation with purinergic agonist ATP. (B): Primary nasal ALIs genotyped for functional T2R38 (TAS2R38 PAV/PAV) or non-functional T2R38 (TAS2R38 AVI/AVI) were stimulated with diluted HBSS in which P. aeruginosa PAO-1 had been incubated overnight (conditioned HBSS; cHBSS, diluted with unconditioned HBSS). Peak CBF responses to PAO-1 cHBSS were greater in PAV/PAV cells vs. AVI/AVI cells. Representative trace shown from five experiments using cultures from separate individual patients. (C): PAV/PAV cells were stimulated with cHBSS from PAO-1 or PAO-JP2, which lacks the ability to produce AHLs. PAO-1 cHBSS stimulated CBF increases that were greater than CBF increases observed with PAO-JP2 cHBSS. Representative trace shown from five experiments using cultures from separate individual patients. (D): PAV/PAV cells were stimulated with PAO-1 cHBSS ± geldanamycin pretreatment. Representative trace shown from five experiments using cultures from separate individual patients. (E): Bar graph showing peak CBF (mean ± SEM with individual data points showing individual experiments) observed from experiments as in F-H. Asterisks represent significance compared with PAV/PAV + PAO-1 cHBSS at each individual concentration, determined by Sidak’s multiple comparison test; * p < 0.05 and ** p < 0.01.
Figure 8
Figure 8
HSP90 inhibition reduces nasal epithelial bacterial killing mediated by T2Rs and NO. P. aeruginosa PAO-1 bacteria were incubated with nasal ALI cultures as described in the methods. (A): Bar graph showing live (Syto9)/dead (propidium iodide [PI]) staining quantified by fluorescence plate reader. First two bars represent bacteria incubated in the absence of nasal cells treated with saline only or saline + colistin. This illustrates max (saline) and min (colistin) live/dead ratios. Significance by one way ANOVA with Bonferroni post-test; ** p < 0.01 between bracketed groups; # p < 0.05 and ## p < 0.01 vs. PAV/PAV cultures with no inhibitor. (B): Representative image (left) and bar graph (right) showing CFU counts from experiments as shown in (A). HSP90 inhibitor geldanamycin reduced bacterial killing (increased CFUs) while HSP70 inhibitor VER 155008 did not. Significance by one-way ANOVA with Dunnett’s post test comparing all values to PAV/PAV control (no inhibitor); ## p < 0.01 vs. PAV/PAV control.
Figure 9
Figure 9
HSP90 inhibition reduces T2R-stimulated NO production in primary human M0 MΦs. (A): DAF-FM-loaded MΦs exhibited increases in fluorescence in response to 1 mM denatonium benzoate that were strongly inhibited by geldanamycin. Left shows average traces and right shows bar graphs (mean ± SEM) from eight independent experiments using MΦs from two donors. DAF-FM fluorescence increase was also inhibited by BIIB 021. Control = denatonium benzoate after pretreatment with 0.1% DMSO. Significance by one way ANOVA with Bonferroni posttest; * p < 0.05. (B): Low-level Ca2+ responses to denatonium benzoate were not affected by geldanamycin. Top shows representative traces in the absence or presence of 1 µM geldanamycin. Bottom shows bar graph of six independent experiments using MΦs from three different donors. Response to purinergic agonist ATP shown as control. (C): NO production in MΦs treated with HSP90 or control non-targeting siRNAs. Left shows representative traces and right shows bar graph of data from four independent experiments per condition. Significance by Student’s t-test; ** p < 0.01.
Figure 10
Figure 10
HSP90 inhibition reduces T2R-stimulated FITC-E. coli phagocytosis in primary human M0 MΦs. (A): Representative image of MΦs with phagocytosed FITC-labeled E. coli. (B): Left shows time course of phagocytosis responses during 30 min incubation in HBSS as described in the methods after pretreatment with geldanamycin or HBSS for times indicated on the y-axis. Each data point is the mean ± SEM of three independent experiments using MΦs from three different donors. Right shows separate experiments of baseline phagocytosis over 30 min (HBSS only) of FITC-E. coli after 2 h pretreatment with HBSS only (containing 0.1% DMSO as vehicle control), 1 µM VER-15508, 1 µM geldanamycin, or geldanamycin plus VER-15508. Significance determined by one-way ANOVA with Dunnett’s post-test comparing values to HBSS pretreatment; * p < 0.05, ** p < 0.01. Bar graph shows the mean ± SEM of six experiments using MΦs from three donors. (C): Stimulated 30 min phagocytosis of FITC-E. coli (HBSS only control or 1 mM denat. benz. ± pertussis toxin [PTX]) was measured after pre-incubation with HBSS + 0.1% DMSO or 1 µM geldanamycin. PTX and geldanamycin both inhibited denatonium-induced phagocytosis. Significance determined by one-way ANOVA with Bonferroni post-test; ** p < 0.01 vs. HBSS control and ## p < 0.01 vs. bracketed groups. (D): Geldanamycin reduced phagocytosis increases observed with both denatonium and quinine. Bar graph shows the mean ± SEM of six independent experiments using cells from six different individual patients. Significance by one way ANOVA with Tukey–Kramer post-test comparing all bars; ** p < 0.01 vs. HBSS alone; ## p < 0.01 vs. bracketed bar. (E): Assays were carried out in MΦs previously treated with siRNAs directed against eNOS, iNOS, HSP90, or non-targeting control sequences. Bar graph shows increase in phagocytosis relative to HBSS in the same macrophage background over four independent experiments. Significance compared with no siRNA control using one-way ANOVA with Bonferroni post-test and pairwise comparisons; * p < 0.05 and ** p < 0.01.
Figure 11
Figure 11
HSP90 inhibition reduces T2R-stimulated pHrodo-S. aureus phagocytic responses in primary human M0 MΦs. (A): Representative images of pHrodo-labeled S. aureus phagocytosis in primary human MΦs ± denatonium benzoate (1 mM) stimulation after D-NAME or L-NAME pretreatment (10 µM; 45 min). (B): Bar graph of pHrodo-S. aureus fluorescence after experiments as in A. Significance by Bonferroni post-test with paired comparisons; ** p < 0.01. (C): Representative images of pHrodo-labeled S. aureus phagocytosis in primary human MΦs ± denatonium benzoate (1 mM) or 3oxoC12HSL (100 µM) after no-pretreatment (0.1% DMSO only as vehicle control)) or pretreatment with HSP90 inhibitors geldanamycin or BIIB 021 (pretreatment as in Figure 8). (D): Bar graph of pHrodo-S. aureus phagocytosis during stimulation with HBSS only (unstimulated control), 1 mM denatonium benzoate, or 100 µM 3oxoC12HSL ± geldanamycin or BIIB 021 (pretreatment as in Figure 9). Significance by one-way ANOVA with Bonferroni post-test; * p < 0.05 or ** p < 0.01. (E): Bar graph of pHrodo-S. aureus phagocytosis during stimulation with HBSS only (unstimulated control) or 1 mM denatonium benzoate ± pertussis toxin (PTX), geldanamycin, BIIB 021, 17-AAG, or VER 15508. PTX (500 ng/mL) pretreatment was 18 h. MΦs were pretreated with other inhibitors as in Figure 9. Significance by one-way ANOVA with Bonferroni post-test; ** p < 0.01.

Similar articles

Cited by

References

    1. Li F. Taste perception: From the tongue to the testis. Mol. Hum. Reprod. 2013;19:349–360. doi: 10.1093/molehr/gat009. - DOI - PubMed
    1. Yamamoto K., Ishimaru Y. Oral and extra-oral taste perception. Semin. Cell Dev. Biol. 2013;24:240–246. doi: 10.1016/j.semcdb.2012.08.005. - DOI - PubMed
    1. An S.S., Liggett S.B. Taste and smell GPCRs in the lung: Evidence for a previously unrecognized widespread chemosensory system. Cell. Signal. 2017;41:82–88. doi: 10.1016/j.cellsig.2017.02.002. - DOI - PMC - PubMed
    1. Shah A.S., Ben-Shahar Y., Moninger T.O., Kline J.N., Welsh M.J. Motile cilia of human airway epithelia are chemosensory. Science. 2009;325:1131–1134. doi: 10.1126/science.1173869. - DOI - PMC - PubMed
    1. Carey R.M., Lee R.J. Taste Receptors in Upper Airway Innate Immunity. Nutrients. 2019;11:2017. doi: 10.3390/nu11092017. - DOI - PMC - PubMed

Publication types

MeSH terms

LinkOut - more resources