. 2022 May 8;11(9):1583.
doi: 10.3390/cells11091583.

An Ex Vivo 3D Tumor Microenvironment-Mimicry Culture to Study TAM Modulation of Cancer Immunotherapy

Affiliations

An Ex Vivo 3D Tumor Microenvironment-Mimicry Culture to Study TAM Modulation of Cancer Immunotherapy

Yan-Ruide Li et al. Cells. .

Abstract

Tumor-associated macrophages (TAMs) accumulate in the solid tumor microenvironment (TME) and have been shown to promote tumor growth and dampen antitumor immune responses. TAM-mediated suppression of T-cell antitumor reactivity is considered to be a major obstacle for many immunotherapies, including immune checkpoint blockade and adoptive T/CAR-T-cell therapies. An ex vivo culture system closely mimicking the TME can greatly facilitate the study of cancer immunotherapies. Here, we report the development of a 3D TME-mimicry culture that is comprised of the three major components of a human TME, including human tumor cells, TAMs, and tumor antigen-specific T cells. This TME-mimicry culture can readout the TAM-mediated suppression of T-cell antitumor reactivity, and therefore can be used to study TAM modulation of T-cell-based cancer immunotherapy. As a proof-of-principle, the studies of a PD-1/PD-L1 blockade therapy and a MAO-A blockade therapy were performed and validated.

Keywords: CAR-engineered T (CAR-T) cell; cancer immunotherapy; checkpoint inhibitor blockade; chimeric antigen receptor (CAR); ex vivo 3D TME-mimicry culture; monoamine oxidase A (MAO-A) blockade; tumor microenvironment (TME); tumor-associated macrophage (TAM).


Conflict of interest statement

L.Y. is a scientific advisor to AlzChem and Amberstone Biosciences, and a co-founder, stockholder, and advisory board member of Appia Bio. None of the declared companies contributed to or directed any of the research reported in this article. The remaining authors declare no competing interest.

Figures

Figure 1
Figure 1
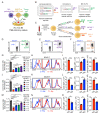
Generation and validation of human monocyte-derived M2-polarized immunosuppressive macrophages. (A) Diagram showing the human monocyte-derived M2 macrophage culture and polarization. M-CSF, macrophage colony-stimulating factor; MDM, monocyte-derived macrophage; Mφ, macrophage. (B) Fluorescence-activated cell sorting (FACS) detection of CD11b and CD14 on M2-polarized macrophages. Healthy donor peripheral blood mononuclear cells (PBMCs) were included as a staining control. (C) FACS detection of surface markers on M2-polarized macrophages. Monocytes were included as a control. (DJ) In vitro mixed Mφ/T-cell reaction assay to study M2 macrophage-mediated T-cell suppression. (D) Experimental design. 1 × 10⁵ PBMCs were cultured in the assay. (E) PBMC-T-cell growth curve (n = 3). (F) FACS detection of surface marker (CD25) and intracellular cytotoxic molecules (Perforin and Granzyme B) of CD4+ and CD8+ T cells. (G) Quantification of F (n = 3). (H) ELISA analyses of cytokine (IFN-γ and TNF-α) production in the mixed reaction assay at day 3 (n = 3). (I) FACS analyses of PD-1 on CD4+ and CD8+ T cells (n = 3). (J) FACS analyses of PD-L1 on M2 macrophages (n = 3). Representative of 3 (DJ) and > 5 (AC) experiments. Data are presented as the mean ± SEM. * p < 0.05, ** p < 0.01, *** p < 0.001, **** p < 0.0001, by Student’s t test.
Figure 2
Figure 2
Validation of immune modulatory reagents on antagonizing M2 macrophage-mediated immunosuppression. (AE) Study the effect of anti-PD-L1 antibody that blocks macrophage-T-cell inhibitory interaction. (A) Experimental design. 1 × 10⁵ PBMCs were cultured in the assay. (B) CD4+ PBMC-T-cell growth curve (n = 3). (C) CD8+ PBMC-T-cell growth curve (n = 3). (D,E) ELISA analyses of IFN-γ (D) and TNF-α (E) production in the mixed reaction assay at day 3 (n = 3). (FK) Study the effect of MAO-A inhibitor phenelzine that reprograms M2 macrophage polarization. (F) Experimental design. About 1 × 10⁵ PBMCs were cultured in the assay. (G) FACS detection of CD206, PD-L1, and PD-L2 on phenelzine-treated or non-treated M2-polarized macrophages. Phe, phenelzine. (H) CD4+ PBMC-T-cell growth curve (n = 3). (I) CD8+ PBMC-T-cell growth curve (n = 3). (J,K) ELISA analyses of IFN-γ (J) and TNF-α (K) production in the mixed reaction assay at day 3 (n = 3). Representative of three experiments. Data are presented as the mean ± SEM. ns, not significant, *** p < 0.001, **** p < 0.0001, by one-way ANOVA.
Figure 3
Figure 3
Development of an ex vivo 3D TME-mimicry culture to study TAM modulation of T-cell antitumor reactivity. (A) Diagram of an ex vivo 3D TME-mimicry culture. Three human tumor cell lines were studied: MM.1S (multiple myeloma), OVCAR3 (ovarian), and A375 (melanoma). (B) Schematics showing the engineered MM.1S-FG, OVCAR3-FG, and A375-A2-ESO-FG cell lines. Fluc, firefly luciferase; EGFP, enhanced green fluorescent protein; FG, Fluc-EGFP; F2A, foot-and-mouth disease virus 2A; RFP, red fluorescent protein; NY-ESO-1, New York esophageal squamous cell carcinoma-1; ESOp, ESO peptide; IRES, internal ribosome entry site; HLA, human leukocyte antigen. (CF) Generation of BCMA CAR-engineered T (BCAR-T), mesothelin CAR-engineered T (MCAR-T), and HLA-A2-restricted, NY-ESO-1 tumor antigen-specific human CD8 TCR-engineered T (ESO-T) cells. (C) Experimental design. (DF) FACS detection of BCAR on BCAR-T cells (D), MCAR on MCAR-T cells (E), and ESO-TCR on ESO-T cells (F). Human T cells that received mock transduction were included as a staining control (denoted as Mock-T). (GO) TAM modulation of T-cell antitumor reactivity. (G) Tumor killing data of MM.1S-FG by BCAR-T cells at 48 h (n = 3). (H) FACS detection of surface markers (CD25 and CD62L) and intracellular cytotoxic molecule (Granzyme B) of BCAR-T cells (I) Quantification of H (n = 3). (J) Tumor killing data of OVCAR3-FG by MCAR-T cells at 48 h (n = 3). (H) FACS detection of surface markers and intracellular cytotoxic molecule by MCAR-T cells (L) Quantification of K (n = 3). (M) Tumor killing data of A375-A2-ESO-FG by ESO-T cells at 48 h (n = 3). (N) FACS detection of surface markers and intracellular cytotoxic molecule by ESO-T cells. (O) Quantification of N (n = 3). Representative of three experiments. Data are presented as the mean ± SEM. * p < 0.05, ** p < 0.01, *** p < 0.001, **** p < 0.0001, by Student’s t test (I,L,O), or by one-way ANOVA (G,J,M).
Figure 4
Figure 4
Application of the ex vivo 3D TME-mimicry culture: studying the PD-1/PD-L1 blockade therapy. (A) Experimental design. OVCAR-3-FG and MCAR-T cells were studied. (B) Tumor killing data at 48 h (n = 3). (CE) FACS analyses of intracellular cytotoxicity molecule Granzyme B (C), and surface marker CD25 (D) and CD62L (E) of MCAR-T cells (n = 3). Representative of three experiments. Data are presented as the mean ± SEM. ns, not significant, ** p < 0.01, *** p < 0.001, **** p < 0.0001, by one-way ANOVA.
Figure 5
Figure 5
Application of the ex vivo 3D TME-mimicry culture: studying the MAO-A blockade therapy. (A) Experimental design. OVCAR-3-FG and MCAR-T cells were studied. (B) Tumor killing data at 48 h (n = 3). (CE) FACS analyses of intracellular cytotoxicity molecule Granzyme B (C), and surface marker CD25 (D) and CD62L (E) of MCAR-T cells (n = 3). Representative of three experiments. Data are presented as the mean ± SEM. ns, not significant, * p < 0.05, ** p < 0.01, *** p < 0.001, **** p < 0.0001, by one-way ANOVA.

References

    1. Chen Y., Song Y., Du W., Gong L., Chang H., Zou Z. Tumor-associated macrophages: An accomplice in solid tumor progression. J. Biomed. Sci. 2019;26:78. doi: 10.1186/s12929-019-0568-z. - DOI - PMC - PubMed
    1. Wu K., Lin K., Li X., Yuan X., Xu P., Ni P., Xu D. Redefining Tumor-Associated Macrophage Subpopulations and Functions in the Tumor Microenvironment. Front. Immunol. 2020;11:1731. doi: 10.3389/fimmu.2020.01731. - DOI - PMC - PubMed
    1. Lopez-Yrigoyen M., Cassetta L., Pollard J.W. Macrophage targeting in cancer. Ann. N. Y. Acad. Sci. 2021;1499:18–41. doi: 10.1111/nyas.14377. - DOI - PubMed
    1. Choi J., Gyamfi J., Jang H., Koo J.S. The role of tumor-associated macrophage in breast cancer biology. Histol. Histopathol. 2018;33:133–145. doi: 10.14670/HH-11-916. - DOI - PubMed
    1. Yahaya M.A.F., Lila M.A.M., Ismail S., Zainol M., Afizan N.A.R.N.M. Tumour-Associated Macrophages (TAMs) in Colon Cancer and How to Reeducate Them. J. Immunol. Res. 2019;2019:2368249. doi: 10.1155/2019/2368249. - DOI - PMC - PubMed

Publication types

Substances