. 2022 Apr 29;12(9):1517.
doi: 10.3390/nano12091517.

Intracellular Trafficking and Distribution of Cd and InP Quantum Dots in HeLa and ML-1 Thyroid Cancer Cells

Affiliations

Intracellular Trafficking and Distribution of Cd and InP Quantum Dots in HeLa and ML-1 Thyroid Cancer Cells

Min Zhang et al. Nanomaterials (Basel). .

Abstract

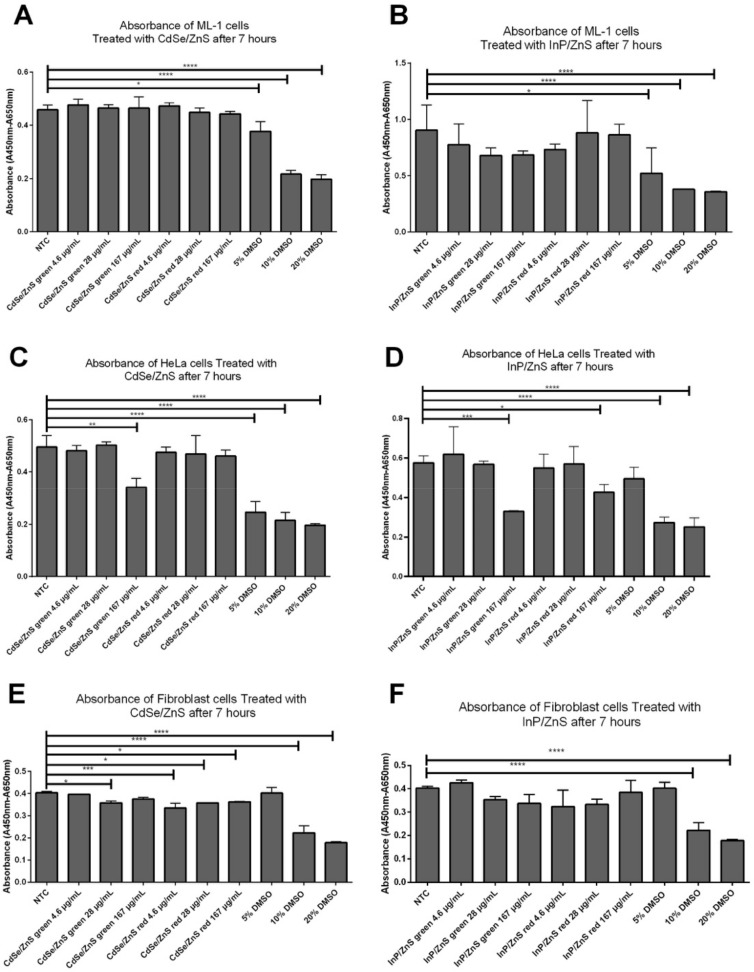
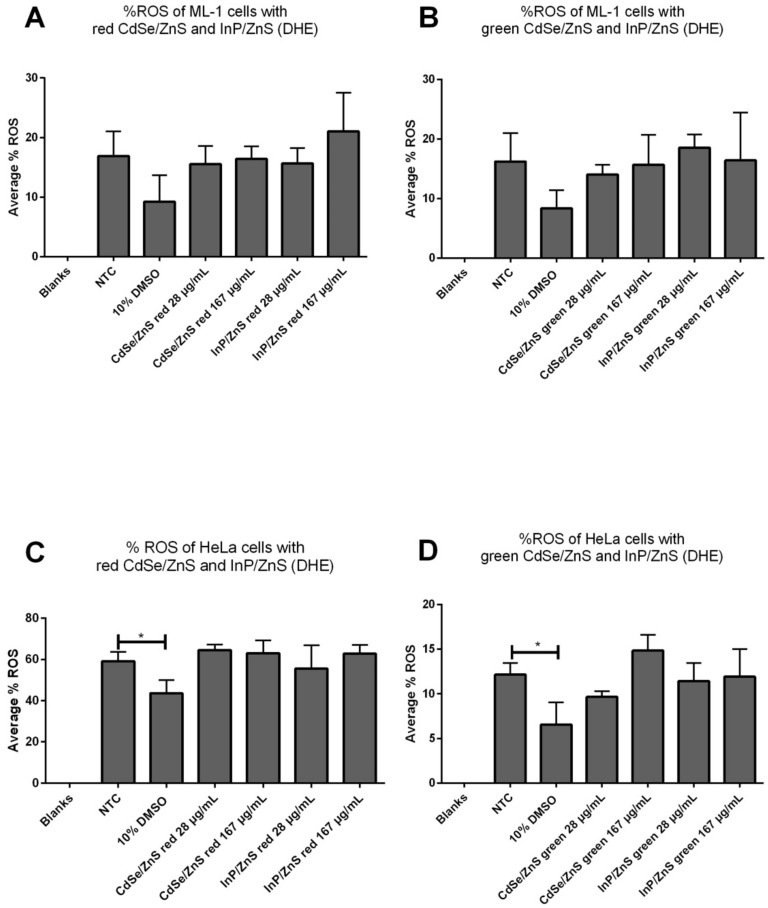
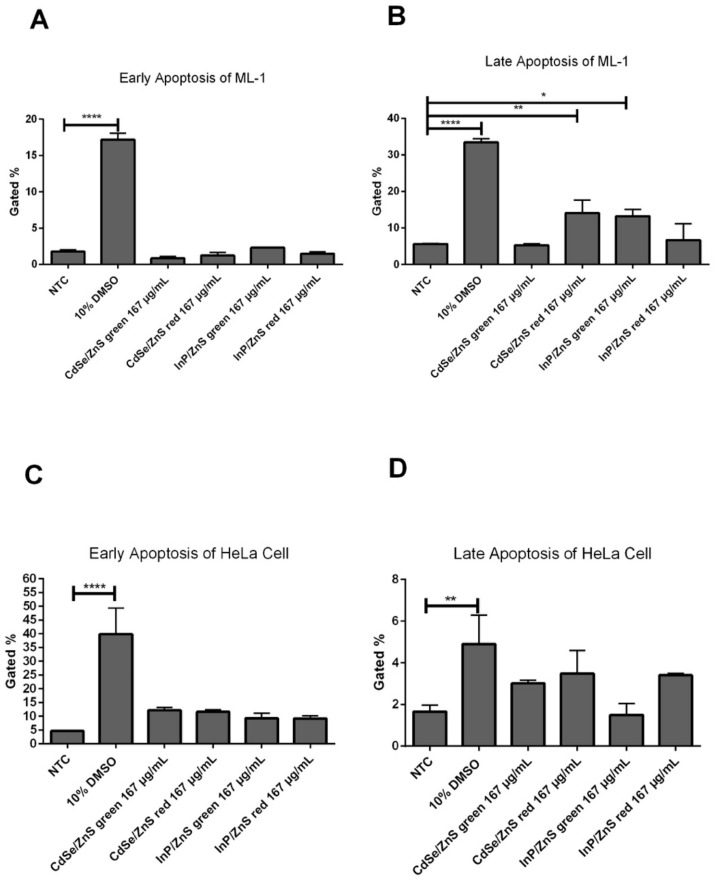
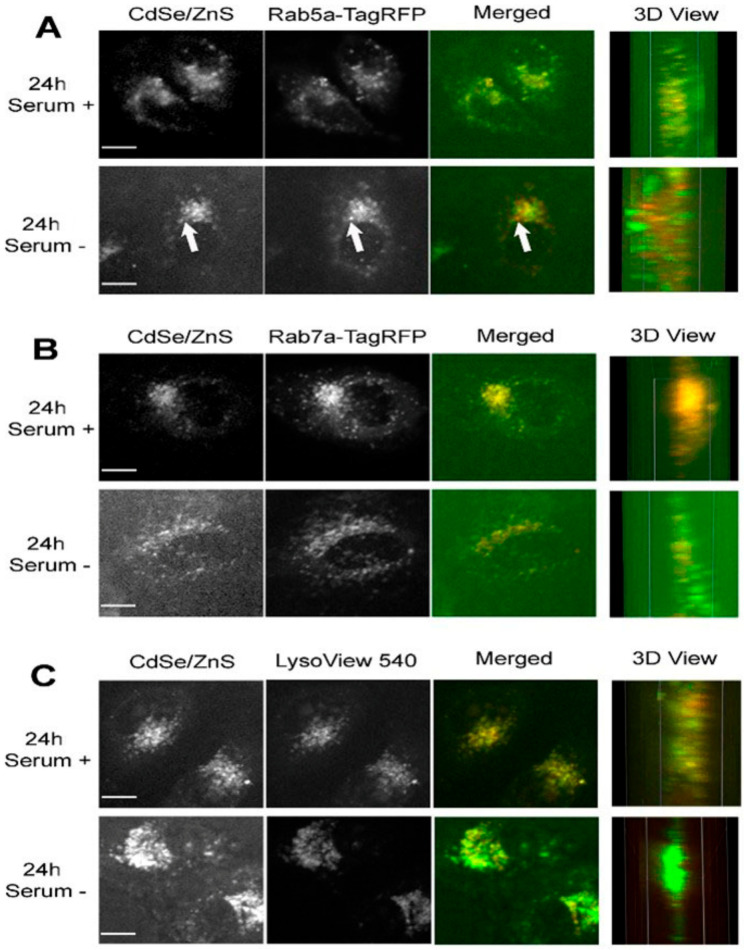
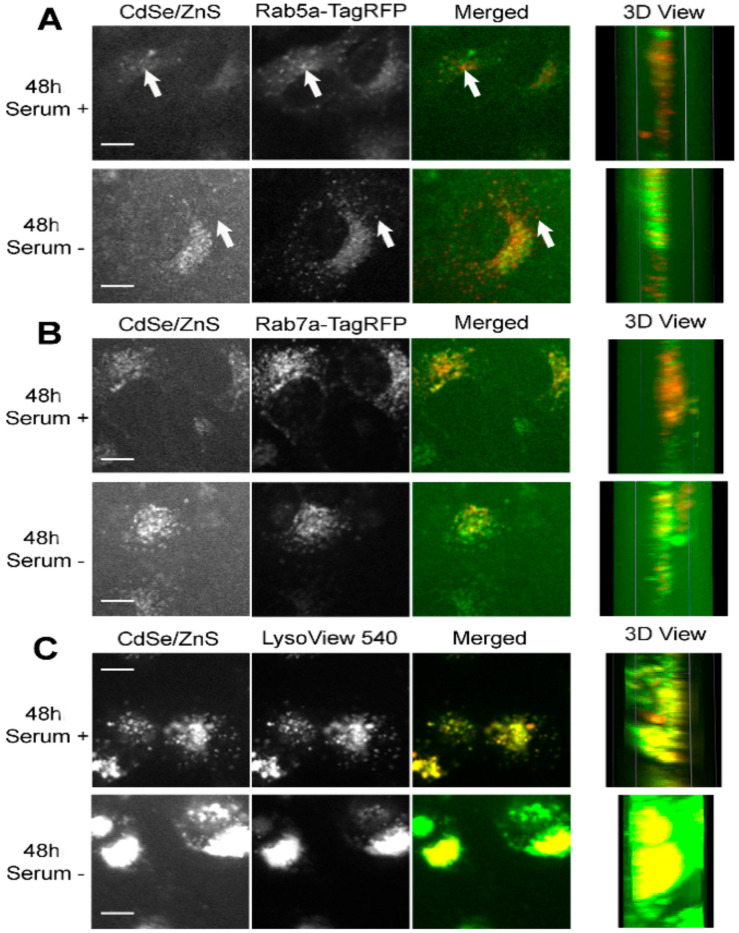
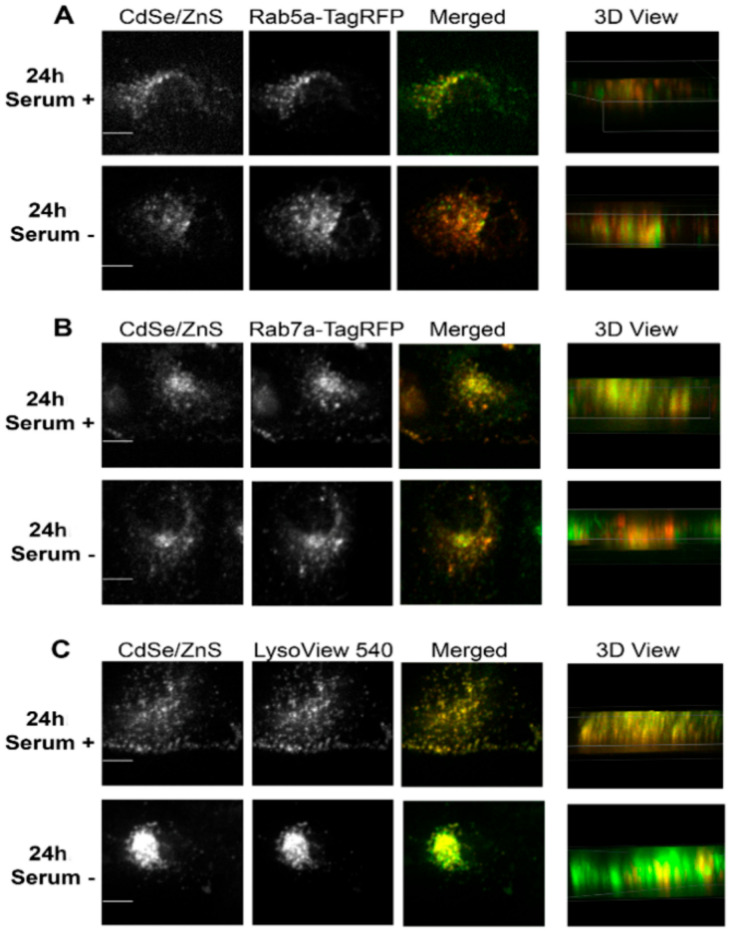
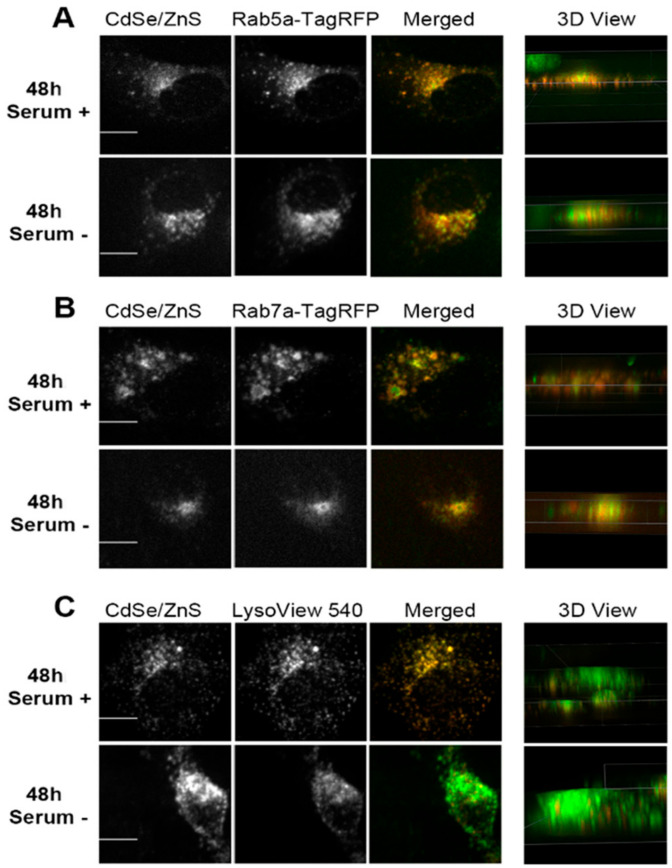
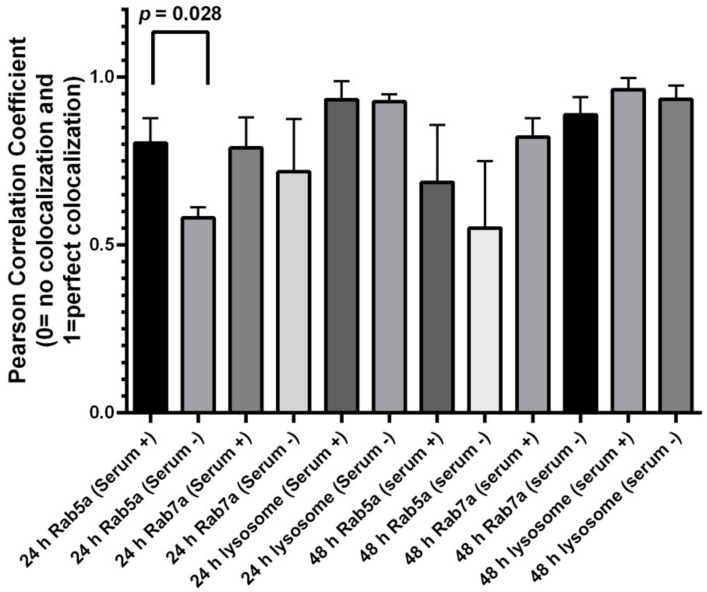
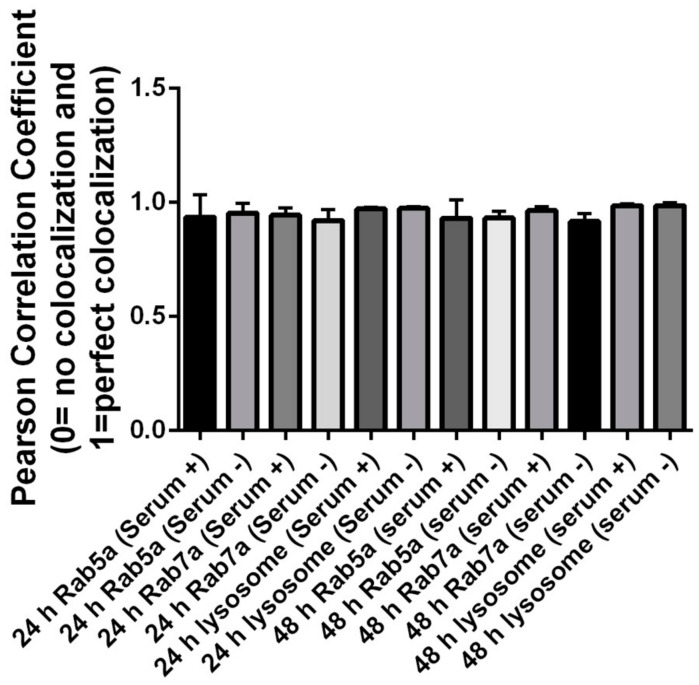
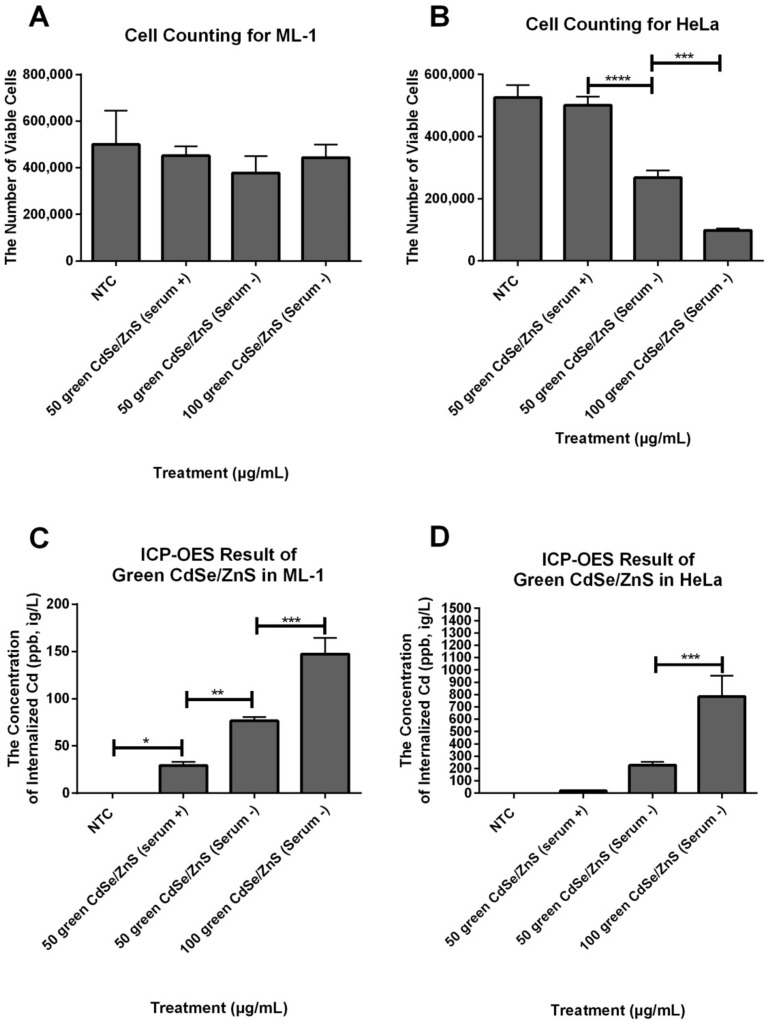
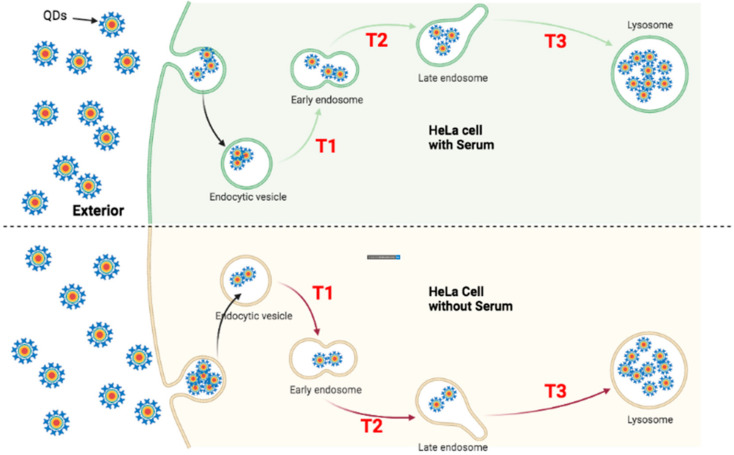
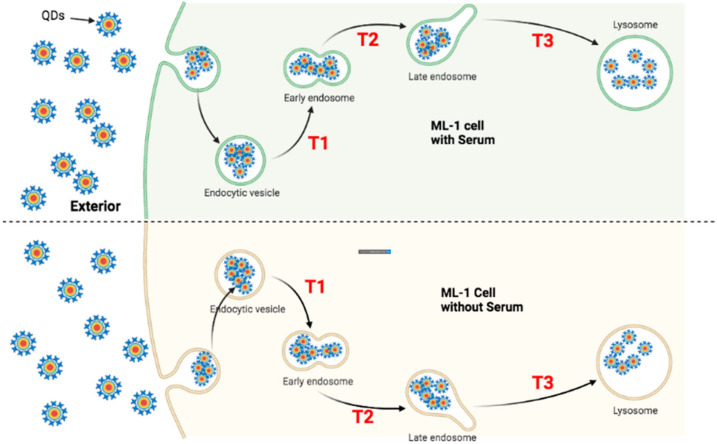
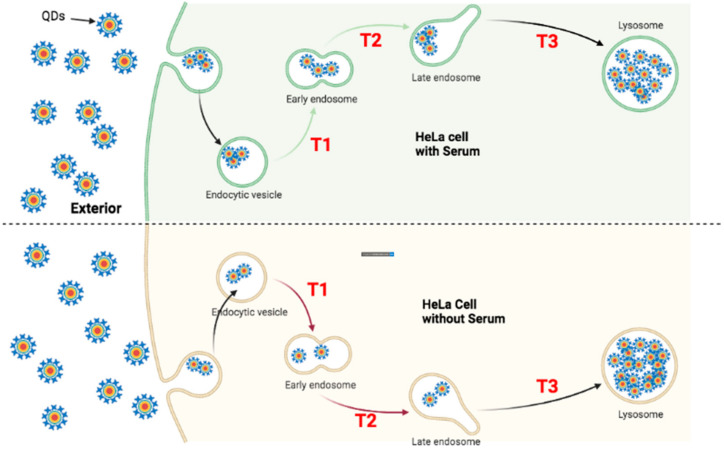
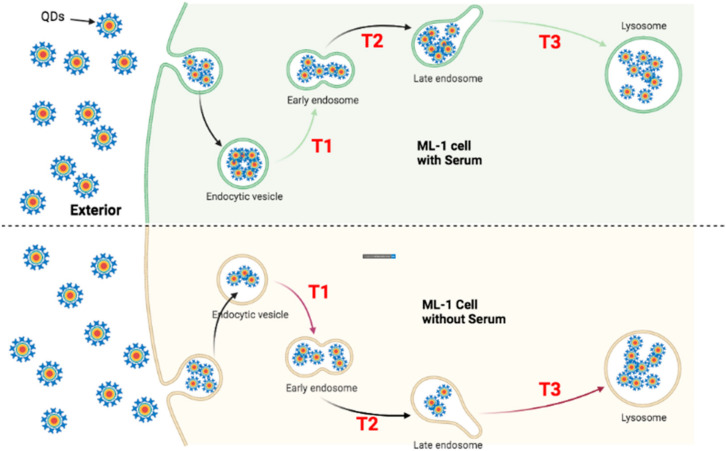
The study of the interaction of engineered nanoparticles, including quantum dots (QDs), with cellular constituents and the kinetics of their localization and transport, has provided new insights into their biological consequences in cancers and for the development of effective cancer therapies. The present study aims to elucidate the toxicity and intracellular transport kinetics of CdSe/ZnS and InP/ZnS QDs in late-stage ML-1 thyroid cancer using well-tested HeLa as a control. Our XTT (2,3-bis-(2-methoxy-4-nitro-5-sulfophenyl)-2H-tetrazolium-5-carboxanilide) viability assay (Cell Proliferation Kit II) showed that ML-1 cells and non-cancerous mouse fibroblast cells exhibit no viability defect in response to these QDs, whereas HeLa cell viability decreases. These results suggest that HeLa cells are more sensitive to the QDs compared to ML-1 cells. To test the possibility that transporting rates of QDs are different between HeLa and ML-1 cells, we performed a QD subcellular localization assay by determining Pearson's Coefficient values and found that HeLa cells showed faster QDs transporting towards the lysosome. Consistently, the ICP-OES test showed the uptake of CdSe/ZnS QDs in HeLa cells was significantly higher than in ML-1 cells. Together, we conclude that high levels of toxicity in HeLa are positively correlated with the traffic rate of QDs in the treated cells.

Keywords: CdSe/ZnS; HeLa; InP/ZnS; ML-1; cancer; distribution; quantum dots; trafficking.


Conflict of interest statement

The authors declare no conflict of interest. The funders had no role in the design of the study; in the collection, analyses, or interpretation of data; in the writing of the manuscript, or in the decision to publish the results.

Figures

Figure 1
Figure 1
Effects of CdSe/ZnS and InP/ZnS QDs on cell viability in ML-1 and HeLa cell lines measured by XTT reagents. ML-1 thyroid cancer cells or HeLa cells were cultured with varying doses of green and red CdSe/ZnS or InP/ZnS QDs for 24 h, then cell proliferation/viability levels were measured at each concentration using a spectrophotometer at 7 h after XTT treatment. (A) ML-1 thyroid cancer cells showed no significant reduction in cell viability at all concentrations of green or red CdSe/ZnS QDs. NTC, non-treated control. DMSO, positive control. (B) There was no significant decrease in ML-1 thyroid cancer cells at all concentrations of green or red InP/ZnS QDs. (C) Reduced viability was observed in HeLa cells at 167 µg/mL of green CdSe/ZnS QD treatment. (D) HeLa cells show a reduction in cell viability at 167 µg/mL of green InP/ZnS QD treatment and 167 µg/mL of red InP/ZnS QD treatment. (E) Cell viability test with green and red CdSe/ZnS in mouse-derived non-cancerous fibroblast cells. (F) Cell viability test with green and red InP/ZnS in mouse-derived non-cancerous fibroblast cells. Statistically significant results are indicated based on p-values: * = p < 0.05, ** = p < 0.01, *** = p < 0.001, **** = p < 0.0001.
Figure 2
Figure 2
ROS measurements with DHE at varied CdSe/ZnS and InP/ZnS QD concentrations. (A) ML-1 cells were treated with 28 µg/mL and 167 µg/mL of red CdSe/ZnS and InP/ZnS QDs for 24 h. (B) ML-1 cells were treated with 28 µg/mL and 167 µg/mL of green CdSe/ZnS and InP/ZnS QDs for 24 h. (C) HeLa cells were treated with 28 µg/mL and 167 µg/mL of red CdSe/ZnS and InP/ZnS QDs for 24 h. (D) HeLa cells were treated with 28 µg/mL and 167 µg/mL of green CdSe/ZnS and InP/ZnS QDs for 24 h. Statistically significant results are indicated based on p-values: * = p < 0.05.
Figure 3
Figure 3
Levels of early and late apoptosis after 24 h treatment of green and red CdSe/ZnS and InP/ZnS QDs. (A) Early apoptosis levels of ML-1 cells were recorded by a flow cytometer in samples treated with 167 µg/mL of red CdSe/ZnS and InP/ZnS QDs for 24 h. (B) Late apoptosis levels of ML-1 cells were recorded by a flow cytometer in samples treated with 167 µg/mL of red CdSe/ZnS and InP/ZnS QDs for 24 h. (C) Early apoptosis levels of HeLa cells were recorded by a flow cytometer in samples treated with 167 µg/mL of red CdSe/ZnS and InP/ZnS QDs for 24 h. (D) Late apoptosis levels of HeLa cells were recorded by a flow cytometer in samples treated with 167 µg/mL of red CdSe/ZnS and InP/ZnS QDs for 24 h. Statistically significant results are indicated based on p-values: * = p < 0.05, ** = p < 0.01, **** = p < 0.0001.
Figure 4
Figure 4
Representative confocal microscope images depicting subcellular localizations of green CdSe/ZnS-COOH QDs after 24 h treatment with QDs in HeLa cell culture. (A, top) Colocalization of the early endosome reference marker Rab5a-TagRFP with the QDs in the presence of serum. (A, bottom) Partial colocalization of QDs with Rab5a-TagRFP in cells grown in the medium lacking serum. The arrow indicates a spatial area of no colocalization between QDs and Rab5a-TagRFP. (B, top) Colocalization of the late endosome reference marker Rab7a-TagRFP with the QDs in the presence of serum. (B, bottom) Colocalization of QDs with Rab7a-TagRFP in cells grown in the medium lacking serum. (C, top) Colocalization of the lysosome reference marker LysoView 540 with the QDs in the presence of serum. (C, bottom) Colocalization of QDs with LysoView 540 in cells grown in the medium lacking serum. Scale bars correspond to 10 µm.
Figure 5
Figure 5
Representative confocal microscope images depicting subcellular localizations of green CdSe/ZnS-COOH QDs after 48 h treatment with QDs in HeLa cell culture. (A, top) Partial colocalization of the early endosome reference marker Rab5a-TagRFP with the QDs in the presence of serum. (A, bottom) Partial colocalization of QDs with Rab5a-TagRFP in cells grown in the medium lacking serum. Arrows indicate spatial areas of no colocalization between QDs and Rab5a-TagRFP. (B, top) Colocalization of the late endosome reference marker Rab7a-TagRFP with the QDs in the presence of serum. (B, bottom) Colocalization of QDs with Rab7a-TagRFP in cells grown in the medium lacking serum. (C, top) Colocalization of the lysosome reference marker LysoView 540 with the QDs in the presence of serum. (C, bottom) Colocalization of QDs with LysoView 540 in cells grown in the medium lacking serum. Scale bars correspond to 10 µm.
Figure 6
Figure 6
Representative confocal microscope images depicting subcellular localizations of green CdSe/ZnS-COOH QDs after 24 h treatment with QDs in ML-1 cell culture. (A, top) Colocalization of the early endosome reference marker Rab5a-TagRFP with the QDs in the presence of serum. (A, bottom) Colocalization of QDs with Rab5a-TagRFP in cells grown in the medium lacking serum. (B, top) Colocalization of the late endosome reference marker Rab7a-TagRFP with the QDs in the presence of serum. (B, bottom) Colocalization of QDs with Rab7a-TagRFP in cells grown in the medium lacking serum. (C, top) Colocalization of the lysosome reference marker LysoView 540 with the QDs in the presence of serum. (C, bottom) Colocalization of QDs with LysoView 540 in cells grown in the medium lacking serum. Scale bars correspond to 10 µm.
Figure 7
Figure 7
Representative confocal microscope images depicting subcellular localizations of green CdSe/ZnS-COOH QDs after 48 h treatment with QDs in ML-1 cell culture. (A, top) Colocalization of the early endosome reference marker Rab5a-TagRFP with the QDs in the presence of serum. (A, bottom) Colocalization of QDs with Rab5a-TagRFP in cells grown in the medium lacking serum. (B, top) Colocalization of the late endosome reference marker Rab7a-TagRFP with the QDs in the presence of serum. (B, bottom) Colocalization of QDs with Rab7a-TagRFP in cells grown in the medium lacking serum. (C, top) Colocalization of the lysosome reference marker LysoView 540 with the QDs in the presence of serum. (C, bottom) Colocalization of QDs with LysoView 540 in cells grown in the medium lacking serum. Scale bars correspond to 10 µm.
Figure 8
Figure 8
Colocalization assay depicting the level of colocalization between CdSe/ZnS QD and fluorescence organelle markers in HeLa cell culture. Graph bars represent the results of colocalization analysis using the JACoP plugin from ImageJ using Pearson’s correlation coefficient. Mean Pearson coefficient and standard deviation values for levels of colocalization between QDs and fluorescent organelle markers are indicated in the graph. The mean Pearson coefficient value for the level of colocalization between QDs and the early endosome in the culture with serum was statistically significantly higher than that for cells grown in the culture lacking serum (p = 0.028, via Prism GraphPad Dunnett test).
Figure 9
Figure 9
Colocalization assay depicting the level of colocalization between CdSe/ZnS QD and fluorescence organelle markers in ML-1 cell culture. Graph bars represent the results of colocalization analysis using the JACoP plugin from ImageJ using Pearson’s correlation coefficient. Mean Pearson coefficient and standard deviation values for levels of colocalization between QDs and fluorescent organelle markers are indicated in the graph.
Figure 10
Figure 10
The concentration of internalized QDs by ML-1 and HeLa cells treated with 50 and 100 µg/mL green CdSe/ZnS in serum+ and −mediums for 48 h. (A) The number of viable ML-1 cells that were treated with 50 and 100 µg/mL green CdSe/ZnS QDs in serum+ and −mediums after 48 h. (B) The number of viable HeLa cells that were treated with 50 and 100 µg/mL green CdSe/ZnS QDs in serum+ and −mediums after 48 h. (C) The concentration of internalized QDs by ML-1 that were treated with 50 and 100 µg/mL green CdSe/ZnS QDs in serum+ and −mediums after 48 h. (D) The concentration of internalized Cd by HeLa that were treated with 50 and 100 µg/mL green CdSe/ZnS QDs in serum+ and − media for 48 h. Statistically significant results are indicated based on p-values: * = p < 0.0133, ** = p < 0.01, *** = p < 0.001, **** = p < 0.0001.
Figure 11
Figure 11
A figure illustrating the ICP-OES method for quantifying the amount of internalized and released QDs under different treatment conditions: 50 µg/mL of green CdSe/ZnS QDs with or without serum as well as cells with 100 µg/mL cultured in serum− media for 24 h.
Figure 12
Figure 12
The concentration of secreted QDs by ML-1 and HeLa cells treated with 50 and 100 µg/mL green CdSe/ZnS in serum+ and −mediums for 24 h. (A) The concentration QDs in the culture media of HeLa that were treated with 50 and 100 µg/mL green CdSe/ZnS QDs in serum+ and −mediums at 24 h. (B) The concentration of secreted QDs by HeLa that were treated with 50 and 100 µg/mL green CdSe/ZnS QDs in serum+ and −mediums at 24 h. Statistically significant results are indicated based on p-values: * = p < 0.05, **** = p < 0.0001.
Figure 13
Figure 13
Proposed transportation kinetics of QDs in HeLa cells grown in the media with and without serum for 24 h. The models depict that the intracellular traffic kinetics of QDs in HeLa cells grown with serum (Upper) is noticeably distinctive from that of HeLa cells grown without serum (Bottom) after 24 h of QD treatment. (T1) indicates the transition of QDs from the endocytic vesicle towards the early endosome; (T2) indicates the transition of QDs from the early endosome towards the late endosome; (T3) indicates the transition of QDs from the late endosome to the lysosome. Each green arrow represents a slower transit rate of QDs in comparison with its counterpart rate indicated in red. Each red arrow represents a faster transit rate of QDs in comparison with its counterpart rate indicated in green.
Figure 14
Figure 14
Proposed transportation kinetics of QDs in ML-1 cells grown in the media with and without serum for 24 h. The models depict that the intracellular traffic kinetics of QDs in ML-1 cells grown with serum (Upper) is noticeably distinctive from that of ML-1 cells grown without serum (Bottom) after 24 h of QD treatment. (T1) indicates the transition of QDs from the endocytic vesicle towards the early endosome; (T2) indicates the transition of QDs from the early endosome towards the late endosome; (T3) indicates the transition of QDs from the late endosome to the lysosome.
Figure 15
Figure 15
Proposed transportation kinetics of QDs in HeLa cells grown in the media with and without serum for 48 h. A figure illustrating intracellular trafficking kinetics of QDs varies in HeLa cells grown with serum (Upper) and HeLa cells grown without serum (Bottom) 48 h after the treatment of QDs. (T1) indicates the transition of QDs from the endocytic vesicle towards the early endosome; (T2) indicates the transition of QDs from the early endosome towards the late endosome; (T3) indicates the transition of QDs from the late endosome to the lysosome. Each green arrow represents a slower transit rate of QDs in comparison with its counterpart rate indicated in red. Each red arrow represents a faster transit rate of QDs in comparison with its counterpart rate indicated in green.
Figure 16
Figure 16
Proposed transportation kinetics of QDs in ML-1 cells grown in media with and without serum for 48 h. A figure illustrating intracellular trafficking kinetics of QDs varies in ML-1 cells grown with serum (Upper) and ML-1 cells grown without serum (Bottom) cells 48 h after the treatment of QDs. (T1) indicates the transition of QDs from the endocytic vesicle towards the early endosome; (T2) indicates the transition of QDs from the early endosome towards the late endosome; (T3) indicates the transition of QDs from the late endosome to the lysosome. Each green arrow represents a slower transit rate of QDs in comparison with its counterpart rate indicated in red. Each red arrow represents a faster transit rate of QDs in comparison with its counterpart rate indicated in green.

Similar articles

Cited by

References

    1. Wegner K.D., Hildebrandt N. Quantum dots: Bright and versatile in vitro and in vivo fluorescence imaging biosensors. Chem. Soc. Rev. 2015;44:4792–4834. doi: 10.1039/C4CS00532E. - DOI - PubMed
    1. Derfus A.M., Chan W.C.W., Bhatia S.N. Probing the Cytotoxicity of Semiconductor Quantum Dots. Nano Lett. 2004;4:11–18. doi: 10.1021/nl0347334. - DOI - PMC - PubMed
    1. Michalet X., Pinaud F.F., Bentolila L.A., Tsay J.M., Doose S., Li J.J., Sundaresan G., Wu A.M., Gambhir S.S., Weiss S. Quantum Dots for Live Cells, in vivo Imaging, and Diagnostics. Science. 2005;307:538–544. doi: 10.1126/science.1104274. - DOI - PMC - PubMed
    1. Gao X., Cui Y., Levenson R.M., Chung L.W.K., Nie S. In vivo cancer targeting and imaging with semiconductor quantum dots. Nat. Biotechnol. 2004;22:969–976. doi: 10.1038/nbt994. - DOI - PubMed
    1. Xing Y., Chaudry Q., Shen C., Kong K.Y., Zhau H.E., Chung L.W., Petros J.A., O’Regan R.M., Yezhelyev M.V., Simons J.W., et al. Bioconjugated quantum dots for multiplexed and quantitative immunohistochemistry. Nat. Protoc. 2007;2:1152–1165. doi: 10.1038/nprot.2007.107. - DOI - PubMed

LinkOut - more resources